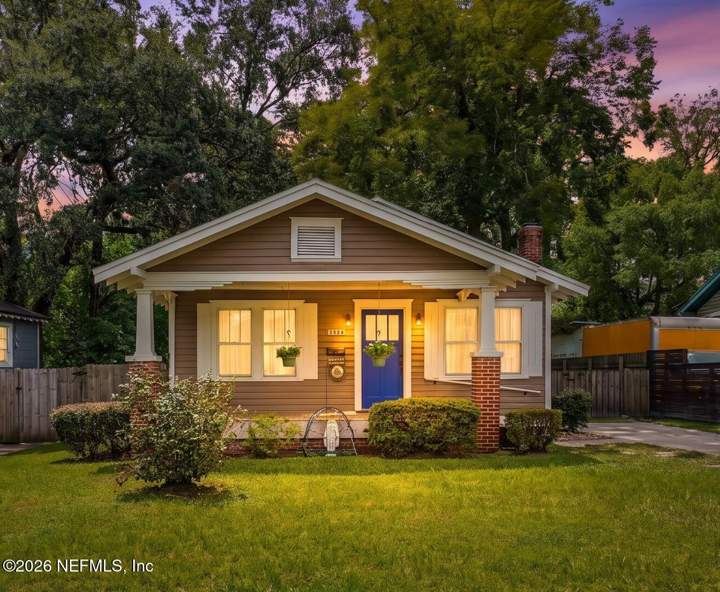
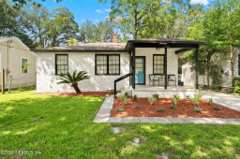
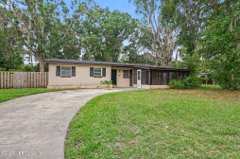
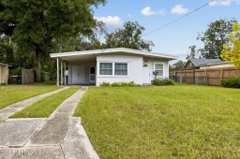
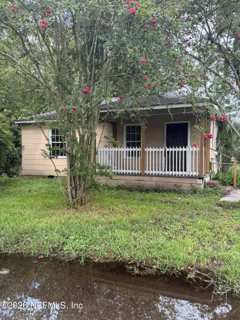
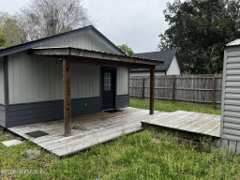
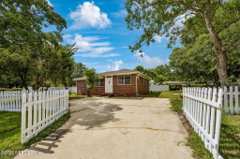
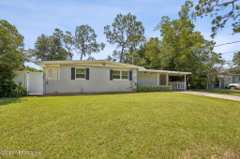
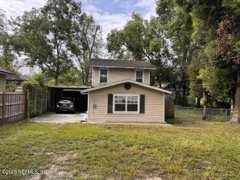
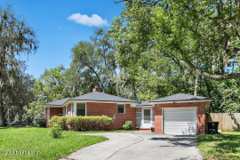
This home is asking $290 per square foot. Recent comparable sales: median $240 per square foot (30 homes). Homes for sale nearby: median $220 per square foot (30 homes).
Since last week: 5 new competing listings, 9 competitors left the market.
Competitor moves this week
Similar homes nearby: 7 price cuts, 1 came off the market
Same property type and size band, within 5 miles, in the last 7 days. Tap one to open it.
This home against 30 similar homes for sale now (within 3 mi) and 30 similar homes that sold in the last 6 months (within 3 mi): same property type, living area within 40%.
This home Active now (30) Sold (30)Tap any dot to open that home
Price vs. size
Price per square foot
Sold in the last 6 months: 30 homes, median $240 per sq ft; 28 priced below this home and 2 at or above it.
Homes for sale nearby: 30 homes, median $220 per sq ft; 28 priced below this home and 2 at or above it.
See these homes as a table
Home
Status
Days on market
Price
Sq ft
$/sq ft
Miles
3342 Dellwood Avenue
Active
21
$260,000
1,022
$254
0.1
3624 Myra Street
Active
7
$169,900
771
$220
0.1
3513 College Street
Active
149
$179,000
784
$228
0.1
698 Bridal Avenue
Active
134
$207,000
924
$224
0.1
683 Bridal Avenue
Active
39
$209,900
1,144
$183
0.2
3613 College Place
Active
7
$279,000
984
$284
0.2
3348 Phyllis Street
Active
223
$240,000
1,083
$222
0.2
3302 College Street
Active
70
$195,000
1,174
$166
0.3
4034 Green Street
Active
167
$199,000
1,067
$187
0.3
628 Herman Street
Active
80
$204,900
1,064
$193
0.3
4051 Myra Street
Active
134
$210,000
834
$252
0.3
4065 Dellwood Avenue
Active
182
$230,000
1,202
$191
0.3
642 Meteor Street
Active
24
$170,000
1,008
$169
0.4
3119 Rosselle Street
Active
57
$215,000
1,018
$211
0.4
412 Thompson Street
Active
9
$125,000
728
$172
0.4
3122 Post Street
Active
168
$234,990
1,064
$221
0.5
3052 College Street
Active
268
$229,900
926
$248
0.5
3002 Myra Street
Active
92
$214,500
888
$242
0.5
3223 Hunt Street
Active
86
$130,000
1,141
$114
0.5
3232 Dignan Street
Active
85
$64,500
759
$85
0.6
2974 Gilmore Street
Active
135
$170,000
1,088
$156
0.6
4511 French Street
Active
82
$322,500
1,198
$269
0.6
2971 Rosselle Street
Active
7
$199,000
1,189
$167
0.6
1167 Wolfe Street
Active
199
$179,900
931
$193
0.7
2989 Collier Avenue
Active
21
$390,000
1,316
$296
0.7
3131 Dignan Street
Active
26
$180,000
792
$227
0.7
3305 Thomas Street
Active
17
$209,990
1,253
$168
0.7
4538 Nolan Street
Active
51
$69,000
874
$79
0.7
3522 Randall Street
Active
155
$425,000
1,277
$333
0.7
2963 Collier Avenue
Active
5
$289,990
1,046
$277
0.7
3526 Ernest Street
Sold Sep 9, 2026
—
$219,900
957
$230
0.1
3332 Dellwood Avenue
Sold Jun 15, 2026
67
$184,000
1,023
$180
0.1
3333 Ernest Street
Sold May 15, 2026
234
$207,000
984
$210
0.1
3259 College Street
Sold Jun 8, 2026
5
$255,000
1,056
$241
0.2
4015 College Street
Sold Jul 14, 2026
27
$239,000
970
$246
0.2
3207 Dellwood Avenue
Sold Jun 15, 2026
1
$165,000
824
$200
0.3
4037 Gilmore Street
Sold Oct 9, 2026
—
$182,500
1,000
$182
0.3
933 Talbot Avenue
Sold May 21, 2026
165
$320,000
1,155
$277
0.4
560 Comet Street
Sold May 29, 2026
30
$270,000
1,190
$227
0.4
3045 Dellwood Avenue
Sold Jul 1, 2026
20
$271,000
1,096
$247
0.5
3230 Mayflower Street
Sold Jun 15, 2026
59
$310,000
1,292
$240
0.5
822 Talbot Avenue
Sold Apr 27, 2026
14
$260,000
1,048
$248
0.5
4022 Antisdale Street
Sold Aug 28, 2026
—
$315,000
1,095
$288
0.5
4510 Sappho Avenue
Sold Sep 21, 2026
—
$275,000
1,025
$268
0.6
4560 Crescent Street
Sold Jul 23, 2026
—
$295,000
1,196
$247
0.6
3557 Dillon Street
Sold May 21, 2026
10
$180,000
1,035
$174
0.6
1224 Hollywood Avenue
Sold May 29, 2026
5
$424,200
1,300
$326
0.6
3119 Cecelia Street
Sold Oct 21, 2026
—
$55,000
768
$72
0.6
4612 College Street
Sold Sep 17, 2026
—
$280,000
1,092
$256
0.7
3517 Ola Street
Sold Aug 28, 2026
—
$325,000
1,316
$247
0.7
1228 Edgewood Avenue
Sold Jun 30, 2026
95
$270,000
1,272
$212
0.7
509 Murray Drive
Sold Oct 2, 2026
—
$250,000
1,173
$213
0.7
4560 French Street
Sold Apr 29, 2026
72
$275,000
1,228
$224
0.7
4510 Post Street
Sold Jun 18, 2026
18
$225,000
936
$240
0.7
1097 McDuff Avenue
Sold Sep 1, 2026
—
$155,000
943
$164
0.7
4713 Royal Avenue
Sold Aug 5, 2026
56
$290,000
1,230
$236
0.7
1042 Lark Street
Sold May 15, 2026
3
$321,000
1,257
$255
0.8
2892 Gilmore Street
Sold Jul 24, 2026
—
$210,120
1,070
$196
0.8
4612 Polaris Street
Sold Jul 15, 2026
5
$290,000
1,018
$285
0.8
1277 Talbot Avenue
Sold Jul 10, 2026
106
$472,500
1,296
$365
0.8
Active listings from Momentum's hourly MLS refresh (all brokerages); sold prices are MLS closed-sale records. Tap any dot: active homes open their listing, sold homes open their community guide. Context only — not an appraisal or valuation. Deemed reliable but not guaranteed.
How it's doing
Performance
43days on market (MLS) · listed about Sep 11
First seen on movewithmomentum.com Sep 11, 2026 at $275,000
Showings, saves and portal inquiries are not in this data.
Days on market per the MLS. Google figures are Search Console data for this listing's page on movewithmomentum.com (28 days to Oct 21, 2026); they count search appearances and clicks, not all visits. Price changes are our own observations.
Competition
New listings nearby this week
8 similar homes listed by any brokerage within 5 miles in the last 7 days at a comparable price — the buyers touring this home are seeing these too.
Source: Momentum's hourly MLS refresh, all brokerages. Listings held by brokerages other than Momentum Realty are marked with the listing broker. Deemed reliable but not guaranteed.
Just sold
Recent closed sales nearby
8 closed sales of a similar home within 5 miles in the last 90 days. Tap one to open its neighborhood guide.
Content on this page is compiled from public records, MLS data, and automated data sources, and may contain errors or be out of date. It is provided for general information only and is not a representation about any specific property, community, builder, or association. Verify all information independently before relying on it.