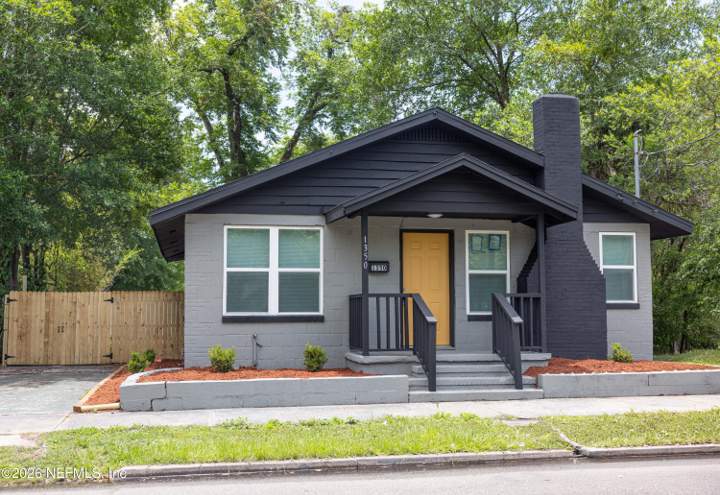
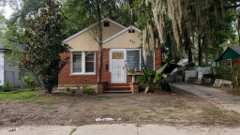
This home is asking $181 per square foot. Recent comparable sales: median $110 per square foot (30 homes). Homes for sale nearby: median $125 per square foot (30 homes).
Since last week: 6 new competing listings, 8 competitors left the market.
Competitor moves this week
Similar homes nearby: 3 price cuts, 1 went under contract, 4 came off the market
Same property type and size band, within 5 miles, in the same part of Jacksonville (the Northside), in the last 7 days. Tap one to open it.
This home against 30 similar homes for sale now (within 3 mi) and 30 similar homes that sold in the last 6 months (within 3 mi): same property type, living area within 40%, all in the same part of Jacksonville (the Northside).
This home Active now (30) Sold (30)Tap a dot to open that home's page (only homes with a page on our site open)
Price vs. size
Price per square foot
Sold in the last 6 months: 30 homes, median $110 per sq ft; 29 priced below this home and 1 at or above it.
Homes for sale nearby: 30 homes, median $125 per sq ft; 28 priced below this home and 2 at or above it.
See these homes as a table
Home
Status
Days on market
Price
Sq ft
$/sq ft
Miles
1410 21st Street
Active
456
$140,000
1,162
$120
0.1
1264 W 19th Street
Active
197
$190,000
1,056
$180
0.1
1413 W 21st Street
Active
167
$114,900
920
$125
0.1
1514 W 22nd Street
Active
82
$99,000
1,092
$91
0.2
1185 W 20th Street
Active
42
$150,000
960
$156
0.3
1440 W 24th Street
Active
116
$120,000
858
$140
0.3
1554 W 17th Street
Active
19
$99,900
834
$120
0.3
1567 W 17th Street
Active
43
$67,900
852
$80
0.3
1130 W 21st Street
Active
0
$125,000
960
$130
0.3
1585 W 15th Street
Active
34
$135,000
1,035
$130
0.3
1516 W 25th Street
Active
83
$125,000
950
$132
0.4
1534 W 13th Street
Active
26
$88,000
816
$108
0.4
1599 W 22nd Street
Active
11
$125,000
1,106
$113
0.4
1192 W 12th Street
Active
144
$85,000
852
$100
0.4
1149 W 12th Street
Active
8
$60,000
1,136
$53
0.4
1511 W 10th Street
Active
9
$129,900
832
$156
0.5
1425 W 9th Street
Active
9
$80,000
880
$91
0.5
1109 W 26th Street
Active
9
$99,500
992
$100
0.5
1137 W 27th Street
Active
14
$89,900
1,016
$88
0.5
1545 W 9th Street
Active
9
$94,500
1,038
$91
0.5
1603 W 27th Street
Active
43
$124,500
870
$143
0.5
921 W 17th Street
Active
39
$125,000
1,044
$120
0.6
1265 W 30th Street
Active
162
$79,000
704
$112
0.6
1753 W 12th Street
Active
26
$119,000
827
$144
0.6
1494 8th Street
Active
42
$137,500
1,100
$125
0.6
1630 W 28th Street
Active
100
$76,500
1,000
$76
0.6
1465 Mitchell Street
Active
83
$120,000
940
$128
0.6
2120 N Davis Street
Active
22
$159,900
1,056
$151
0.7
1741 Tyler Street
Active
21
$149,900
732
$205
0.7
1749 W 27th Street
Active
14
$200,000
1,027
$195
0.7
1409 W 21st Street
Sold Nov 6, 2026
—
$139,000
1,144
$122
0.1
1517 W 22nd Street
Sold Aug 26, 2026
—
$28,000
846
$33
0.3
1149 W 12th Street
Sold Oct 29, 2026
—
$32,500
1,136
$29
0.4
3210 Stuart Street
Sold Aug 4, 2026
9
$175,000
1,169
$150
0.4
1711 W 24th Street
Sold Sep 28, 2026
—
$32,000
696
$46
0.5
1323 W 30th Street
Sold Jun 3, 2026
14
$115,000
962
$120
0.6
2727 N N Davis Rd Street
Sold May 22, 2026
67
$78,000
904
$86
0.6
1239 McConihe Street
Sold Aug 11, 2026
—
$79,817
1,030
$77
0.6
1202 W 32nd Street
Sold Aug 10, 2026
172
$90,000
1,056
$85
0.7
3711 N Davis Street
Sold Oct 5, 2026
—
$58,900
895
$66
0.7
2009 W 17th Street
Sold Jun 15, 2026
13
$60,000
1,037
$58
0.9
2033 W 13th Street
Sold Sep 22, 2026
—
$190,000
1,031
$184
1.0
1813 W 5th Street
Sold Aug 10, 2026
40
$123,000
1,000
$123
1.0
1807 W 4th Street #N/A
Sold Oct 27, 2026
—
$185,500
1,164
$159
1.0
2118 W 18th Street
Sold Aug 20, 2026
—
$76,000
920
$83
1.1
1938 W 4th Street
Sold Sep 9, 2026
—
$182,000
1,164
$156
1.2
2324 W 16th Street
Sold May 29, 2026
40
$175,000
1,164
$150
1.4
3838 Penton Street
Sold May 21, 2026
60
$110,000
950
$116
1.5
651 W 46th Street
Sold Jul 2, 2026
37
$67,000
980
$68
1.6
3815 Marlo Street
Sold Oct 23, 2026
—
$60,000
936
$64
1.7
1340 Carvill Avenue
Sold Oct 28, 2026
—
$90,000
888
$101
1.7
2564 W 23rd Street
Sold Oct 29, 2026
—
$125,000
1,121
$112
1.7
547 W 49th Street
Sold Jun 29, 2026
22
$152,000
936
$162
1.8
5902 Springfield Boulevard
Sold Oct 27, 2026
—
$165,000
1,157
$143
1.8
7060 Marvin Avenue
Sold Aug 28, 2026
—
$142,000
1,136
$125
1.8
449 Sunset Drive
Sold Jul 2, 2026
123
$145,000
1,061
$137
1.9
35 W 44th Street
Sold Oct 15, 2026
—
$61,000
936
$65
1.9
404 Demper Drive
Sold Jun 17, 2026
251
$120,000
1,176
$102
1.9
7432 Gainesville Avenue
Sold May 18, 2026
64
$115,000
1,042
$110
1.9
2332 Westbrook Circle
Sold Aug 26, 2026
—
$60,000
873
$69
2.0
Active listings from Momentum's hourly MLS refresh (all brokerages); sold prices are MLS closed-sale records. Tap a dot to open that home's own page on our site (its listing, or its sold or off-market page); homes without a page here are not linked. Context only — not an appraisal or valuation. Deemed reliable but not guaranteed.
How it's doing
Performance
153days on market (MLS) · listed about Jun 12
First seen on movewithmomentum.com Jul 2, 2026 at $160,000
Aug 4, 2026: $160,000 → $155,000 (-3.1%)
Sep 19, 2026: $155,000 → $152,000 (-1.9%)
Showings, saves and portal inquiries are not in this data.
Days on market per the MLS. Google figures are Search Console data for this listing's page on movewithmomentum.com (28 days to Nov 11, 2026); they count search appearances and clicks, not all visits. Price changes are our own observations.
Competition
New listings nearby this week
8 similar homes listed by any brokerage within 5 miles in the same part of Jacksonville (the Northside) in the last 7 days at a comparable price — the buyers touring this home are seeing these too.
Source: Momentum's hourly MLS refresh, all brokerages. Listings held by brokerages other than Momentum Realty are marked with the listing broker. Deemed reliable but not guaranteed.
Just sold
Recent closed sales nearby
8 closed sales of a similar home within 5 miles in the same part of Jacksonville (the Northside) in the last 90 days. Tap one to open its neighborhood guide.