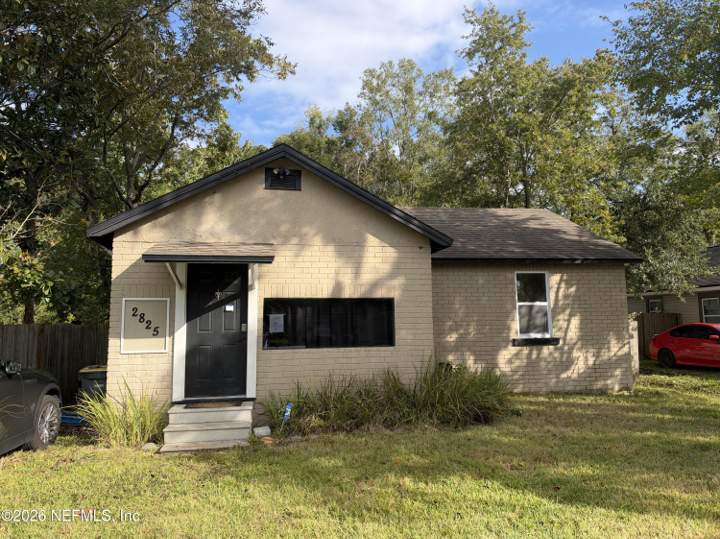
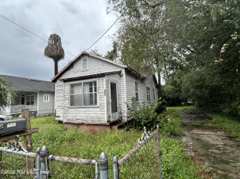
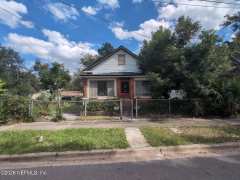
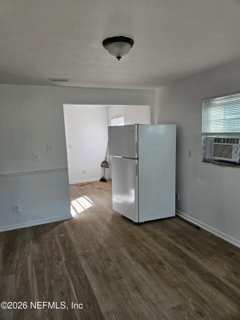
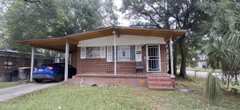
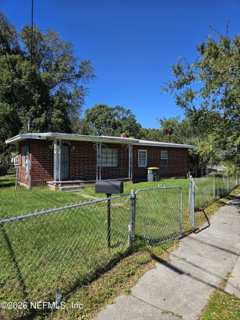
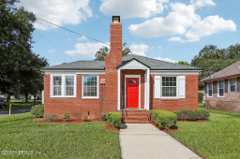
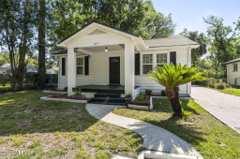
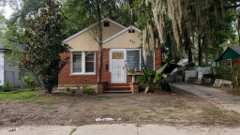
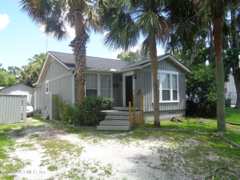
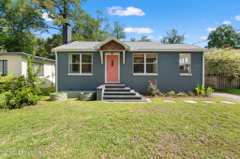
This home is asking $88 per square foot. Recent comparable sales: median $139 per square foot (30 homes). Homes for sale nearby: median $141 per square foot (30 homes).
Competitor moves this week
Similar homes nearby: 7 price cuts, 1 went under contract
Same property type and size band, within 5 miles, in the last 7 days. Tap one to open it.
This home against 30 similar homes for sale now (within 3 mi) and 30 similar homes that sold in the last 6 months (within 3 mi): same property type, living area within 40%.
This home Active now (30) Sold (30)Tap any dot to open that home
Price vs. size
Price per square foot
Sold in the last 6 months: 30 homes, median $139 per sq ft; 7 priced below this home and 23 at or above it.
Homes for sale nearby: 30 homes, median $141 per sq ft; 4 priced below this home and 26 at or above it.
See these homes as a table
Home
Status
Days on market
Price
Sq ft
$/sq ft
Miles
825 St Clair Street
Active
2
$129,000
780
$165
0.1
942 Saranac Street
Active
78
$159,900
927
$172
0.2
744 Mackinaw Street
Active
9
$169,000
1,281
$132
0.2
3026 Lowell Avenue
Active
110
$238,904
1,209
$198
0.3
2644 Commonwealth Avenue
Active
70
$235,000
1,096
$214
0.3
2611 Beaverbrook Place
Active
39
$155,500
1,100
$141
0.4
922 Prospect Street
Active
80
$139,900
1,300
$108
0.4
1098 Detroit Street
Active
22
$124,900
1,322
$94
0.4
3028 W 1st Street
Active
44
$227,990
1,209
$189
0.4
3135 Sunnybrook Court
Active
1
$139,900
1,308
$107
0.5
3216 Deason Avenue
Active
2
$210,000
1,027
$204
0.5
879 N McDuff Avenue
Active
185
$210,000
1,211
$173
0.6
871 N McDuff Avenue
Active
185
$210,000
1,211
$173
0.6
3230 Deason Avenue
Active
10
$225,000
1,114
$202
0.6
3323 Columbus Avenue
Active
41
$164,999
1,245
$133
0.6
3305 Thomas Street
Active
25
$199,900
1,253
$160
0.6
2965 Sunset Street
Active
36
$179,500
1,056
$170
0.6
3267 Sunnybrook Avenue
Active
48
$149,900
1,010
$148
0.6
1060 Woodstock Avenue
Active
36
$120,000
1,128
$106
0.6
3162 2nd St Circle
Active
127
$85,000
1,002
$85
0.6
2923 W 5th Street
Active
96
$110,000
912
$121
0.6
3040 W 5th Street
Active
124
$177,500
1,070
$166
0.7
3229 Dignan Street
Active
12
$59,499
1,122
$53
0.7
3302 Dignan Street
Active
164
$100,000
1,191
$84
0.7
1074 Hood Avenue
Active
130
$127,000
1,088
$117
0.7
3131 Dignan Street
Active
34
$180,000
792
$227
0.8
3232 Dignan Street
Active
93
$64,500
759
$85
0.8
760 Westbrook Road
Active
32
$115,000
898
$128
0.8
1041 Seminole Avenue
Active
51
$127,000
1,166
$109
0.8
2846 W 8th Street
Active
2
$120,000
929
$129
0.8
3021 Commonwealth Avenue
Sold Sep 11, 2026
—
$174,000
1,080
$161
0.3
3036 Commonwealth Avenue
Sold Jul 31, 2026
49
$162,900
938
$174
0.3
1027 Woodstock Avenue
Sold Jul 22, 2026
164
$120,000
918
$131
0.6
3242 Deason Avenue
Sold May 5, 2026
21
$223,500
1,197
$187
0.6
3557 Dillon Street
Sold May 21, 2026
10
$180,000
1,035
$174
0.6
2332 Westbrook Circle
Sold Aug 26, 2026
—
$60,000
873
$69
0.7
156 Willow Branch Avenue
Sold Jun 16, 2026
136
$105,000
1,268
$83
0.8
3119 Cecelia Street
Sold Oct 21, 2026
—
$55,000
768
$72
0.9
2972 Dignan Street
Sold Aug 25, 2026
—
$78,500
1,061
$74
0.9
2915 Fitzgerald Street
Sold May 21, 2026
75
$147,000
1,248
$118
1.0
2962 Spencer Street
Sold Jul 30, 2026
127
$117,500
1,112
$106
1.0
2919 Dignan Street
Sold Aug 19, 2026
—
$68,000
1,158
$59
1.0
2916 W 11th Street
Sold May 29, 2026
47
$111,500
894
$125
1.0
2929 Spencer Street
Sold Aug 21, 2026
—
$127,500
975
$131
1.0
2908 Spencer Street
Sold Jun 15, 2026
133
$160,500
1,100
$146
1.1
4037 Gilmore Street
Sold Oct 9, 2026
—
$182,500
1,000
$182
1.2
3333 Ernest Street
Sold May 15, 2026
234
$207,000
984
$210
1.2
1916 Cotant Street
Sold May 8, 2026
188
$120,000
1,290
$93
1.2
2870 Lenox Avenue
Sold Sep 21, 2026
—
$112,500
1,318
$85
1.2
2774 Fitzgerald Street
Sold Jun 22, 2026
67
$155,000
1,112
$139
1.2
3526 Ernest Street
Sold Sep 9, 2026
—
$219,900
957
$230
1.2
3104 W 15th Street
Sold Sep 18, 2026
—
$213,000
1,197
$178
1.2
3207 Dellwood Avenue
Sold Jun 15, 2026
1
$165,000
824
$200
1.3
3332 Dellwood Avenue
Sold Jun 15, 2026
67
$184,000
1,023
$180
1.3
560 Comet Street
Sold May 29, 2026
30
$270,000
1,190
$227
1.3
3045 Dellwood Avenue
Sold Jul 1, 2026
20
$271,000
1,096
$247
1.3
2553 Martha Street
Sold May 11, 2026
67
$113,000
1,290
$88
1.4
957 Odessa Drive
Sold Jul 2, 2026
17
$80,000
1,040
$77
1.4
2271 11th Street
Sold Aug 28, 2026
—
$195,646
1,201
$163
1.4
2408 Robert Street
Sold Sep 3, 2026
—
$177,250
1,314
$135
1.4
Active listings from Momentum's hourly MLS refresh (all brokerages); sold prices are MLS closed-sale records. Tap any dot: active homes open their listing, sold homes open their community guide. Context only — not an appraisal or valuation. Deemed reliable but not guaranteed.
How it's doing
Performance
3days on market (MLS) · listed about Oct 29
First seen on movewithmomentum.com Oct 28, 2026 at $84,000
Showings, saves and portal inquiries are not in this data.
Days on market per the MLS. Google figures are Search Console data for this listing's page on movewithmomentum.com (28 days to Oct 31, 2026); they count search appearances and clicks, not all visits. Price changes are our own observations.
Competition
New listings nearby this week
8 similar homes listed by any brokerage within 5 miles in the last 7 days at a comparable price — the buyers touring this home are seeing these too.
Source: Momentum's hourly MLS refresh, all brokerages. Listings held by brokerages other than Momentum Realty are marked with the listing broker. Deemed reliable but not guaranteed.
Just sold
Recent closed sales nearby
8 closed sales of a similar home within 5 miles in the last 90 days. Tap one to open its neighborhood guide.