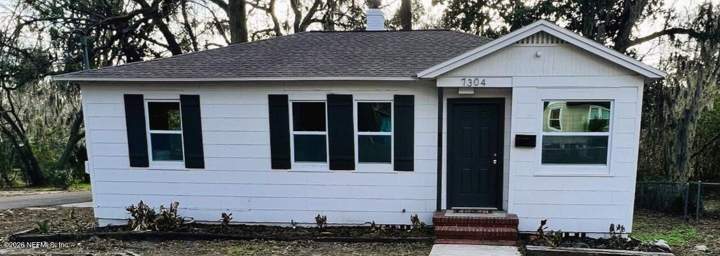
This home is asking $228 per square foot. Recent comparable sales: median $113 per square foot (30 homes). Homes for sale nearby: median $146 per square foot (30 homes).
Since last week: 9 new competing listings, 8 competitors left the market.
Competitor moves this week
Similar homes nearby: 7 price cuts, 1 went under contract
Same property type and size band, within 5 miles, in the same part of Jacksonville (the Northside), in the last 7 days. Tap one to open it.
This home against 30 similar homes for sale now (within 3 mi) and 30 similar homes that sold in the last 6 months (within 3 mi): same property type, living area within 40%, all in the same part of Jacksonville (the Northside).
This home Active now (30) Sold (30)Tap a dot to open that home's page (only homes with a page on our site open)
Price vs. size
Price per square foot
Sold in the last 6 months: 30 homes, median $113 per sq ft; 29 priced below this home and 1 at or above it.
Homes for sale nearby: 30 homes, median $146 per sq ft; 29 priced below this home and 1 at or above it.
See these homes as a table
Home
Status
Days on market
Price
Sq ft
$/sq ft
Miles
7208 Elwood Avenue
Active
96
$114,500
720
$159
0.1
459 W 65th Street
Active
57
$112,900
1,056
$107
0.1
402 W 63rd Street
Active
126
$115,000
800
$144
0.2
553 W 61st Street
Active
715
$159,000
813
$196
0.2
463 W 59th Street
Active
59
$225,000
1,247
$180
0.3
366 W 67th Street
Active
28
$171,999
1,024
$168
0.3
7211 N Pearl Street
Active
22
$94,900
988
$96
0.3
385 Duray Court
Active
3
$110,000
964
$114
0.4
6737 Perry Street
Active
14
$149,500
1,228
$122
0.4
204 W 61st Street
Active
17
$139,900
1,152
$121
0.4
6802 Barberie Street
Active
125
$149,999
1,115
$135
0.4
820 Gardenia Lane
Active
52
$129,900
980
$133
0.5
913 Carrollton Road
Active
41
$238,990
1,209
$198
0.5
202 W 67th Street
Active
52
$269,000
1,018
$264
0.5
210 W 54th Street
Active
41
$228,990
1,222
$187
0.6
150 W 66th Street
Active
56
$212,900
1,205
$177
0.6
7180 Lucky Drive
Active
24
$73,000
1,035
$71
0.6
7173 Lucky Drive
Active
65
$145,000
1,052
$138
0.6
904 Kennard Street
Active
78
$224,000
1,216
$184
0.6
938 Ardoon Street
Active
59
$225,000
1,220
$184
0.7
1024 Kenmore Street
Active
10
$109,900
1,152
$95
0.8
6946 Oakwood Street
Active
146
$128,000
1,250
$102
0.9
865 Brandywine Street
Active
10
$129,900
847
$153
0.9
8030 Hawthorne Street
Active
100
$140,000
1,082
$129
0.9
7329 Wilder Avenue
Active
129
$145,000
1,181
$123
1.0
235 W 43rd Street
Active
10
$164,900
734
$225
1.0
147 43rd Street
Active
103
$219,490
1,201
$183
1.0
6918 Park Circle
Active
70
$179,900
1,150
$156
1.0
502 E 60th Street
Active
1
$135,020
1,104
$122
1.0
516 E 58th Street
Active
96
$180,000
1,232
$146
1.1
473 W 65th Street
Sold Jun 12, 2026
18
$95,000
884
$107
0.1
411 W 62nd Street
Sold Jul 2, 2026
42
$169,900
895
$190
0.2
356 W 62nd Street
Sold Jul 24, 2026
57
$179,900
1,086
$166
0.2
6610 Sunset Drive
Sold Sep 9, 2026
—
$20,000
943
$21
0.5
449 Sunset Drive
Sold Jul 2, 2026
123
$145,000
1,061
$137
0.5
7611 Tarleton Road
Sold Sep 25, 2026
—
$120,000
887
$135
0.5
404 Demper Drive
Sold Jun 17, 2026
251
$120,000
1,176
$102
0.6
478 Demper Drive
Sold Aug 14, 2026
—
$149,000
1,203
$124
0.6
7007 Lucky Drive
Sold Jun 26, 2026
34
$70,000
768
$91
0.6
5902 Springfield Boulevard
Sold Oct 27, 2026
—
$165,000
1,157
$143
0.7
547 W 49th Street
Sold Jun 29, 2026
22
$152,000
936
$162
0.7
122 W 63rd Street
Sold Nov 2, 2026
—
$85,000
1,207
$70
0.7
104 W 54th Street
Sold Aug 26, 2026
—
$175,000
1,060
$165
0.7
651 W 46th Street
Sold Jul 2, 2026
37
$67,000
980
$68
0.7
7905 Paul Jones Drive
Sold Jun 5, 2026
20
$129,900
836
$155
0.8
1340 Carvill Avenue
Sold Oct 28, 2026
—
$90,000
888
$101
0.8
862 Bunker Hill Boulevard
Sold Sep 14, 2026
—
$142,700
1,012
$141
0.8
7060 Marvin Avenue
Sold Aug 28, 2026
—
$142,000
1,136
$125
0.9
8126 Paul Jones Drive
Sold Oct 21, 2026
—
$148,400
812
$183
1.0
35 W 44th Street
Sold Oct 15, 2026
—
$61,000
936
$65
1.0
1004 Stark Street
Sold Nov 6, 2026
—
$239,990
1,209
$199
1.1
1023 Brandywine Street
Sold Jul 31, 2026
14
$90,000
932
$97
1.1
7909 Wainwright Drive
Sold Jul 8, 2026
11
$114,000
1,066
$107
1.1
1049 Stark Street
Sold May 27, 2026
225
$125,000
1,103
$113
1.1
265 E 47th Street
Sold Aug 24, 2026
—
$65,000
952
$68
1.1
299 E 48th Street
Sold May 27, 2026
50
$66,500
792
$84
1.1
7432 Gainesville Avenue
Sold May 18, 2026
64
$115,000
1,042
$110
1.3
8339 Concord Boulevard
Sold Jun 30, 2026
3
$399,000
1,246
$320
1.3
401 44th Street
Sold Oct 26, 2026
—
$30,000
812
$37
1.4
1202 W 32nd Street
Sold Aug 10, 2026
172
$90,000
1,056
$85
1.6
Active listings from Momentum's hourly MLS refresh (all brokerages); sold prices are MLS closed-sale records. Tap a dot to open that home's own page on our site (its listing, or its sold or off-market page); homes without a page here are not linked. Context only — not an appraisal or valuation. Deemed reliable but not guaranteed.
How it's doing
Performance
254days on market (MLS) · listed about Mar 4
First seen on movewithmomentum.com Jul 2, 2026 at $240,000
Oct 15, 2026: $240,000 → $204,000 (-15.0%)
Showings, saves and portal inquiries are not in this data.
Days on market per the MLS. Google figures are Search Console data for this listing's page on movewithmomentum.com (28 days to Nov 12, 2026); they count search appearances and clicks, not all visits. Price changes are our own observations.
Competition
New listings nearby this week
8 similar homes listed by any brokerage within 5 miles in the same part of Jacksonville (the Northside) in the last 7 days at a comparable price — the buyers touring this home are seeing these too.
Source: Momentum's hourly MLS refresh, all brokerages. Listings held by brokerages other than Momentum Realty are marked with the listing broker. Deemed reliable but not guaranteed.
Just sold
Recent closed sales nearby
8 closed sales of a similar home within 5 miles in the same part of Jacksonville (the Northside) in the last 90 days. Tap one to open its neighborhood guide.