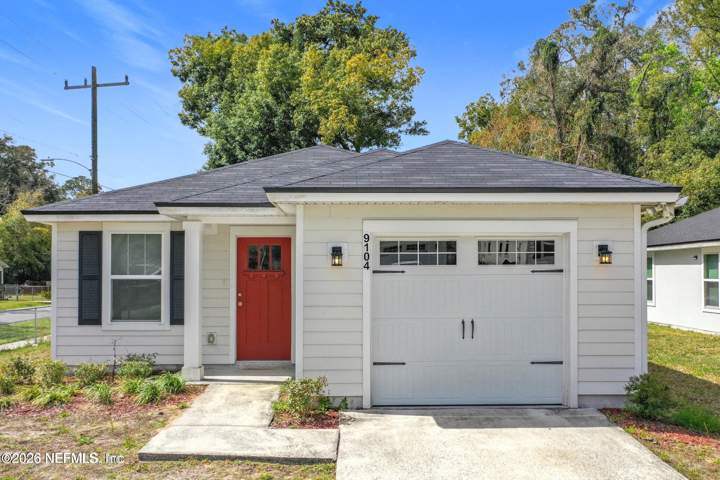
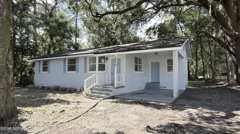
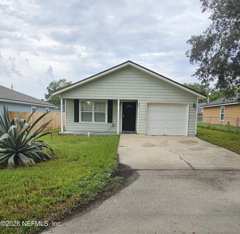
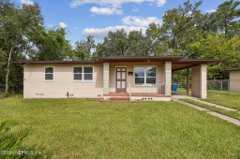
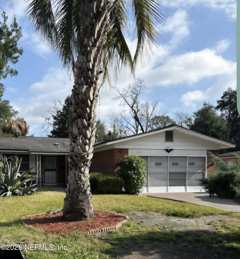
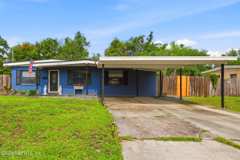
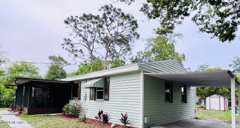
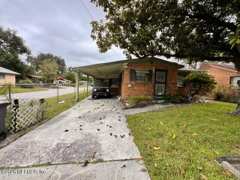
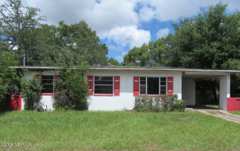
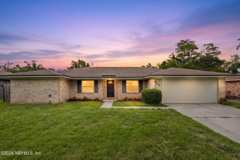
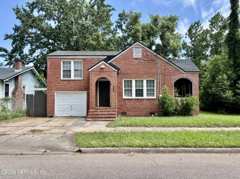
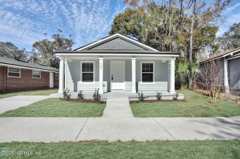
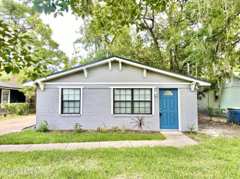
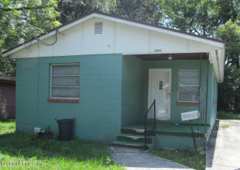
This home is asking $156 per square foot. Recent comparable sales: median $138 per square foot (30 homes). Homes for sale nearby: median $138 per square foot (30 homes).
Since last week: 7 new competing listings, 9 competitors left the market.
Competitor moves this week
Similar homes nearby: 7 price cuts, 1 came off the market
Same property type and size band, within 5 miles, in the last 7 days. Tap one to open it.
This home against 30 similar homes for sale now (within 3 mi) and 30 similar homes that sold in the last 6 months (within 3 mi): same property type, living area within 40%.
This home Active now (30) Sold (30)Tap any dot to open that home
Price vs. size
Price per square foot
Sold in the last 6 months: 30 homes, median $138 per sq ft; 21 priced below this home and 9 at or above it.
Homes for sale nearby: 30 homes, median $138 per sq ft; 20 priced below this home and 10 at or above it.
See these homes as a table
Home
Status
Days on market
Price
Sq ft
$/sq ft
Miles
9061 Monroe Avenue
Active
125
$115,000
920
$125
0.0
9076 Madison Avenue
Active
13
$114,900
752
$153
0.0
9049 Jackson Avenue
Active
85
$199,990
1,218
$164
0.1
9023 Jackson Avenue
Active
20
$195,000
1,440
$135
0.1
9114 Harrison Avenue
Active
90
$132,250
828
$160
0.1
9061 Harrison Avenue
Active
63
$192,000
1,215
$158
0.2
9037 Washington Avenue
Active
81
$110,000
871
$126
0.2
9046 Tyler Avenue
Active
83
$199,000
1,038
$192
0.2
8903 Washington Avenue
Active
12
$85,000
1,024
$83
0.3
1440 Grand Street
Active
8
$225,000
1,213
$185
0.3
9172 2nd Avenue
Active
257
$194,900
1,488
$131
0.3
9506 Harriet Avenue
Active
48
$219,900
1,324
$166
0.4
8943 3rd Avenue
Active
38
$170,000
1,123
$151
0.4
9620 Harriet Avenue
Active
233
$177,000
1,000
$177
0.5
8956 5th Avenue
Active
39
$185,000
1,361
$136
0.5
9256 5th Avenue
Active
3
$149,900
1,035
$145
0.5
9744 Sappington Avenue
Active
84
$250,000
1,368
$183
0.5
8720 4th Avenue
Active
349
$137,500
1,150
$120
0.6
9056 8th Avenue
Active
51
$75,000
870
$86
0.6
2243 5th Avenue
Active
8
$105,000
780
$135
0.7
8617 3rd Avenue
Active
104
$115,000
1,048
$110
0.7
2235 3rd Avenue
Active
23
$240,000
1,196
$201
0.7
8384 Delaware Avenue
Active
167
$125,000
1,276
$98
0.7
9625 Campus Avenue
Active
32
$175,000
1,242
$141
0.8
9258 11th Avenue
Active
169
$109,000
1,016
$107
0.8
2356 3rd Avenue
Active
51
$139,999
1,032
$136
0.8
2371 Jayson Avenue
Active
138
$79,900
792
$101
0.9
8004 Delaware Avenue
Active
69
$146,900
1,064
$138
0.9
2372 2nd Avenue
Active
17
$124,900
1,030
$121
0.9
9460 Scaup Way
Active
138
$289,900
1,569
$185
0.9
9071 3rd Avenue
Sold Oct 5, 2026
—
$115,000
850
$135
0.4
9238 2nd Avenue
Sold Jun 8, 2026
196
$75,000
1,512
$50
0.4
9070 3rd Avenue
Sold Jun 4, 2026
142
$170,000
1,300
$131
0.4
8832 4th Avenue
Sold Sep 18, 2026
—
$84,000
1,176
$71
0.5
8942 5th Avenue
Sold Aug 12, 2026
66
$209,999
1,027
$204
0.5
8946 6th Avenue
Sold Sep 4, 2026
—
$167,000
1,196
$140
0.5
2330 Broom Street
Sold Sep 25, 2026
—
$105,000
1,074
$98
0.6
9224 10th Avenue
Sold Jun 17, 2026
88
$169,000
1,170
$144
0.7
9068 11th Avenue
Sold Jun 30, 2026
11
$85,000
1,168
$73
0.8
8339 Concord Boulevard
Sold Jun 30, 2026
3
$399,000
1,246
$320
0.8
8004 Delaware Avenue
Sold May 12, 2026
13
$60,000
1,064
$56
0.9
1049 Stark Street
Sold May 27, 2026
225
$125,000
1,103
$113
0.9
1116 Stark Street
Sold May 1, 2026
24
$65,000
1,190
$55
0.9
1023 Brandywine Street
Sold Jul 31, 2026
14
$90,000
932
$97
1.0
1436 Forest Hills Road
Sold Jun 10, 2026
160
$182,000
1,322
$138
1.0
1901 Forest Hills Road
Sold Jun 9, 2026
311
$214,000
1,304
$164
1.0
7862 Stephenson Drive
Sold Aug 4, 2026
102
$225,000
1,650
$136
1.0
2143 Newberry Road
Sold Jun 5, 2026
25
$160,200
1,250
$128
1.1
7909 Wainwright Drive
Sold Jul 8, 2026
11
$114,000
1,066
$107
1.1
3330 Lansdell Drive
Sold Jul 15, 2026
143
$173,000
1,392
$124
1.2
1824 Rugby Road
Sold Aug 17, 2026
—
$248,000
1,697
$146
1.2
862 Bunker Hill Boulevard
Sold Sep 14, 2026
—
$142,700
1,012
$141
1.2
1648 Stafford Road
Sold Sep 30, 2026
—
$207,000
1,674
$124
1.2
10114 Haverford Road
Sold Sep 28, 2026
—
$205,000
1,218
$168
1.2
7905 Paul Jones Drive
Sold Jun 5, 2026
20
$129,900
836
$155
1.3
2509 Wilmont Court
Sold Jun 22, 2026
10
$218,000
1,056
$206
1.3
10531 Rutgers Road
Sold Jun 30, 2026
116
$220,000
1,138
$193
1.3
10553 Citrus Lane
Sold Sep 17, 2026
—
$185,000
990
$187
1.3
10242 Haverford Road
Sold Jun 15, 2026
11
$229,000
1,248
$183
1.3
10264 Swarthmore Drive
Sold Jul 16, 2026
51
$205,000
912
$225
1.4
Active listings from Momentum's hourly MLS refresh (all brokerages); sold prices are MLS closed-sale records. Tap any dot: active homes open their listing, sold homes open their community guide. Context only — not an appraisal or valuation. Deemed reliable but not guaranteed.
How it's doing
Performance
16days on market (MLS) · listed about Oct 4
1Google Search views, 28 days
1clicks from Google, 28 days
2.0average Google position
First seen on movewithmomentum.com Aug 20, 2026 at $189,900
Aug 28, 2026: $189,900 → $189,995 (+0.1%)
Showings, saves and portal inquiries are not in this data.
Days on market per the MLS. Google figures are Search Console data for this listing's page on movewithmomentum.com (28 days to Oct 20, 2026); they count search appearances and clicks, not all visits. Price changes are our own observations.
Competition
New listings nearby this week
8 similar homes listed by any brokerage within 5 miles in the last 7 days at a comparable price — the buyers touring this home are seeing these too.
Source: Momentum's hourly MLS refresh, all brokerages. Listings held by brokerages other than Momentum Realty are marked with the listing broker. Deemed reliable but not guaranteed.
Just sold
Recent closed sales nearby
8 closed sales of a similar home within 5 miles in the last 90 days. Tap one to open its neighborhood guide.