Single-family median $410,000, up 6.1% year-over-year (NEFAR, May 2026), but new pending sales down 23.5% (realMLS, all property types), the spring price strength is real but seasonally and builder-incentive supported. Inside: the official figures by property type, what's driving the market, and Momentum's neighborhood-level rankings (216 communities) on a price-per-square-foot basis.
Two medians, both correct. This report cites two figures by design: the NEFAR single-family median of $410,000 (up 6.1% YoY, 31-day median DOM) is the official Realtor-association number for single-family homes; Momentum's footprint median of $356,485 ($199/sq ft, 49-day DOM) is our six-county, all-property-type median across neighborhoods with 10+ closings. The single-family-only figure runs higher and sells faster than the all-property-type figure that includes condos and townhomes.

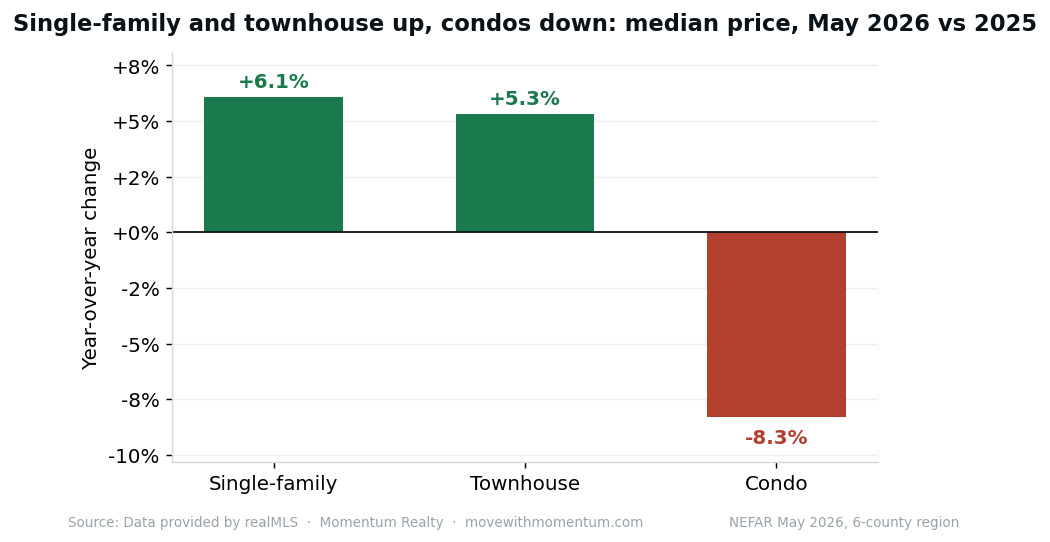
By the official NEFAR May 2026 numbers, Northeast Florida's single-family median sale price was $410,000, up 6.1% year-over-year and 5.1% from April; price per square foot was $213 (+3.4% YoY). The median home sold in 31 days at 97.9% of list, with 3.6 months of supply. On the surface, a firm spring market. Source: NEFAR, data provided by realMLS (six-county region).
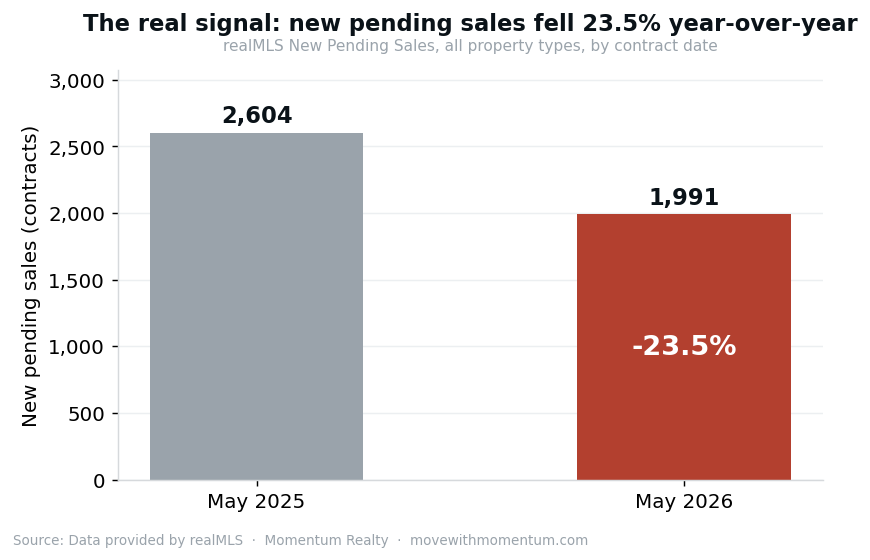
The signal under the surface is demand. New pending sales were down 23.5% year-over-year (1,991 contracts vs 2,604 a year earlier, realMLS, all property types, by contract date), with single-family new listings off 8.3% and active inventory down 15.1%. Two forces are propping up the spring price figures even as the pipeline thins: this is peak selling season (May typically prints the year's strongest prices), and builders are buying down mortgage rates to move new construction, which both pulls buyers toward new homes and pressures resale pending activity. The price strength is real but seasonally and incentive-supported; the pending decline is the more forward-looking number.
Underneath the regional average, the neighborhood picture over the full prior year is softer. Measuring price per square foot (which strips out the size and mix of what sold, the thing that makes raw median price unreliable street to street) and comparing full-year 2025 to 2024, 136 of 198 neighborhoods with a reliable read, about 69%, were down year-over-year, the median neighborhood by 3.0%. There is no contradiction with NEFAR's current-month gain: 2025 cooled relative to 2024, then the spring 2026 market firmed. Condos are the clear weak segment ($220,000 median, -10.3% per square foot YoY, 51 days on market). Full property-type and neighborhood detail below.
The official Northeast Florida Association of REALTORS® May 2026 Market Review, for the six-county region (Duval, St. Johns, Clay, Nassau, Putnam, Baker), by property type. Year-over-year compares May 2026 to May 2025. This is the authoritative regional snapshot. Source: NEFAR, data provided by realMLS.
| Metric | Single-family | Townhouse | Condo |
|---|---|---|---|
| Median sale price | $410,000 | $287,994 | $220,000 |
| vs May 2025 | +6.1% | +5.3% | -8.3% |
| Median $/sq ft | $213 | $191 | $175 |
| vs May 2025 | +3.4% | +3.0% | -10.3% |
| Closed sales | 1,969 | 223 | 188 |
| New pending sales, YoY (all types) | -23.5% (1,991 vs 2,604) | ||
| Median days on market | 31 | 38 | 51 |
| List price received | 97.9% | 98.5% | 95.9% |
| Active inventory | 7,109 | 973 | 1,042 |
| Months supply | 3.6 | 4.4 | 5.5 |
The split by product is the story: single-family and townhouse prices rose year-over-year (+6.1% and +5.3%), while condos fell 8.3% (-10.3% per square foot) and sit on the market longest (51 days) with the most supply (5.5 months), consistent with rising HOA assessment and insurance pressure on attached homes. New pending sales fell 23.5% year-over-year across the market (1,991 vs 2,604, realMLS, all property types), the clearest forward-looking signal in the data.
Two things to keep in mind when reading the year-over-year price gains. First, seasonality: May is the peak of the selling season and typically prints the strongest prices and fastest days-on-market of the year, so a healthy May reading partly reflects the calendar, not just underlying strength. The new-pending-sales decline (-23.5% year-over-year, all property types) is the cleaner read on direction, and it points down.
Second, builder rate buydowns. With mortgage rates elevated, builders across Northeast Florida are using rate buydowns and closing-cost incentives to keep payments affordable on new construction. That does two things to the data: it pulls a meaningful share of buyers into new homes (which is part of why new construction is such a large share of closings), and it competes directly against resale inventory, pressuring pending sales and days-on-market for existing homes. The effective price of a new home, after the buydown, is often lower than its headline price suggests, something a sticker-price comparison to resale will miss.
It looks contradictory, months of supply is a seller-favorable 3.6, yet prices are flat-to-easing. The resolution is that supply is tight because listings are scarce, not because demand is strong. New single-family listings are down 8.3% year-over-year and active inventory is down 15.1%; sellers are sitting out. At the same time, new pending sales are down 23.5%, demand is retreating even faster. Months of supply is a ratio (listings divided by sales pace), so when both sides of the market shrink, the ratio can stay low even as pricing power fades. Layer on the affordability ceiling (the typical local household no longer qualifies for the typical home at current rates) and builder buydowns siphoning demand to new construction, and you get the current picture: a thin, low-transaction market where scarce inventory is the main thing keeping prices from actually falling, rather than pushing them up. Tight supply here is a brake on price declines, not an engine of gains.
Median sale price, price per square foot, months of supply, median days on market, and sale-to-list ratio by county, with the year-over-year change in the most recent complete quarter's median (2026Q1 vs the same quarter a year earlier) where the sample supports it. These are Momentum's realMLS-derived figures over a trailing-twelve-month window and span the broader eight-county footprint (the NEFAR regional figures above cover its six core counties; Volusia and Flagler are the adjacent Daytona market). St. Johns remains the price leader; Putnam the value end.
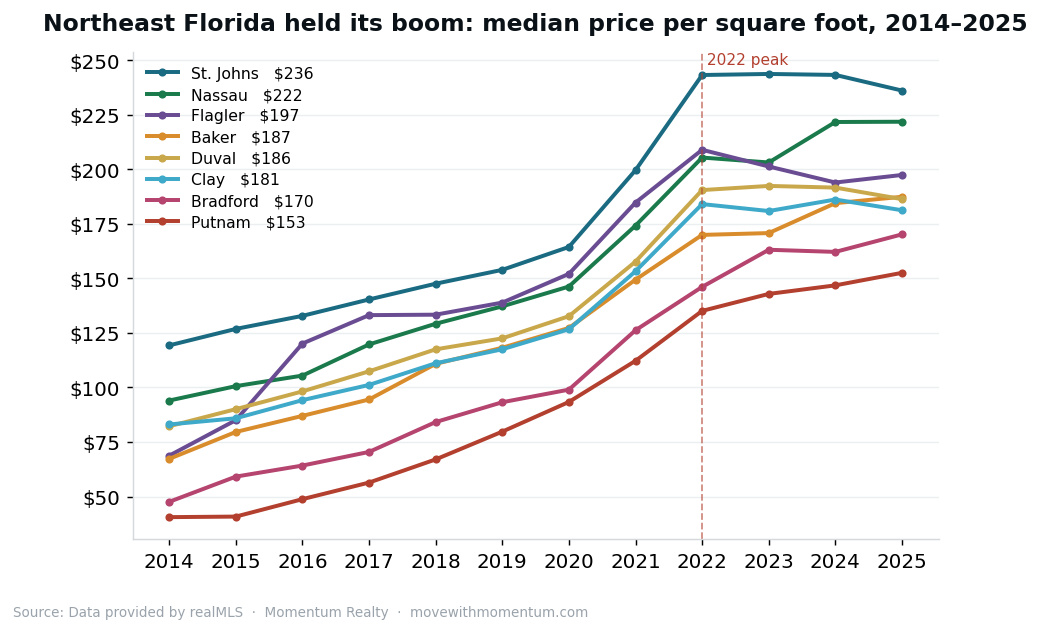
The most durable way to read this market is against the 2022 peak. On price per square foot, the Jacksonville core has essentially held its boom-era gains: Duval is about 2% below its 2022 peak, St. Johns about 3% below, Clay about 2% below, a plateau, not a correction. Nassau (+8%) and Putnam (+13%) are still above peak; only the Daytona market (Volusia −9%, Flagler −6%) has given back meaningful ground. These are large-sample figures (Duval alone closes 13,000+ homes a year), so unlike single-neighborhood numbers they are not distorted by sales mix.
| County | Median | $/sqft | Mo. supply | CDOM | Sale-to-list | YoY (qtr) | $/sqft vs 2022 |
|---|---|---|---|---|---|---|---|
| Duval | $310,000 | $186 | 3.7 | 44 | 95.8% | -0.9% | -2.2% |
| St. Johns | $495,000 | $236 | 3.5 | 56 | 95.5% | +1.3% | -2.9% |
| Clay | $340,000 | $180 | 3.9 | 49 | 96.1% | +0.2% | -1.5% |
| Nassau | $448,000 | $223 | 4.7 | 60 | 95.6% | -1.1% | +8.0% |
| Baker | $301,500 | $187 | 4.3 | 51 | 96.0% | -3.3% | +10.3% |
| Putnam | $219,945 | $155 | 6.2 | 58 | 92.3% | +7.9% | +12.9% |
| Flagler | $360,000 | $193 | 5.1 | 68 | 95.4% | -2.1% | -5.5% |
| Volusia | $362,000 | $196 | 6.4 | 50 | 94.3% | +11.1% | -9.2% |
The NEFAR table above tells the property-type story in numbers; the takeaway is that condominiums are the weakest segment by every measure, the only type with a falling median (-8.3% year-over-year), the longest days on market (51 days vs 31 for single-family), and the most months of supply (5.5 vs 3.6). The pressure is structural: rising HOA assessments, special assessments tied to Florida's post-Surfside structural-reserve requirements, and elevated insurance costs all land hardest on attached homes. Single-family remains the firmest segment, and townhouses sit in between.
Note: the neighborhood rankings that follow are Momentum's realMLS-derived analysis at the community level, which NEFAR's regional report does not publish. They compare full-year 2025 to 2024 (see the next section on why that window differs from NEFAR's May-over-May figure).
Not every listing sells. The table below shows two distinct reads on listing failure for May 2026, by property type. The Failed Resolution Share asks: of the listings that left the market this month, what share failed to sell (expired, withdrawn, or canceled) instead of closing? The Listing Failure Rate asks: relative to all active inventory, what share is failing to sell? They answer different questions and are not interchangeable, see the notes below the table. Source: Data provided by realMLS (Back Office for off-market and closed counts; active inventory from realMLS), aggregate counts only.
| Property type | Closed | Expired/withdrawn/canceled | Active | Failed Resolution Share1 | Listing Failure Rate2 |
|---|---|---|---|---|---|
| Single-family | 2,106 | 806 | 6,608 | 27.7% | 12.2% |
| Townhouse | 236 | 87 | 927 | 26.9% | 9.4% |
| Condominium | 191 | 116 | 1,025 | 37.8% | 11.3% |
| All residential | 2,642 | 1,057 | 8,931 | 28.6% | 11.8% |
1. Failed Resolution Share = (expired + withdrawn + canceled) ÷ (expired + withdrawn + canceled + closed), May 2026. Of the listings that left the market this month, the share that failed to sell rather than closing. A seller-outcome measure: about 29% of listings that left the market in May 2026 failed to sell, instead expiring, being canceled, or withdrawn. Monthly; all residential property types.
2. Listing Failure Rate = (expired + withdrawn + canceled) in May 2026 ÷ current active inventory (realMLS). The share of available inventory failing to sell, a market-stress and liquidity read. The numerator covers the month; the denominator is the live active-listing snapshot. Monthly fallout against current inventory; all residential property types.
The most reliable way to gauge real price movement at the neighborhood level is median price per square foot, not median sale price. Raw median price swings with the size and mix of whatever happened to sell in a given period: a year in which more large or more expensive homes change hands can push a neighborhood's median up 20% or more with no actual appreciation. Price per square foot normalizes for that. The two measures agree at the metro level (footprint price per square foot is also down about 3% year-over-year), but they can diverge sharply for a single neighborhood, which is why every appreciation figure in this report is computed on a per-square-foot basis, with the median-price change shown alongside for context.
On that basis, the picture over the full prior year is a soft, broad-based easing rather than a crash: roughly two-thirds of measurable neighborhoods eased year-over-year, the median neighborhood by 3.0%. But single-year neighborhood numbers are noisy (see the caveat in Methodology), so the gain/decline tables below rank by the change versus the 2022 peak, a wider and more stable window, limited to communities with 25+ closings in both endpoints.
Two timing notes. First, the neighborhood figures compare to 2022 and to 2024, both different windows than NEFAR's May-2026-vs-May-2025 headline, and that is not a contradiction: values cooled across 2025 versus the 2024 base, the metro is roughly flat versus its 2022 peak, and the current spring market firmed back up (NEFAR). Read the NEFAR section for where the market is right now; read these tables for how values have settled over the cycle. Second, even per-square-foot change at a single-neighborhood grain is directional, not precise, treat the lists as a guide to where to look, not as exact appreciation figures.
The Momentum Market Score (0 to 100) measures how tight and fast-moving a neighborhood is right now, blending three current-market signals: months of supply, inverted so tighter scores higher (45%), sold-to-active turnover (35%), and trailing-twelve-month sales liquidity (20%). It deliberately does not include price appreciation, single-year neighborhood price change is too noisy to belong in a ranking (we handle price separately, below). A high score means a fast, low-inventory seller's market; a low score means a slow, overstocked one. The price-per-square-foot change versus the 2022 peak is shown alongside for context. Source: Data provided by realMLS.
| # | Neighborhood | County | Score | Median | Mo. supply | Sold:Active | $/sqft vs 2022 |
|---|---|---|---|---|---|---|---|
| 1 | Arlington | Duval | 88.7 | $250,020 | 0.8 | 14.7 | -0.5% |
| 2 | Watersong at Rivertown | St. Johns | 86.2 | $468,500 | 0.9 | 13.3 | -9.4% |
| 3 | St. Augustine Lakes | St. Johns | 85.8 | $376,000 | 0.8 | 15.7 | n/a |
| 4 | St. Augustine Shores | St. Johns | 85.2 | $312,000 | 0.8 | 14.8 | -5.2% |
| 5 | Landings at Greenbriar | St. Johns | 81.9 | $671,882 | 0.8 | 14.3 | n/a |
| 6 | Fleming Island Plantation | Clay | 77.9 | $423,500 | 0.9 | 13.0 | -5.4% |
| 7 | Atlantis Point | Clay | 75.3 | $239,990 | 1.0 | 11.5 | n/a |
| 8 | Holstein Crossing | Clay | 75.3 | $337,490 | 1.2 | 10.4 | n/a |
| 9 | Seven Pines | Duval | 74.8 | $790,990 | 1.5 | 7.9 | n/a |
| 10 | Rivertown | St. Johns | 74.0 | $578,500 | 2.0 | 5.9 | -2.0% |
| # | Neighborhood | County | Score | Median | Mo. supply | Sold:Active | $/sqft vs 2022 |
|---|---|---|---|---|---|---|---|
| 1 | Beachwalk | St. Johns | 4.1 | $502,500 | 18.2 | 0.7 | -11.1% |
| 2 | Villages of Westport | Duval | 16.5 | $337,900 | 13.4 | 0.9 | -7.6% |
| 3 | West End at Town Center | St. Johns | 22.1 | $517,495 | 10.5 | 1.1 | +12.3% |
| 4 | Panther Creek | Duval | 24.1 | $350,000 | 10.4 | 1.2 | -3.2% |
| 5 | Lake Asbury | Clay | 25.1 | $549,000 | 9.5 | 1.3 | +5.8% |
| 6 | Davis Shores | St. Johns | 25.2 | $530,000 | 9.0 | 1.3 | -11.7% |
| 7 | Il Villagio | Duval | 28.8 | $220,000 | 7.8 | 1.5 | -12.1% |
| 8 | Madeira | St. Johns | 32.2 | $749,877 | 8.0 | 1.5 | +12.8% |
| 9 | Panama Park | Duval | 33.1 | $129,000 | 7.1 | 1.7 | -22.6% |
| 10 | Trout River | Duval | 33.3 | $226,700 | 6.9 | 1.7 | n/a |
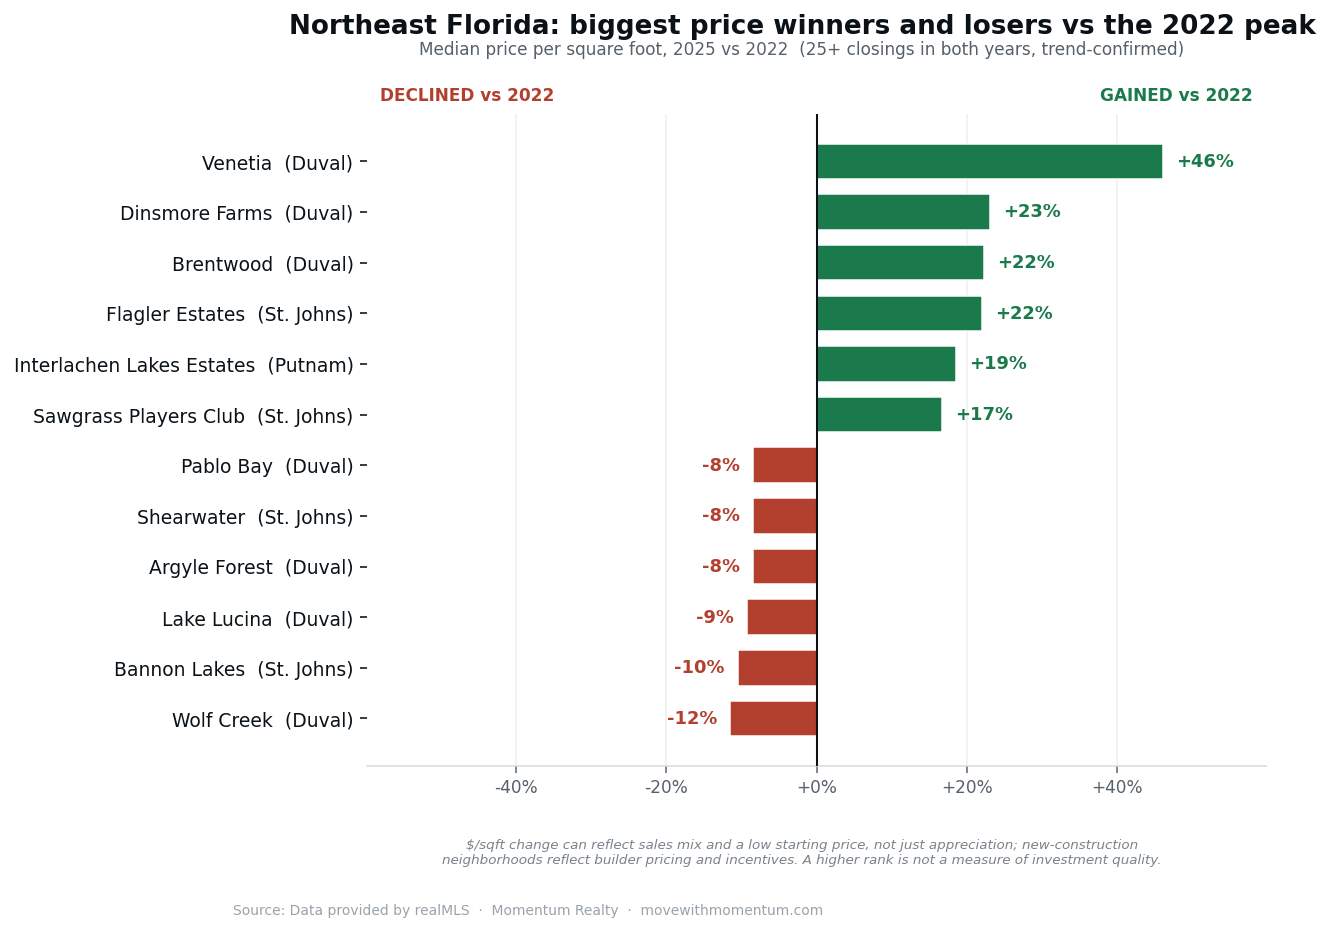
Change in median price per square foot from the 2022 cyclical peak to 2025, for neighborhoods with at least 25 closings in both years. We rank by the multi-year change vs 2022, not single-year, on purpose. Single-year neighborhood numbers are whipsawed by a noisy base year, Jacksonville Beach, for instance, reads −19% year-over-year but is only −3% versus 2022 because its 2024 spiked and merely reverted. The vs-2022 figure, measured over a wider spread, is the honest read on where values actually settled. The single-year change is shown beside it for transparency. Source: Data provided by realMLS.
| # | Neighborhood | County | vs 2022 peak | $/sqft 2022 → 2025 | YoY (25 vs 24) | Sales 2025 |
|---|---|---|---|---|---|---|
| 1 | Venetia | Duval | +46.1% | $178 → $260 | +18.2% | 32 |
| 2 | Dinsmore Farms | Duval | +23.1% | $147 → $181 | +9.0% | 34 |
| 3 | Brentwood | Duval | +22.3% | $103 → $126 | +9.6% | 28 |
| 4 | Flagler Estates | St. Johns | +22.1% | $154 → $188 | +6.2% | 70 |
| 5 | Interlachen Lakes Estates | Putnam | +18.6% | $102 → $121 | +12.0% | 86 |
| 6 | Sawgrass Players Club | St. Johns | +16.7% | $347 → $405 | -2.9% | 32 |
| 7 | Black Creek Park | Clay | +15.6% | $186 → $215 | +7.5% | 53 |
| 8 | St. Johns Golf & Cc | St. Johns | +15.6% | $225 → $260 | +7.0% | 26 |
| 9 | Highlands | Duval | +12.2% | $148 → $166 | -2.4% | 57 |
| 10 | Tamaya | Duval | +11.6% | $293 → $327 | +4.5% | 75 |
| # | Neighborhood | County | vs 2022 peak | $/sqft 2022 → 2025 | YoY (25 vs 24) | Sales 2025 |
|---|---|---|---|---|---|---|
| 1 | Wolf Creek | Duval | -11.5% | $218 → $193 | -5.4% | 36 |
| 2 | Bannon Lakes | St. Johns | -10.5% | $238 → $213 | -5.8% | 64 |
| 3 | Lake Lucina | Duval | -9.3% | $182 → $165 | -5.7% | 47 |
| 4 | Argyle Forest | Duval | -8.5% | $188 → $172 | -6.0% | 28 |
| 5 | Shearwater | St. Johns | -8.5% | $246 → $225 | -4.7% | 170 |
| 6 | Pablo Bay | Duval | -8.4% | $287 → $263 | -5.1% | 32 |
| 7 | Durbin Crossing | St. Johns | -7.2% | $223 → $207 | -2.8% | 90 |
| 8 | Trailmark | St. Johns | -7.1% | $224 → $208 | -2.8% | 156 |
| 9 | Argyle/chimney Lakes | Duval | -7.0% | $186 → $173 | -2.8% | 39 |
| 10 | St. Augustine Shores | St. Johns | -5.2% | $251 → $238 | -1.2% | 75 |
Months of supply = active listings divided by the trailing monthly sales pace. Under ~4 months favors sellers; above ~6 favors buyers. The loosest list is dominated by master-planned and new-construction communities still absorbing builder inventory. Source: Data provided by realMLS.
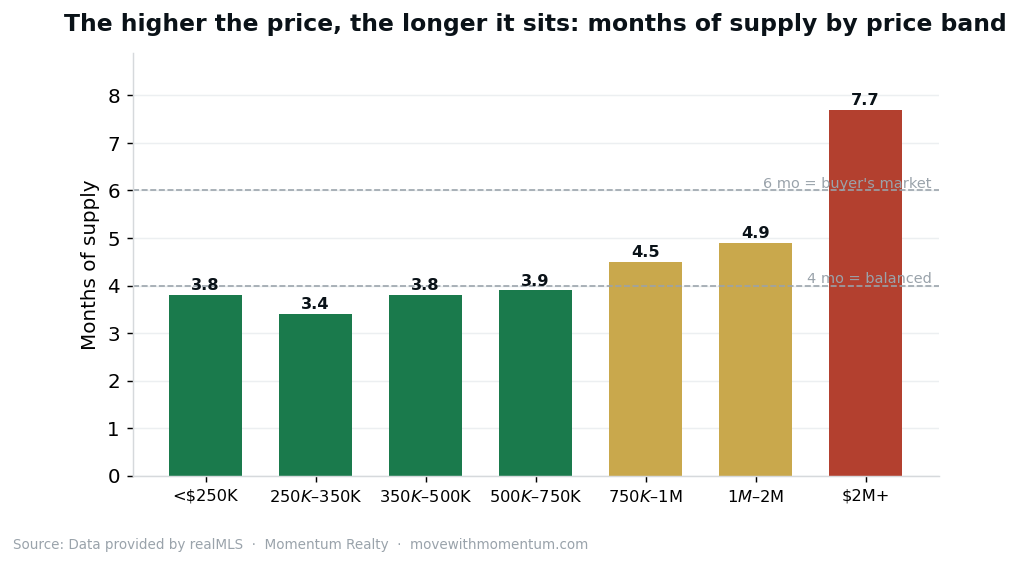
A forward read on demand by price point: the share of available-or-spoken-for inventory that is already under contract — under contract ÷ (under contract + active listings) — in each band. (This is a different cut from the pending-to-active ratio used elsewhere; here every band tops out at 100%.) Demand is firmest in the move-up middle ($250K - $350K at 34% under contract) and thinnest at the extremes (Under $250K at 26%), where entry buyers are most rate-squeezed and luxury moves slowest. Source: Data provided by realMLS.
| Price band | Active listings | % under contract | Months supply |
|---|---|---|---|
| Under $250K | 1,890 | 26% | 3.8 |
| $250K - $350K | 2,042 | 34% | 3.4 |
| $350K - $500K | 2,256 | 30% | 3.8 |
| $500K - $750K | 1,393 | 34% | 3.9 |
| $750K - $1M | 538 | 33% | 4.5 |
| $1M - $2M | 462 | 33% | 4.7 |
| $2M+ | 219 | 28% | 7.7 |
| # | Neighborhood | County | Mo. supply | Median | Sold:Active |
|---|---|---|---|---|---|
| 1 | Landings at Greenbriar | St. Johns | 0.8 | $671,882 | 14.3 |
| 2 | Arlington | Duval | 0.8 | $250,020 | 14.7 |
| 3 | St. Augustine Lakes | St. Johns | 0.8 | $376,000 | 15.7 |
| 4 | St. Augustine Shores | St. Johns | 0.8 | $312,000 | 14.8 |
| 5 | Fleming Island Plantation | Clay | 0.9 | $423,500 | 13.0 |
| 6 | Watersong at Rivertown | St. Johns | 0.9 | $468,500 | 13.3 |
| 7 | Lake Lucina | Duval | 1.0 | $249,000 | 11.7 |
| 8 | Atlantis Point | Clay | 1.0 | $239,990 | 11.5 |
| 9 | Pablo Bay | Duval | 1.1 | $694,000 | 11.0 |
| 10 | Brierwood | Duval | 1.2 | $345,000 | 9.8 |
| # | Neighborhood | County | Mo. supply | Median | Sold:Active |
|---|---|---|---|---|---|
| 1 | Beachwalk | St. Johns | 18.2 | $502,500 | 0.7 |
| 2 | Villages of Westport | Duval | 13.4 | $337,900 | 0.9 |
| 3 | West End at Town Center | St. Johns | 10.5 | $517,495 | 1.1 |
| 4 | Panther Creek | Duval | 10.4 | $350,000 | 1.2 |
| 5 | Lake Asbury | Clay | 9.5 | $549,000 | 1.3 |
| 6 | Davis Shores | St. Johns | 9.0 | $530,000 | 1.3 |
| 7 | Rolling Hills | Clay | 8.6 | $328,500 | 1.4 |
| 8 | Springfield | Duval | 8.5 | $316,829 | 1.4 |
| 9 | Madeira | St. Johns | 8.0 | $749,877 | 1.5 |
| 10 | Cross Creek | Clay | 7.9 | $320,000 | 1.5 |
Neighborhood median sale price extremes across the footprint (2025 full-year median, minimum 8 closings). The gap illustrates how many distinct markets sit inside one metro. Source: Data provided by realMLS.
| # | Neighborhood | County | 2025 median | $/sqft |
|---|---|---|---|---|
| 1 | Panama Park | Duval | $129,000 | $113 |
| 2 | Interlachen Lakes Estates | Putnam | $137,800 | $121 |
| 3 | Sherwood Forest | Duval | $148,000 | $112 |
| 4 | Lake Forest | Duval | $150,000 | $125 |
| 5 | Brentwood | Duval | $152,250 | $126 |
| 6 | St. Johns Riverside Ests M | Putnam | $162,450 | $130 |
| 7 | Villas of Timberlin | Duval | $175,000 | $184 |
| 8 | Williams Walk | Duval | $177,000 | $184 |
| 9 | Sabal Terrace Townhomes | Duval | $179,990 | $148 |
| 10 | Hillcrest | Duval | $200,000 | $143 |
| # | Neighborhood | County | 2025 median | $/sqft |
|---|---|---|---|---|
| 1 | Ponte Vedra Beach | St. Johns | $3,697,500 | $903 |
| 2 | The Plantation at PV | St. Johns | $1,850,000 | $507 |
| 3 | Marsh Landing | St. Johns | $1,675,000 | $409 |
| 4 | Atlantic Shores | Duval | $1,500,000 | $736 |
| 5 | Sawgrass Country Club | St. Johns | $1,247,500 | $480 |
| 6 | Queens Harbour Cc | Duval | $1,024,000 | $311 |
| 7 | Twenty Mile at Nocatee | St. Johns | $1,010,000 | $332 |
| 8 | Sawgrass Players Club | St. Johns | $997,500 | $405 |
| 9 | Coastal Oaks at Nocatee | St. Johns | $975,000 | $312 |
| 10 | Neptune Beach | Duval | $955,000 | $550 |
The national market is quietly recovering while Northeast Florida cools, the divergence is the story. Nationally, the median existing-home price reached $429,300 in May 2026, up 1.3% year-over-year, the 35th straight month of annual gains, and U.S. existing-home sales rose 3.2% from the prior month to a five-month high (National Association of REALTORS). In the same month, Northeast Florida's new pending sales fell 23.5% year-over-year. The nation is thawing; this market is not, yet.
Rates are not the obstacle they were. The Freddie Mac 30-year fixed averaged 6.52% the week of June 11, 2026, down from 6.84% a year earlier. Lower rates have helped the national market but have not revived local demand, which points back to the affordability ceiling and to local economic headwinds (next section). The takeaway is the divergence itself: the same month that produced national price gains and rising sales produced a sharp local pullback in pending deals.
We cross-check against independent sources, and they line up. Zillow's Home Value Index, a mix-adjusted index that tracks the same homes over time (the cleanest publicly available measure), puts the Jacksonville metro value at $356,001, essentially identical to our footprint median of $356,485, and the city of Jacksonville near $295,910, in line with our Duval County figure ($310,000). The level checks out.
On direction, Zillow's index is down 2.4% year-over-year for the metro. That is not a contradiction of NEFAR's +6.1% single-family headline, the two measure different things, and reading them together is the point: NEFAR's figure is the raw single-family median for one month (May), which runs hot in peak season and moves with the mix of what sold; Zillow's index strips that mix out across all home types. Our own neighborhood work, measured per square foot, sits with Zillow: most neighborhoods are easing, and the metro is roughly flat versus the 2022 peak. In plain terms, three independent methods agree that Northeast Florida prices are flat-to-slightly-down on a quality-adjusted basis, with the official spring single-family median running higher for seasonal and mix reasons. Source: Zillow Home Values; NEFAR; realMLS.
Housing demand here is being pulled down in part by a softening job market. The Jacksonville metro unemployment rate was 4.8% in April 2026 (up from 4.7% the prior month and off a January peak of 5.2%, the highest since 2020). Employers shed a net 3,400 jobs over the year (-0.4%), with declines every month of 2026, the region's first sustained job losses since 2010 outside the pandemic. The losses are concentrated in financial activities and federal government. When local paychecks stall, payment-constrained demand stalls with them, exactly what the pending-sales numbers show. Source: Florida Department of Commerce, via the Jacksonville Daily Record.
The cost that drove buyers away is starting to turn. Citizens Property Insurance, the state-backed insurer, will cut homeowners rates statewide in 2026 (-8.8% multiperil, -5.5% wind-only), its first statewide decrease, and its policy count has fallen about 76% from its 2023 peak to roughly 336,000 as private insurers re-enter, a sign of a healthier market after the 2022-2023 legal reforms. Florida premiums remain among the highest in the nation, but the trajectory has flattened, increases have largely stalled this year rather than compounding as they did from 2022 to 2024. Insurance is no longer accelerating, removing one of the past few years' biggest demand drags even as overall affordability remains a hurdle. Sources: Florida Office of the Governor and Citizens Property Insurance.
The base case is continued softness without a sharp drop. New pending sales down about 24% point to weaker closings and gentle price easing through the back half of the year; new construction and builder buydowns keep a floor under inventory and divert demand from resale; and the affordability ceiling caps any price acceleration until rates fall further or local incomes recover. The plateau versus the 2022 peak should hold, the Jacksonville core has shown no sign of giving back its boom gains, but the mix will keep favoring buyers as price rises, with the top end ($1M+, condos) the most negotiable. What would change the call: a meaningful drop in mortgage rates (toward the high 5s) reviving pending sales, or a deeper local employment slide that turns the gentle easing into something faster. We will track both monthly.
This is analysis, not a forecast or investment advice. It reflects current data and reasonable assumptions, both of which can change.
The headline "Market at a glance" figures are the official NEFAR May 2026 Market Review for the six-county region (Duval, St. Johns, Clay, Nassau, Putnam, Baker), a point-in-time month with year-over-year measured as May 2026 versus May 2025. Source: NEFAR, data provided by realMLS. The county and neighborhood analysis that follows is Momentum's own work on the realMLS (and DBAAR for Daytona/Flagler) record sets, computed from the full active, pending, and trailing-twelve-month closed data as of 2026-06-14T02:16Z; it spans a broader eight-county footprint and a trailing or full-year window, so its figures will not match the NEFAR point-in-time numbers one-for-one, by design. No listing-level data is published; only aggregates. Information deemed reliable but not guaranteed.
Why price per square foot, and why we rank by the multi-year change. Median sale price at neighborhood scale is distorted by the size and mix of homes that happen to sell, a year of larger or more expensive closings can lift a median 20 to 50% with no real appreciation, so we normalize by square footage. But even per-square-foot change is unreliable over a single year at the neighborhood level, because the base year is itself a small, lumpy sample. So the neighborhood gain/decline tables rank by the change versus the 2022 cyclical peak, a wider, more stable window, with the single-year change shown only for context.
The limits of this data (please read before quoting a single neighborhood). Price per square foot is the best widely-available measure, but it is not a clean same-home appreciation number, and cleaning it is genuinely hard. At the neighborhood level it is still moved by: home condition and renovation (a year with more flips prints a higher $/sqft with no real gain); new construction versus resale (new homes carry a $/sqft premium); lot and location premiums (waterfront, golf, oceanfront price into total cost, not square footage); reported-square-footage errors in the MLS; and small samples and outliers, which we trim with judgment-based rules. The only truly clean measure is a repeat-sales index (the Case-Shiller method), which pairs the same property across two sales to hold quality constant; we do not publish that at neighborhood grain. The practical rule: aggregate figures (county and metro, thousands of sales) are reliable; single-neighborhood figures are directional, not precise.
Neighborhood leaderboards cover 216 communities that cleared the sample floors: at least 20 closings in the trailing twelve months for supply and turnover metrics, and at least 8 closings in the reference year for a published median. Per-square-foot appreciation is shown only where a neighborhood had at least 25 closings in each of 2024 and 2025 (breadth counts use a 10-closing floor). The Momentum Market Score (hottest/coolest) measures current-market tempo only, months of supply (inverted) 45%, sold-to-active turnover 35%, and sales liquidity 20% (log-scaled). It excludes price appreciation by design, because single-year neighborhood price change is dominated by sales-mix noise. Named price gainers/decliners are a separate ranking, by the change versus the 2022 peak, and are limited to trend-confirmed moves: at least 25 closings in both 2022 and 2025, and a genuine multi-year trend (at least two of the three annual steps moving the same direction, with no single year accounting for more than 70% of the total move). This filter removes one-year composition spikes, e.g. a year in which more new, larger, or renovated homes happened to sell, which can swing a neighborhood's price per square foot 15 to 35% with no real change in value. Thin samples are suppressed, never estimated.
County year-over-year figures compare the most recent complete quarter's median (2026Q1) to the same quarter a year earlier and are shown only where both quarters had at least 20 closings; the in-progress quarter is excluded to avoid comparing a partial period against a full one. Annual neighborhood medians follow the realMLS history series (2012-present), which suppresses medians for groups under five. This report is generated by a build script that reads a structured data file and renders only fields present in the data; it does not interpolate or carry forward prior-period values.
Press inquiries, data verification, custom cuts (by county, price band, or specific neighborhood), or interview requests: contact Jon Brooks at jon@movewithmomentum.com. Mention 'press' in the subject line for priority routing. Response within 48 hours on business days. Jon is available to walk a reporter through the underlying data or provide on-the-record commentary on any neighborhood in the rankings.
Cite as: Brooks, Jon. "May 2026 NE Florida Housing Pulse." Momentum Realty, June 13, 2026. Available at https://movewithmomentum.com/reports/2026-05-ne-florida-housing-pulse
Momentum Realty publishes the NE Florida Housing Pulse monthly from realMLS data. For neighborhood-level detail, a specific county or price band, or commentary on deadline, email Jon directly.
Email Jon →