
Move With Momentum Housing Research
Florida Housing Market Tracker
SEPTEMBER 2026 RELEASE · UPDATED MONTHLYThis release: September 26, 2026 (Zillow August data) · Next release: on the September Zillow drop, expected mid-October 2026 · Download the full media kit (ZIP)
August 2026: Florida prices tick up for the first time since March
Florida’s statewide typical home value rose 0.10% in August, to $390,638 (up $387 from a revised July), the first monthly gain since March and the end of a four-month slide. It is still down 1.1% year over year. 35 of 67 counties rose in the month.
Breadth improved again: 527 of 801 populated ZIP codes (66%) are below their year-ago value, down from 75% in the July release; the median ZIP is off 0.9%, from 1.6%. Supply kept shrinking: 175,121 active listings, down 2.4% from July and 12.2% from a year ago, so the floor is still being held up by sellers pulling listings rather than by buyers returning. Price cuts eased for a fifth straight month, to 24.2% of listings (March peak: 25.4%).
Leaders: Taylor (+6.1% over 12 months), Lafayette (+5.8%) and Hamilton (+5.7%), all inland North Florida. Steepest declines: Charlotte (−4.9%) and Lee (−4.4%) on the Gulf Coast.
Population-weighted Zillow ZHVI, all 67 counties; inventory and price cuts from Zillow Research (price cuts inventory-weighted). Zillow revised its history this month: July now reads $390,251 statewide (published as $393,034 on August 24), and the comparisons above use the revised series. Momentum Realty analysis; deemed reliable but not guaranteed.
Florida Housing Command Center
The state of the market in six answers · Zillow data through August 2026 · next update expected mid-October 2026
Are prices rising or falling?
Ticking up · $390,638
August rose 0.10%, the first monthly gain since March, after a four-month slide. Down 1.1% year over year.
Is inventory tightening or expanding?
Shrinking · −12.2% YoY
175,121 active listings vs. 199,353 a year ago — driven by sellers withdrawing, not buyers absorbing.
Are sellers cutting prices?
Holding near 1 in 4 · 24.2%
Cuts have eased five straight months from the 25.4% March peak but remain well above December's low.
Where are values still rising?
Inland North Florida
Highest 1-yr growth: Taylor County +6.1%, then Lafayette +5.8% and Hamilton +5.7%.
Where are declines deepest?
The Gulf Coast
Steepest 1-yr decline: Charlotte County −4.9%. Lee: −4.4%.
What changed this month?
Prices turned up
August broke a four-month slide with a 0.10% gain while listings kept shrinking and cuts eased again. Details ↓

"Three straight monthly declines settles the flatline debate — this correction is still working. The mechanics haven't changed: sellers are withdrawing rather than cutting, and buyers aren't chasing. For buyers, negotiability is the best it's been in years; for sellers, the data says price to today's comps, not last year's. Every number on this page is sourced, dated, and updated monthly."
Jon leads Move With Momentum Housing Research, the data desk of Momentum Realty — the RealTrends-500 brokerage he co-founded (ranked #440 in the U.S. by transaction sides, 2025). Before founding Momentum he worked in real estate investment banking; he holds a B.S. in Finance from Virginia Tech His market commentary and research have been quoted by outlets including Realtor.com, Real Estate News, and News4Jax, and he speaks regularly on Florida housing to industry and media audiences. Areas of expertise: Florida housing markets, housing-market data and indexes, MLS data and market statistics, residential brokerage economics, and new-construction market dynamics. Publications: this monthly tracker, the daily Florida Live Tracker, 67 county scorecards, and the Move With Momentum research archive.
jon@movewithmomentum.com · media inquiries welcome · media kit
Published September 26, 2026. Zillow Research data through August 2026; Realtor.com Research data for August 2026; all 67 counties and roughly 900 ZIP codes. This page is updated monthly with new data and media-ready charts. Every figure is attributed and dated; charts may be republished with credit (see below).
Executive summary
The slide paused, and prices turned up. Florida's statewide typical home value rose 0.10% in August, to $390,638, about $387 above a revised July. It is the first monthly gain since March and ends a four-month run of small declines. The statewide series has now spent ten straight months inside ±0.2% a month, since November 2025: a long, shallow plateau, not a new leg in either direction.
Values are still down 1.1% year over year. The floor is still being held up by sellers leaving rather than buyers returning: active inventory fell another 2.4% in August to 175,121, down 12.2% year over year, and the hardest-hit Gulf Coast counties pulled the most listings (Charlotte County: listings −26.5%, values −4.9%; Lee County: listings −19.8%, values −4.4%).
Price cuts eased for a fifth straight month, to 24.2% of listings. That is still near one in four and well above December's 21.7% low. Zillow revised its history this month; the comparisons on this page use the revised series (July now reads $390,251 statewide, published as $393,034 on August 24).
Key takeaways
- Florida's statewide typical home value rose 0.10% in August 2026 to $390,638, the first monthly gain since March, after four small monthly declines. Down 1.1% year over year.
- 66% of Florida ZIP codes (527 of 801 with population over 5,000) are below their year-ago value, down from 75% last release; the median ZIP is off 0.9%, from 1.6%.
- Inventory fell 12.2% because sellers withdrew listings; the counties with the deepest price declines pulled the most supply.
- Price cuts remain near 1 in 4 listings (24.2%), above their 21.7% December 2025 low, though they have eased for five straight months off the March peak of 25.4%.
- Inland North Florida still leads (Taylor +6.1%, Lafayette +5.8%, Hamilton +5.7% over 12 months); 5 counties sit at record highs while the Gulf Coast corrects hardest (Charlotte −4.9%, Lee −4.4%).
- Home values have outgrown household incomes since 2019 in all 67 counties: statewide, values +54.7% vs. incomes +28.7%.
AI summary
Florida's statewide typical home value was $390,638 in August 2026, up 0.10% from July and 1.1% below August 2025 (Zillow ZHVI, population-weighted across 67 counties). Values rose 48% from the 2020 annual average ($265,450) to a 2024 annual-average peak ($418,317), declined through 2025, held roughly flat December 2025 through March 2026, declined slightly April through July 2026, and rose in August 2026, the first monthly gain since March.
Active inventory was 175,121 in August 2026, down 12.2% from 199,353 a year earlier. The largest inventory declines occurred in counties with the largest price declines (Charlotte County: inventory −26.5%, values −4.9%; Lee County: inventory −19.8%, values −4.4%), indicating seller withdrawal rather than demand absorption. The share of listings with a price reduction rose from 21.7% in December 2025 to a March 2026 peak of 25.4%, easing to 24.2% by August 2026, still roughly one listing in four.
527 of 801 Florida ZIP codes with population over 5,000 (66%) were below their year-ago value. 41 of 67 counties declined year over year; 5 counties reached record-high values. Since 2019, home value growth (+54.7% statewide) exceeded median household income growth (+28.7%) in all 67 counties. Source: Momentum Realty analysis of Zillow Research, Realtor.com Research, and U.S. Census Bureau ACS data, movewithmomentum.com/data/florida-housing-tracker.
Look up your county
All 67 counties, straight from the same dataset behind these charts.
Open this county's full scorecard → · Open in the County Terminal →
Explore all 67 counties
The full county dataset behind this release — search, click any column to sort, or .
| County | Value | 1-yr | Vs 2019 | Vs peak | Inv YoY | Cuts % | DOM | Wage gap | Buyer Power™ |
|---|
Value = Zillow ZHVI typical home value (August 2026). Wage gap = value growth minus income growth since 2019, percentage points (Momentum calculation from Zillow + Census ACS). Deemed reliable but not guaranteed.
Compare two counties
Head-to-head from this release's dataset. Every figure links back to the sources in the references.
Compare two ZIP codes
ZIP figures are Zillow ZHVI typical values for ZIP codes with population over 5,000. Market statistics only — not a valuation of any specific property.
Chart 1 — The first uptick since March
In one sentence: Florida home values rose 0.10% in August 2026, the first monthly gain since March. The decline has paused rather than reversed, and it remains a correction measured in single digits, not a crash.
Key facts
- Statewide typical value: $390,638 in August 2026, up 0.10% from July and down 1.1% year over year (Zillow ZHVI, population-weighted).
- Values rose 48% from the 2020 annual average ($265,450) to the 2024 annual-average peak ($418,317).
- Values were essentially flat December 2025 – March 2026, slipped April through July, then rose in August (+0.10%).
- The median county sits 5.7% below its all-time peak.
Findings — what the data shows
Florida's statewide typical home value rose 0.10% in August 2026, to $390,638, about $387 above a revised July. It is the first monthly gain since March and ends a four-month run of declines of 0.15% or less; on Zillow's revised series, July was the low of the correction at $390,251. Read together with the winter, the statewide series has now spent ten consecutive months inside ±0.2% a month: a long shallow plateau, not a new trend in either direction. The year-over-year decline narrowed to 1.1%, largely because last summer's steeper drops keep rolling out of the twelve-month comparison.
Interpretation — why we think it happened
Three forces are doing the work. First, an affordability ceiling: since 2019, statewide values are up 54.7% while median household incomes are up 28.7% — a gap that mortgage rates near 6.65% convert into monthly payments many Florida households simply cannot carry (see Chart 10). Second, carrying costs: property insurance premiums and, in the condo segment, post-Surfside assessment and reserve requirements have raised the cost of ownership independent of price. Third, the supply dynamic in Chart 2 — the winter price floor was manufactured by sellers withdrawing listings rather than by buyers returning. When spring re-listers tested higher asking prices, the market refused them: price cuts rose (Chart 3) and values resumed falling.
Historical context
This is not 2008. In the 2006–2011 bust, Florida values round-tripped their entire boom amid forced selling — foreclosures created supply that had to transact at any price. Today's decline is a partial giveback of a historic boom by discretionary sellers who can wait: every one of the 67 counties remains 35–93% above its 2019 value, and 30 of 67 are within 5% of their peaks. The honest framing is a grinding repricing toward what local incomes can support — with the pace set by how long sellers hold out.
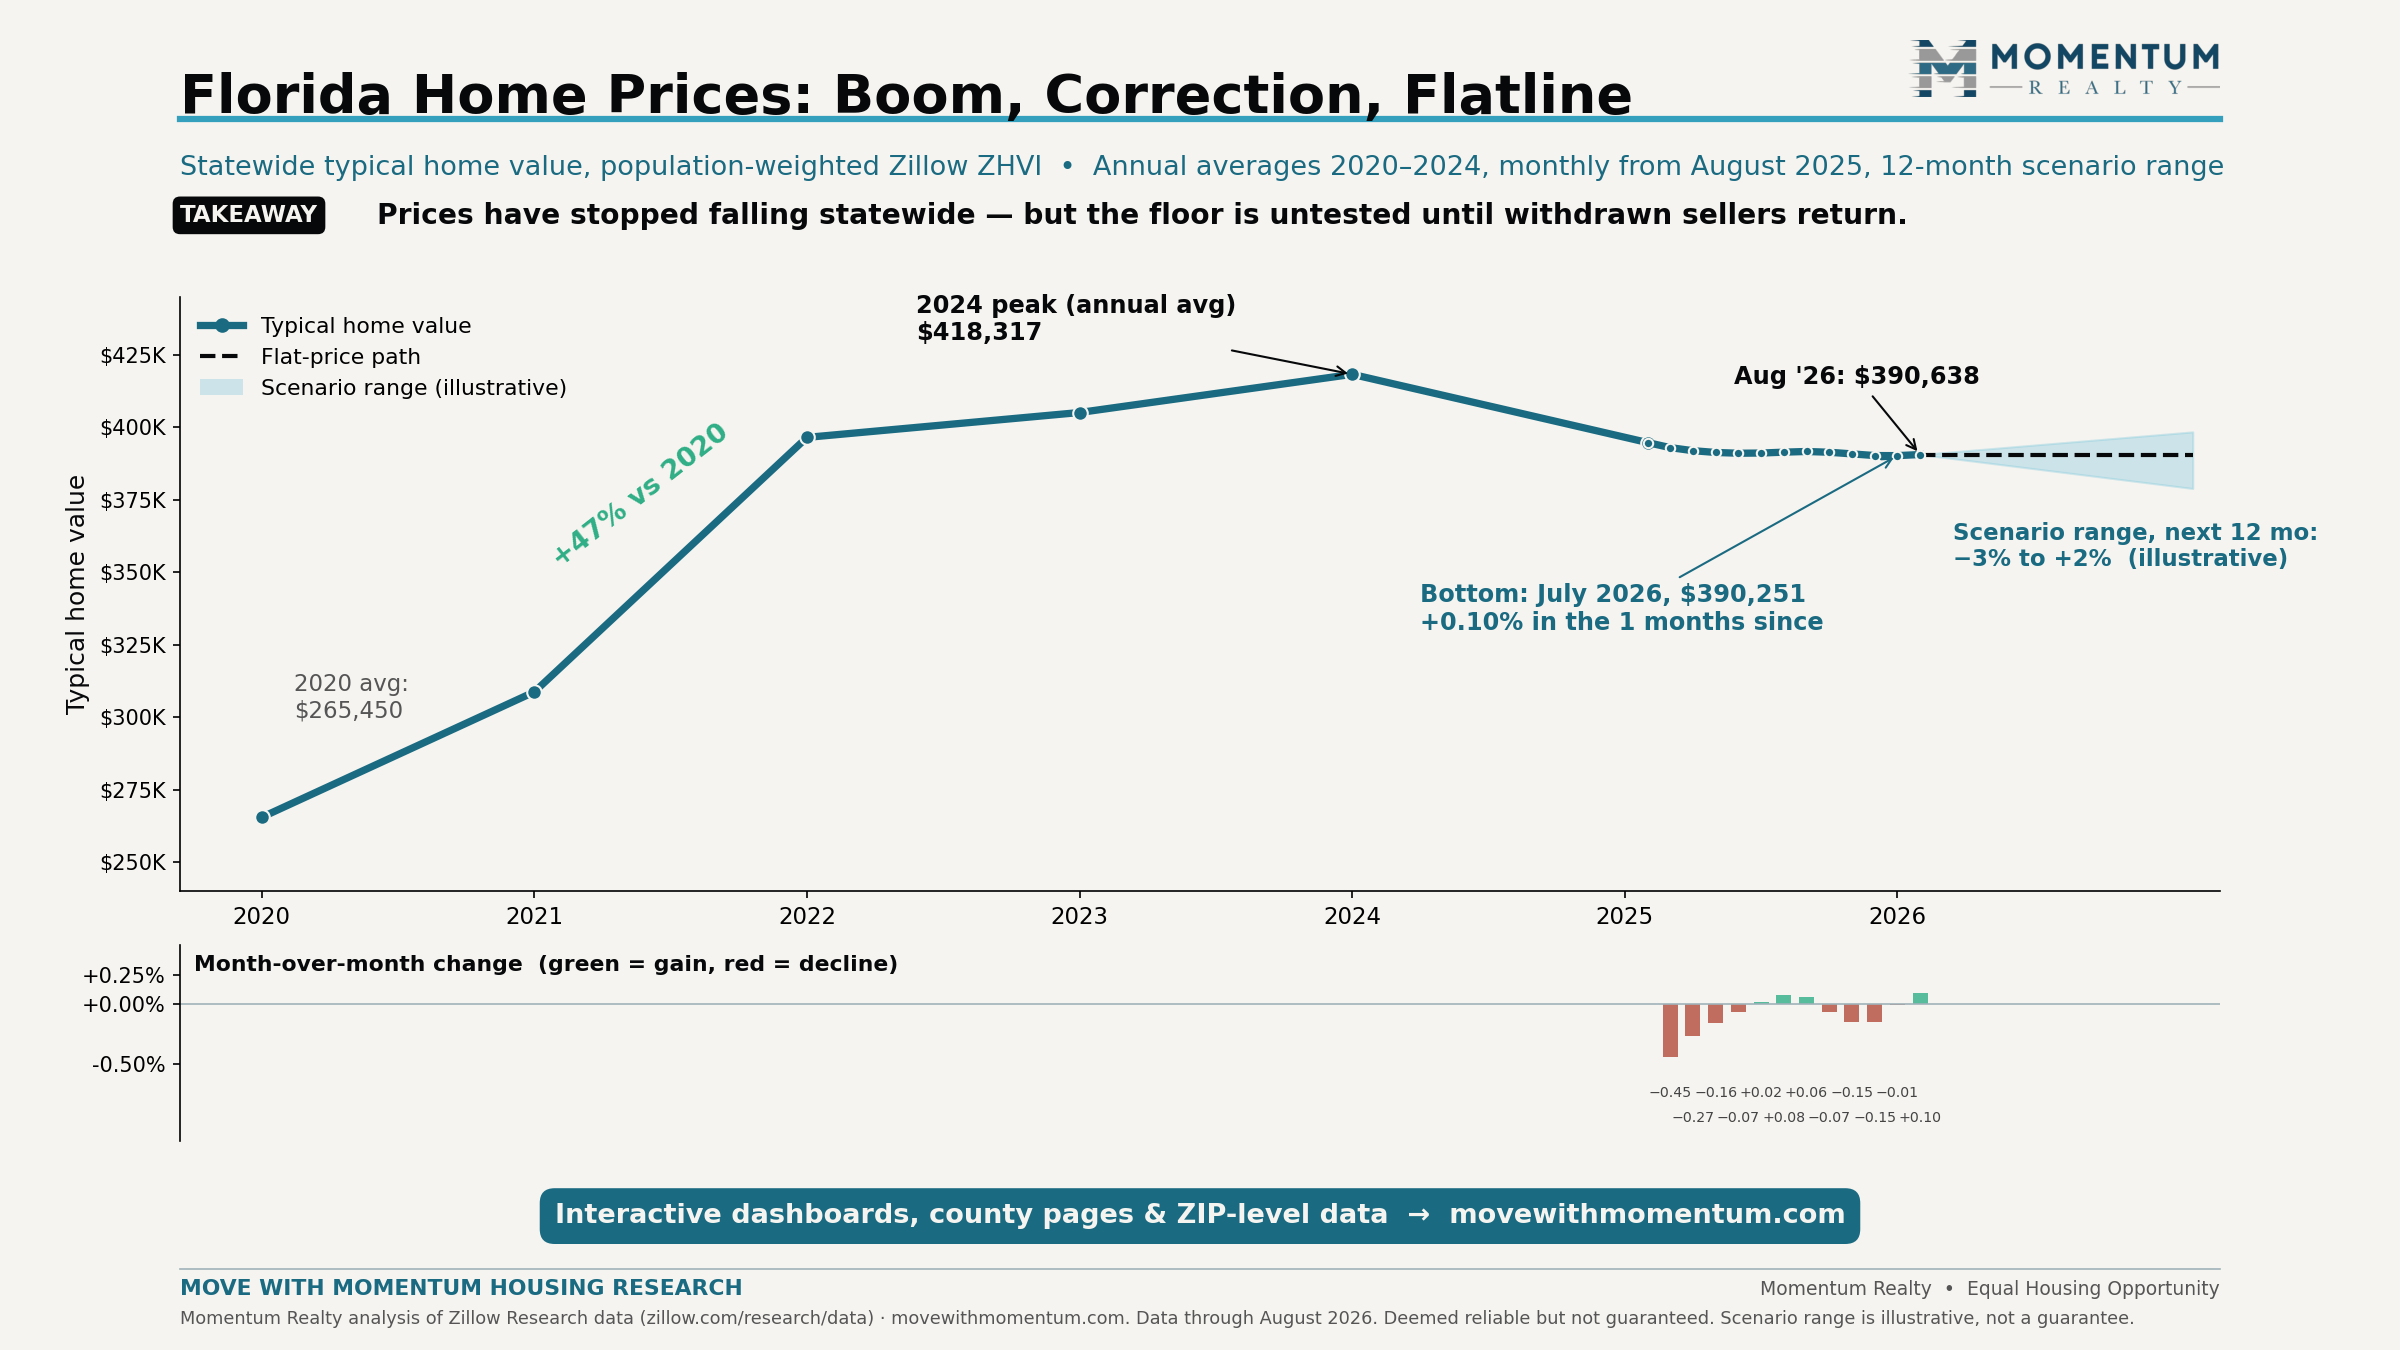
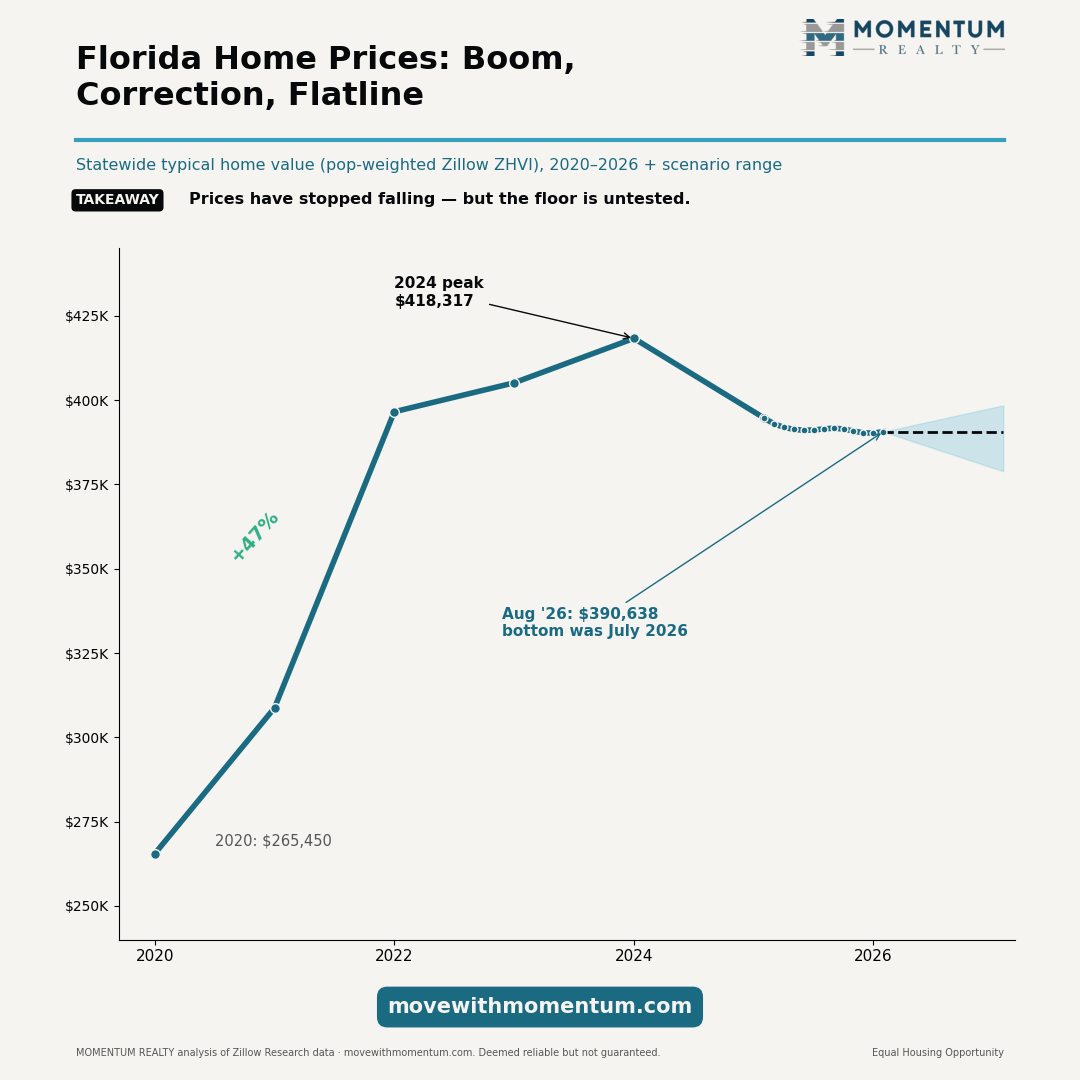
Chart 2 — The price floor is a seller strike
In one sentence: Florida's price floor was built by sellers leaving the market, not buyers entering it; it sagged in the spring and held through the summer as listings kept disappearing.
Key facts
- Statewide active inventory: 175,121 in August 2026, down 12.2% from 199,353 a year earlier.
- The counties with the deepest price declines pulled the most listings: Charlotte County inventory −26.5%, values −4.9%; Lee County inventory −19.8%, values −4.4%.
- Falling inventory alongside falling prices is the statistical signature of seller withdrawal, not demand.
Findings — what the data shows
Across Florida's 33 largest counties, the relationship between inventory change and price change runs the "wrong" way: the markets where prices fell hardest are also the markets where the most listings disappeared. In a demand-driven recovery, shrinking inventory accompanies rising prices as buyers absorb supply. Florida shows the opposite pattern — supply left because sellers gave up on their price, not because buyers met it.
Interpretation — why we think it happened
Two mechanics drive the seller strike. The first is the mortgage lock-in effect: a large share of Florida owners hold sub-4% mortgages from 2020–2021, so selling into a soft market and refinancing a purchase at ~6.5% is doubly punishing — withdrawal is rational. The second is anchoring: discretionary sellers who bought or refinanced at 2022 valuations resist realizing a loss, so when the market rejects their price, they delist rather than cut. Our MLS-based Live Tracker now measures this directly: delistings in Northeast Florida ran roughly 2.4× their two-year norm in July 2026 (the latest monthly read in that series at this release).
Historical context
Withdrawal-built floors have a defined life cycle. Because the underlying demand deficit is unresolved, each listing season re-tests the market: withdrawn sellers return, inventory rebuilds, and if buyers still don't appear at the old prices, cuts and declines resume — precisely the April–July 2026 sequence. The contrast with 2008 is again instructive: then, foreclosure supply forced price discovery; today, discretionary supply delays it. That is why this correction is slower, shallower, and longer than the crash most headlines reach for.
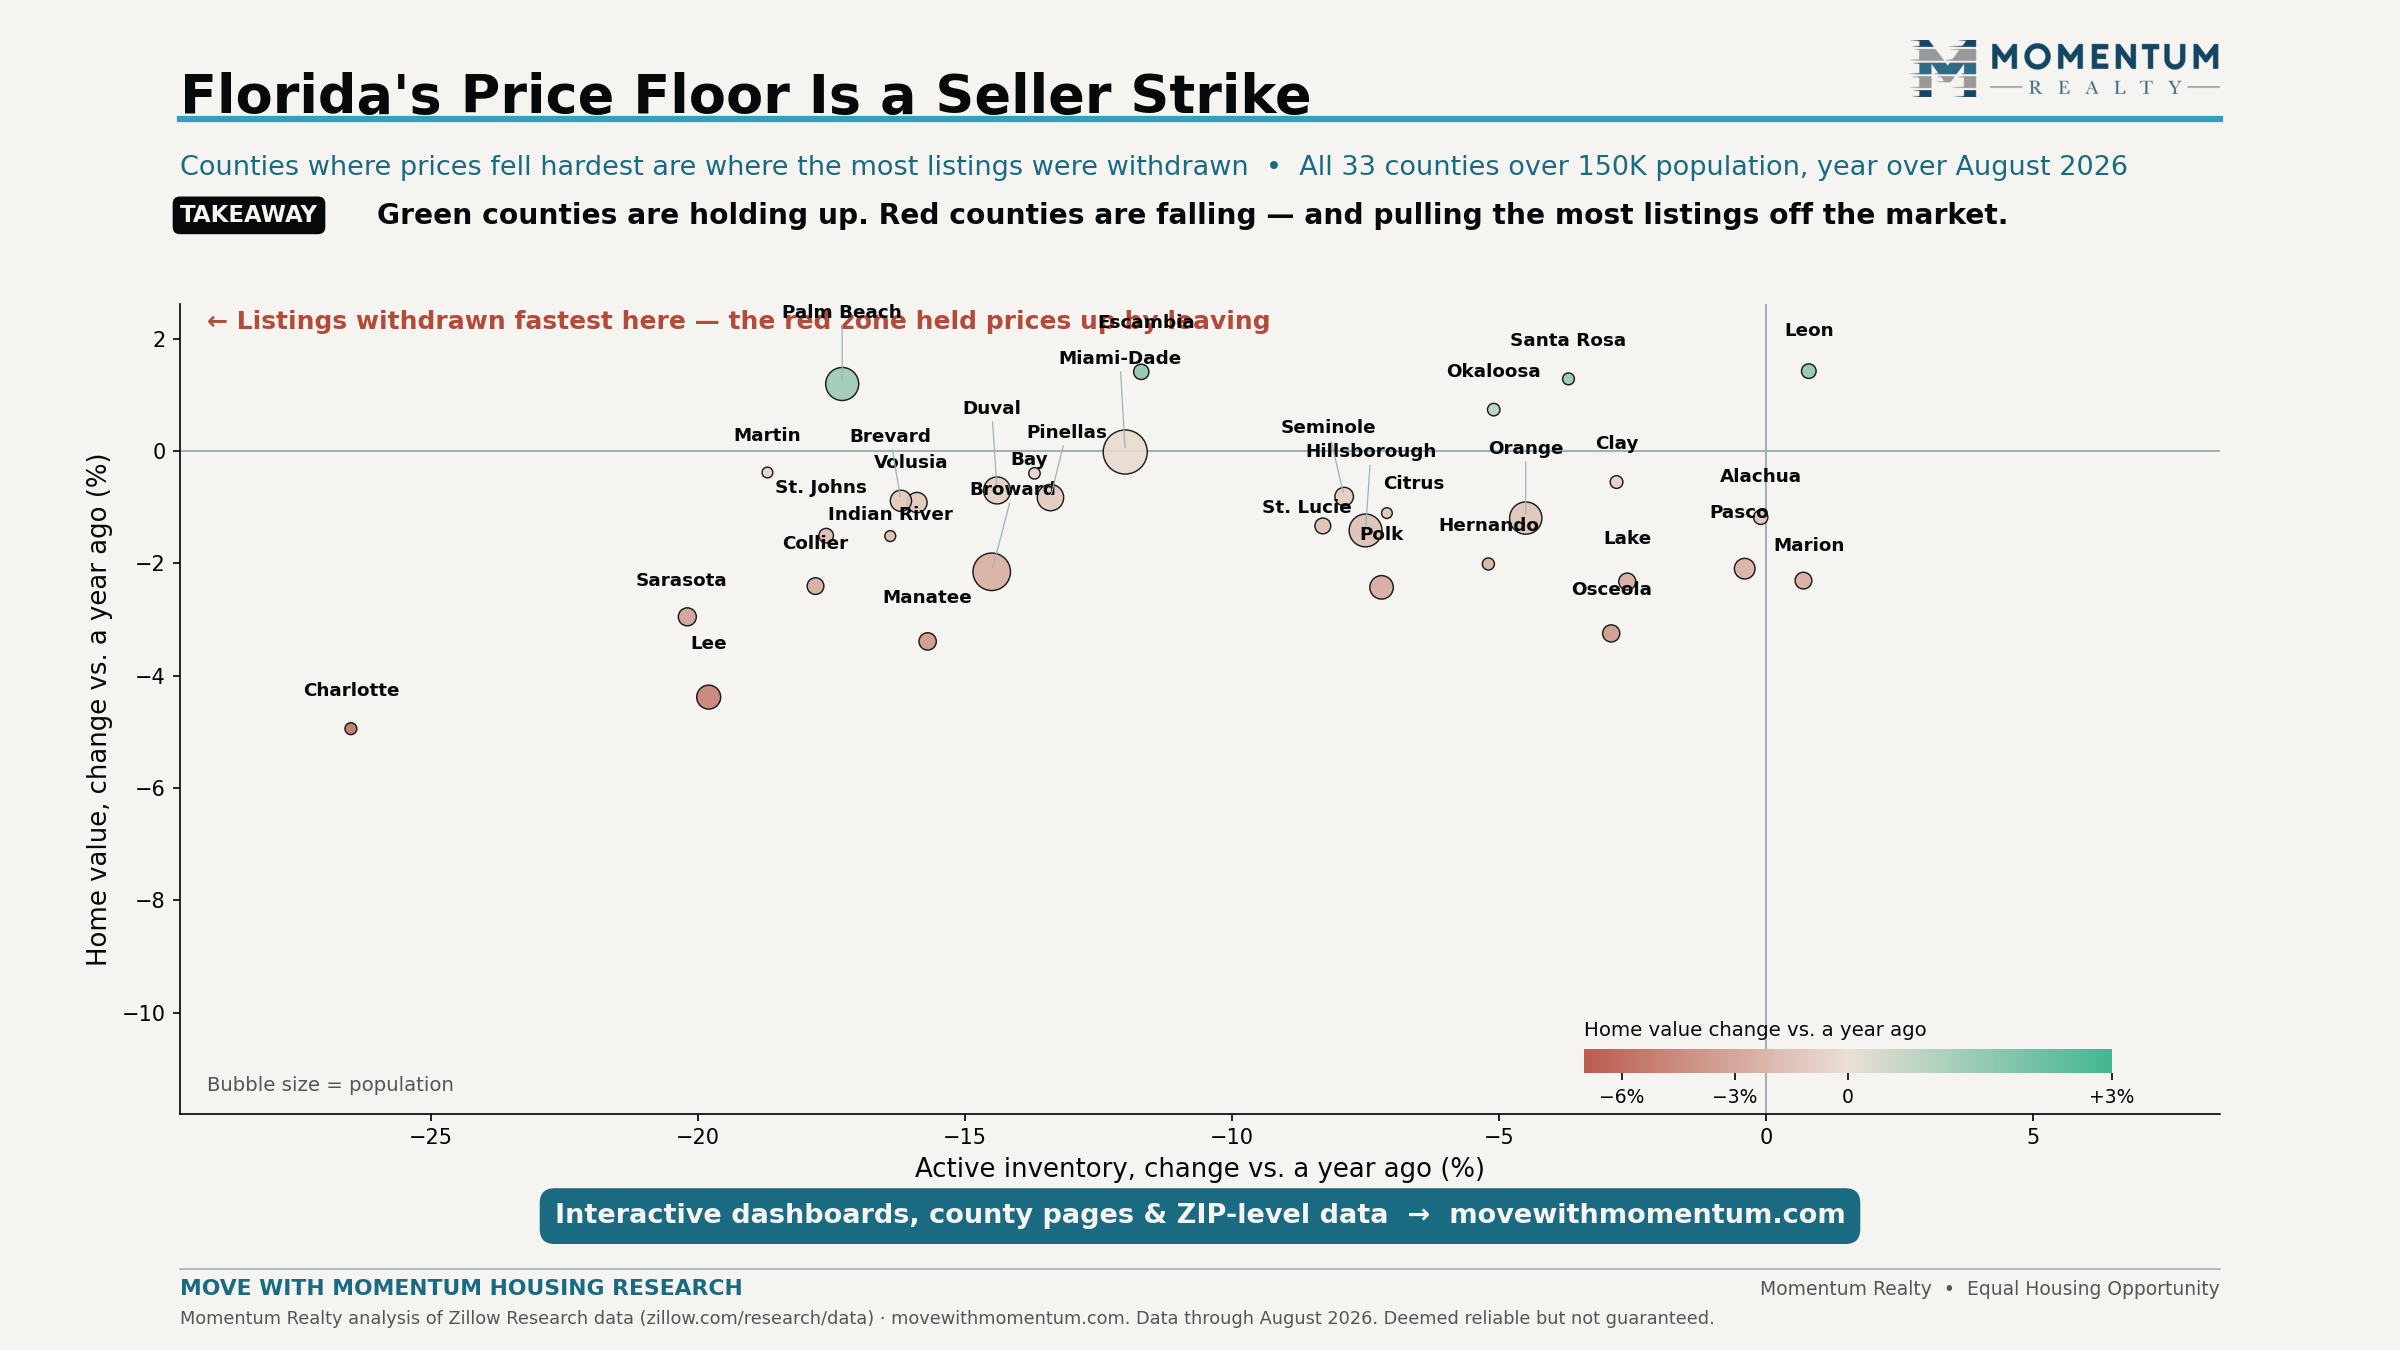
Chart 3 — Price cuts hold near one in four
In one sentence: Price-cut share is this page's best leading indicator — it bottomed in December, surged through the spring, and correctly called the spring price declines in advance; it has now eased five straight months.
Key facts
- 24.2% of active Florida listings had a price reduction in August 2026, roughly 1 in 4.
- The share bottomed at 21.7% in December 2025, peaked at 25.4% this March, and has held near 24–25% since; a year ago it was 26.0%.
- Highest current county cut-shares: Seminole (32.8%), Union (32.7%), Hillsborough (32.6%) (Momentum calculation from Zillow county data).
- Cut-share turns have led statewide price turns by roughly four months at both ends of this cycle.
How price cuts work as a signal
A price cut is a seller updating their beliefs in public. Because asking prices adjust weeks-to-months before closed prices print, the share of listings taking a reduction functions as an early-warning system for where values head next. It is also mechanically honest: unlike sentiment surveys, a cut is a costly action, taken reluctantly. When the share rises while inventory is falling — as it has all spring — the signal is even stronger, because it means even a thinned-out, presumably more committed pool of sellers is being forced to reprice.
Findings — what changed this month
August's reading of 24.2% is a fifth straight monthly easing off the March peak, and the first month of the run that coincided with a statewide price gain. The level still matters more than the wiggle: cuts have held near one in four through the entire spring and summer listing season. The spring surge (21.7% in December to 25.4% by March) was the early warning; the slow summer easing is consistent with the plateau holding, not yet with a recovery.
Interpretation — historical context and what it may signal
In this cycle, cut-share ran near 28% in mid-2025, months before the steepest value declines; its December trough anticipated the winter flatline; its spring climb anticipated the flatline's failure. At 24.2% the market is squarely in correction territory but below last summer's 26–28% — consistent with continued modest declines rather than acceleration. Watch the fall readings, when withdrawn sellers typically re-list: a push back toward 27–28% would say the repricing is deepening; a sustained rollover from here would be the first credible bottoming signal of this cycle. No indicator is infallible, and cut-share can shift with inventory mix — see research notes.
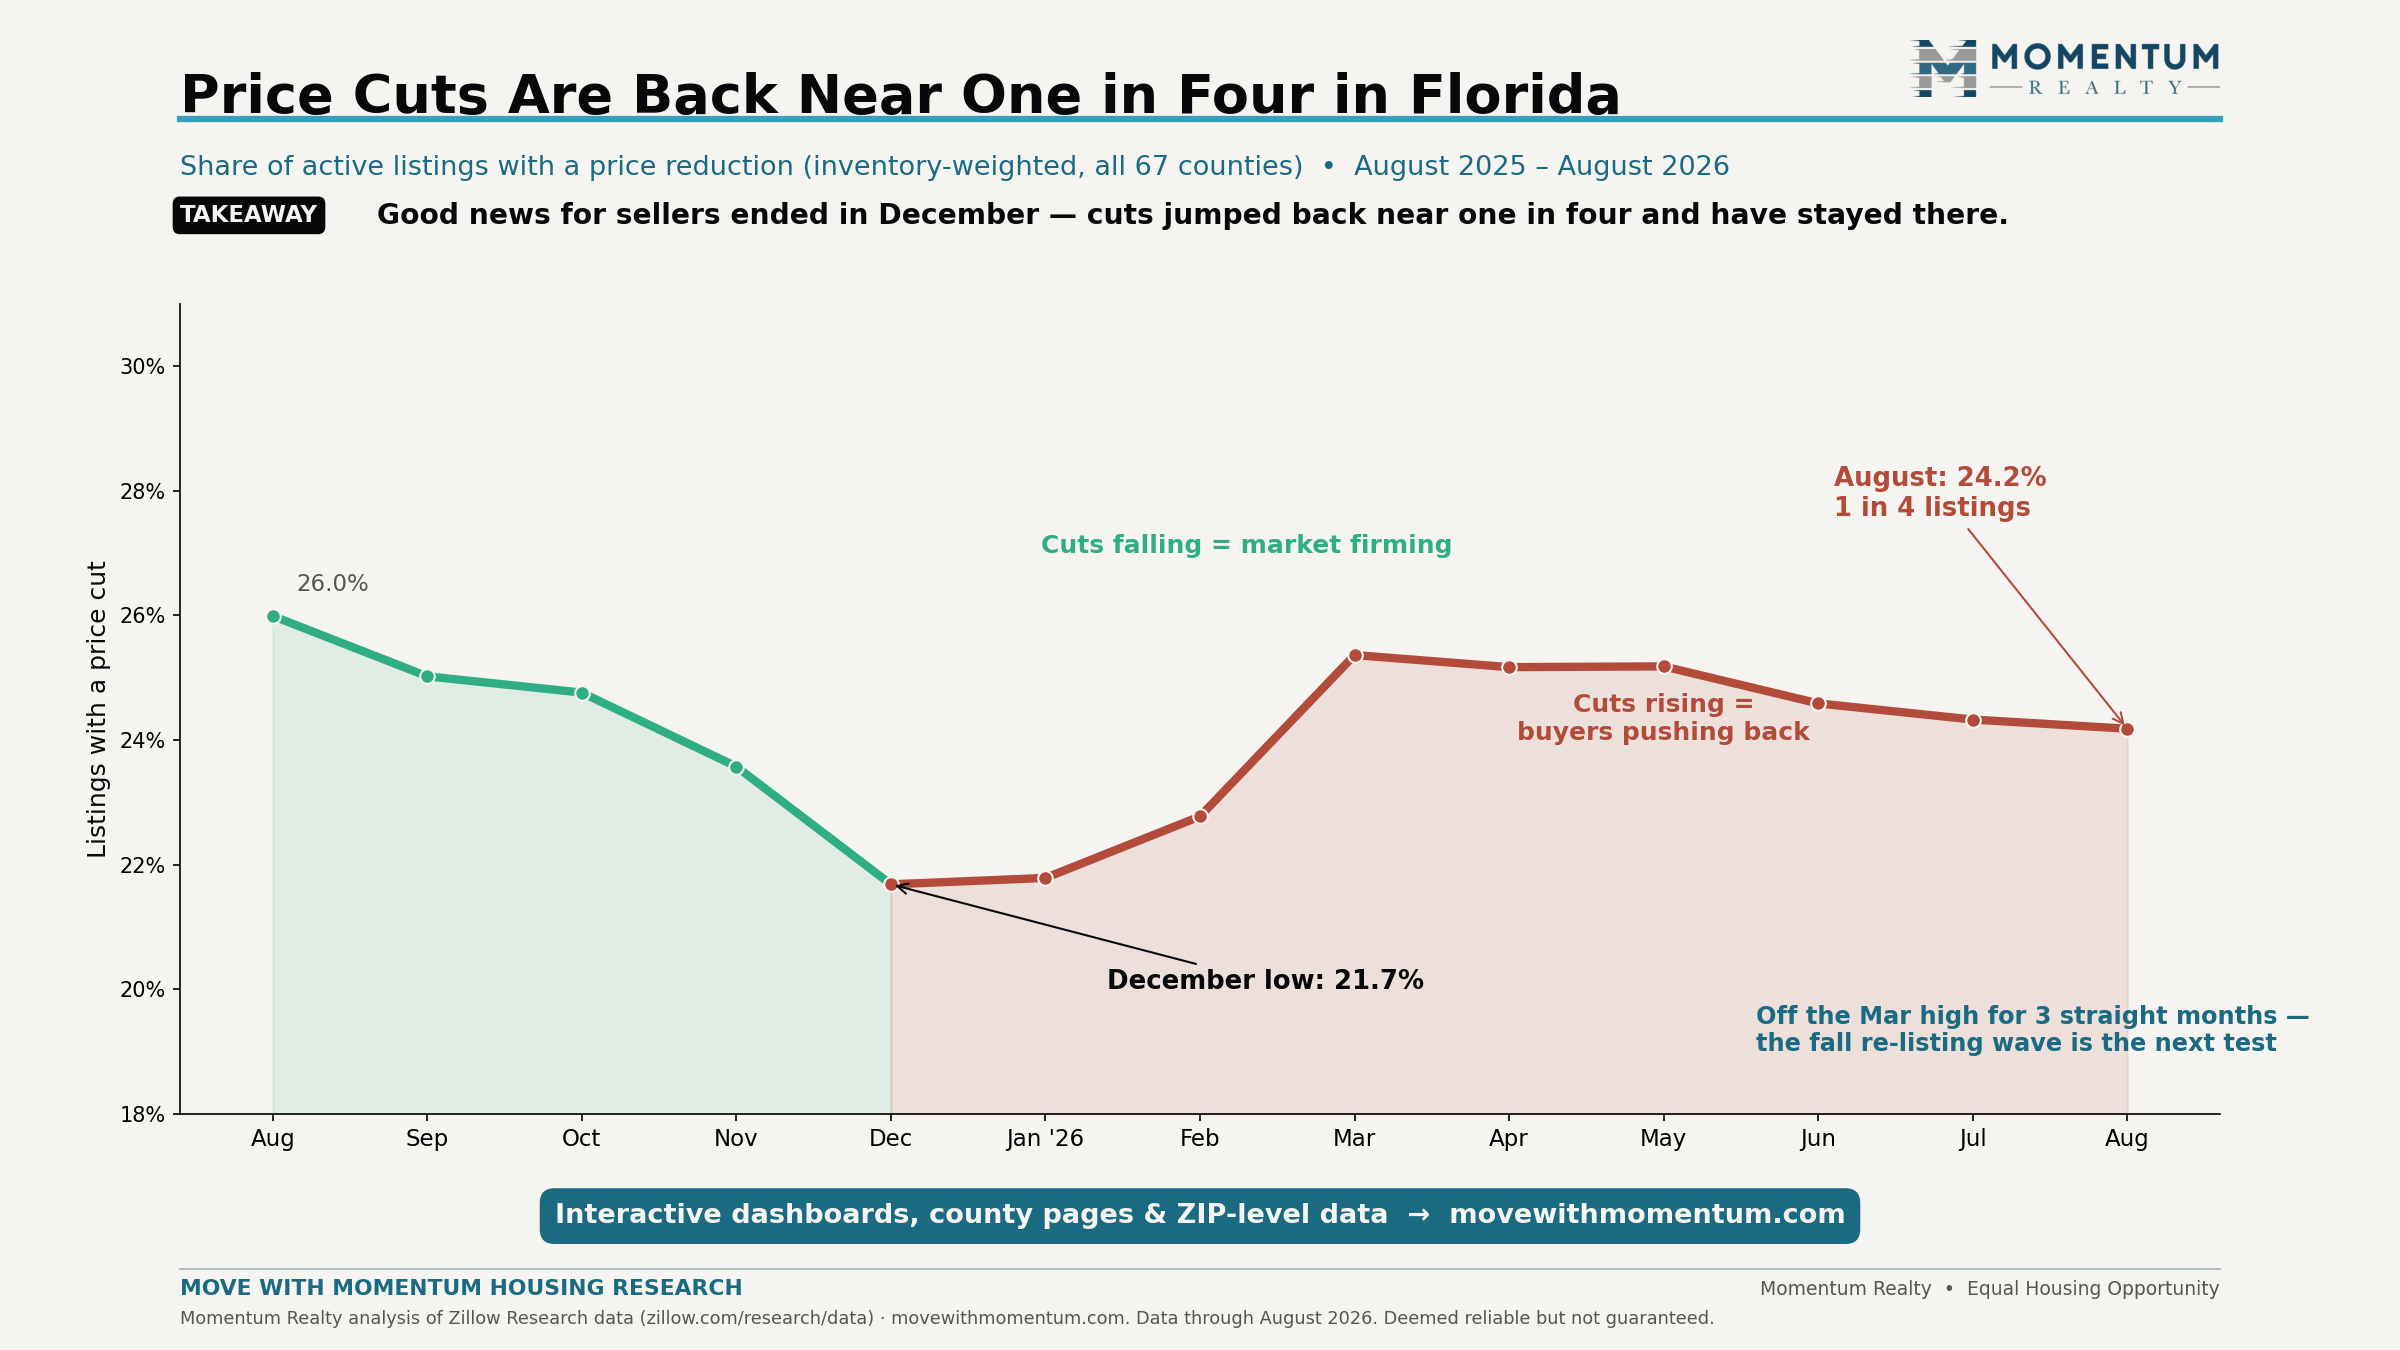
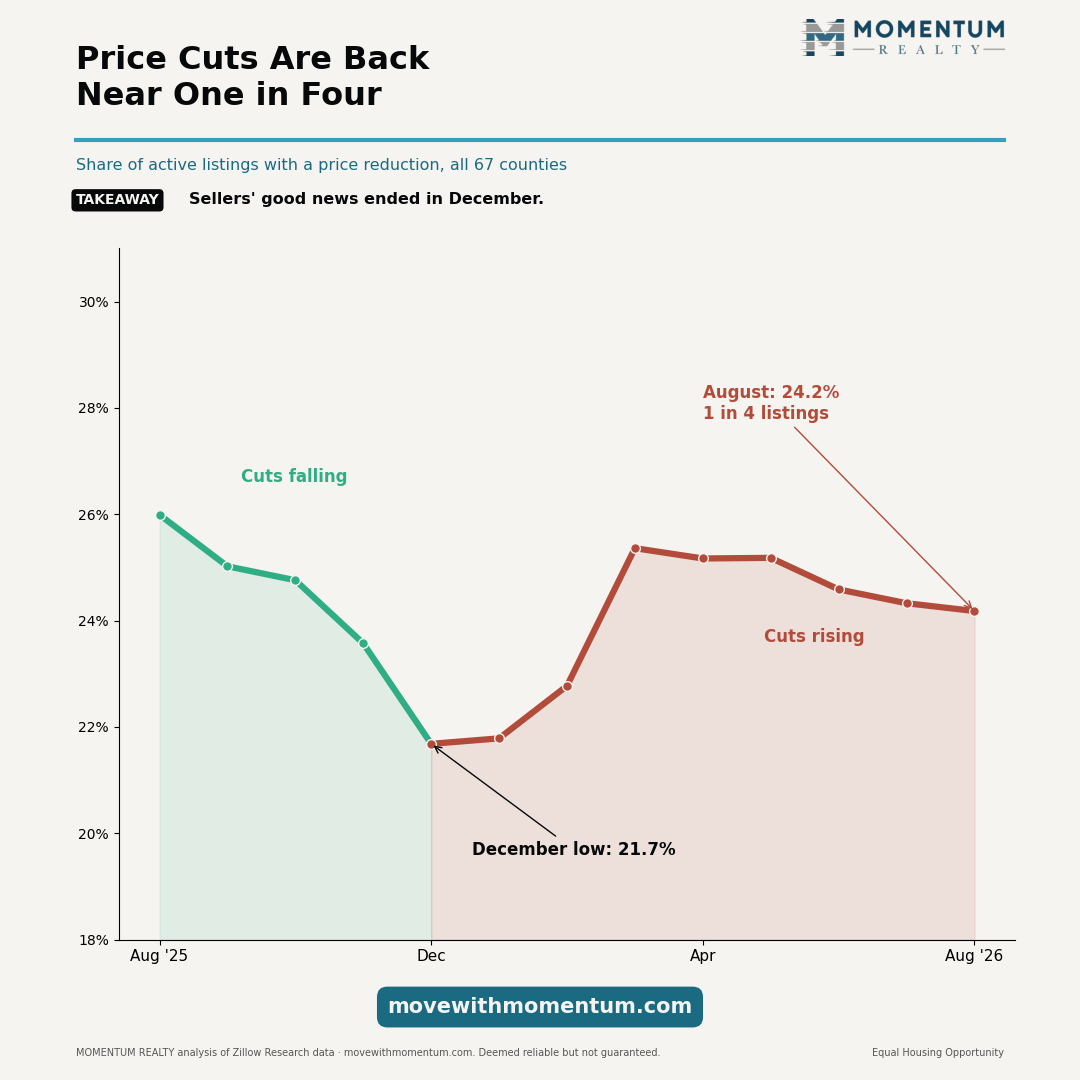
Chart 4 — 66% of ZIP codes lost value in a year
In one sentence: The correction is broad but shallow: 66% of Florida ZIP codes are below their year-ago value, yet the typical decline is under 1%.
Key facts
- 527 of 801 Florida ZIP codes with population over 5,000 (66%) were below their August 2025 value, down from 75% last release.
- The median ZIP declined 0.9%: breadth, not depth.
- 74% of those ZIPs (592 of 801) are also below their value of three years ago (August 2023).
Findings — what the data shows
Value declines still reach most of the state: 66% of populated ZIP codes are below year-ago levels, down from 75% a month ago. The distribution matters as much as the share: the dots cluster tightly around −0.9%, with thin tails. Only a small minority of ZIPs are down more than 10%, and those concentrate in identifiable segments: older condo/co-op communities and southwest-coast markets.
Interpretation — why breadth-without-depth matters
Broad shallow declines and narrow deep declines are different diseases. Narrow-and-deep (the 2008 pattern in exurban Florida) signals localized distress — overbuilding, speculation, foreclosure contagion. Broad-and-shallow signals a common statewide force acting on everything at once: the affordability ceiling created when values outran incomes by 30 points and rates doubled. That force compresses all prices modestly rather than collapsing a few markets dramatically. For anyone modeling risk, dispersion is the statistic to watch — a widening left tail would be the early sign of the correction turning into something worse. So far it has not widened materially.
Historical context
The three-year figure is the quiet story: 74% of populated ZIPs are below August 2023, meaning most of Florida has now given back more than two years of appreciation. Yet because the 2020–2022 boom was so large, even three years of givebacks leave the median ZIP far above pre-pandemic levels — the same partial-giveback shape visible in the county tables (Charts 8–9).
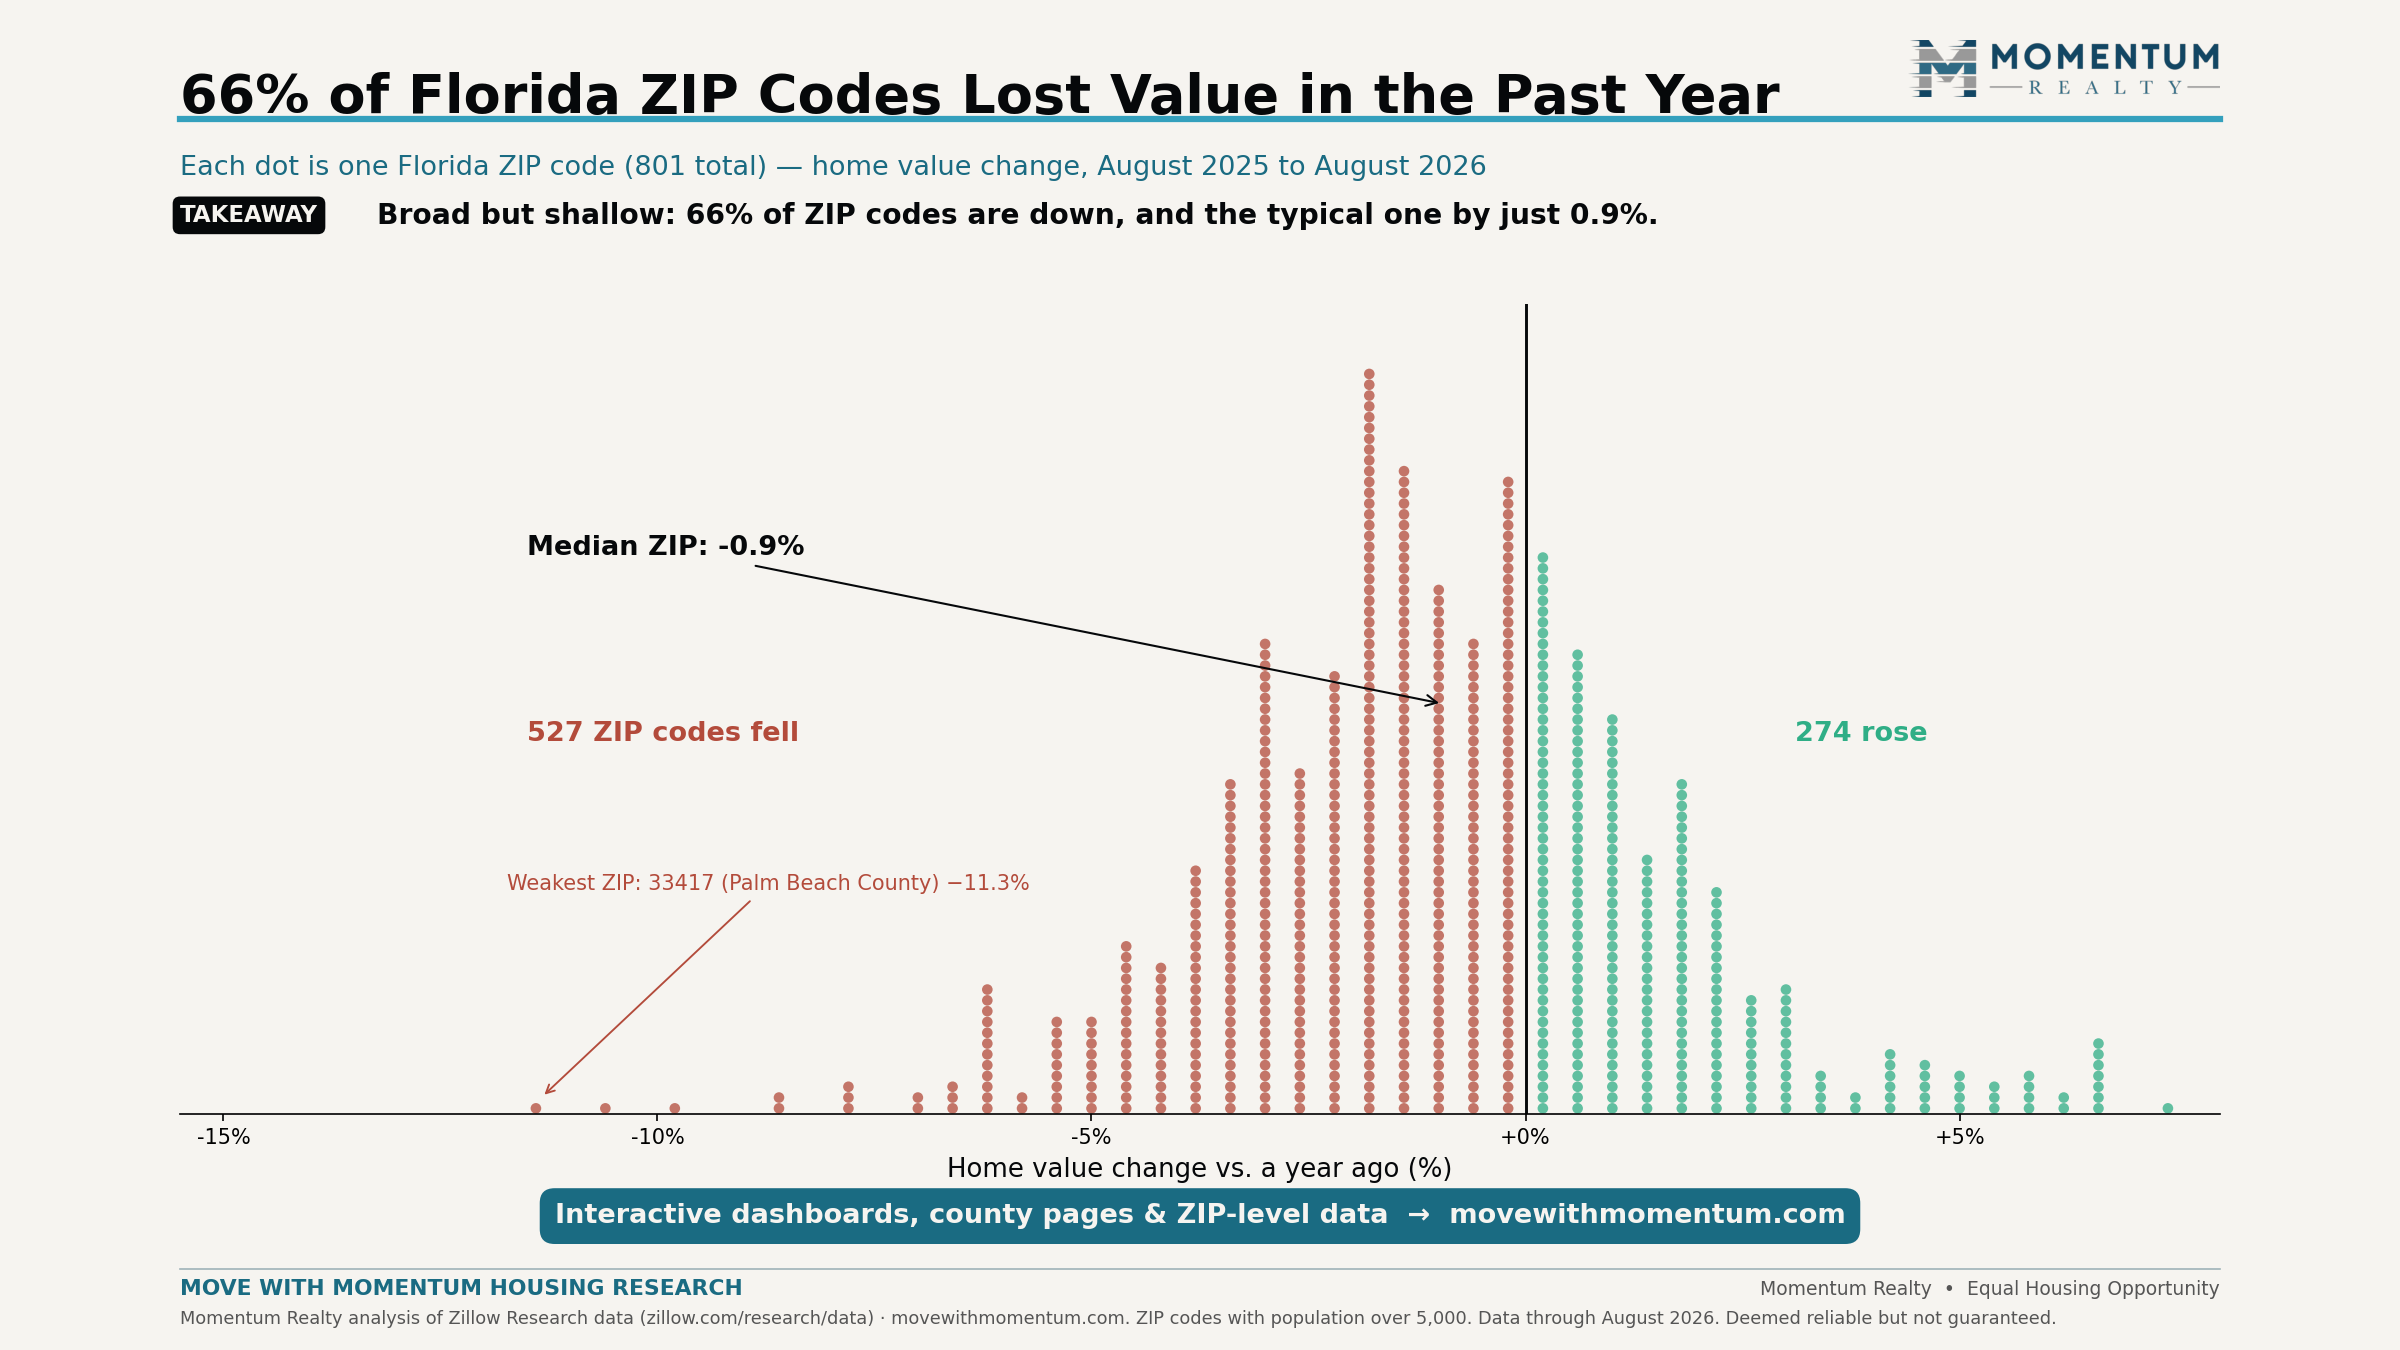
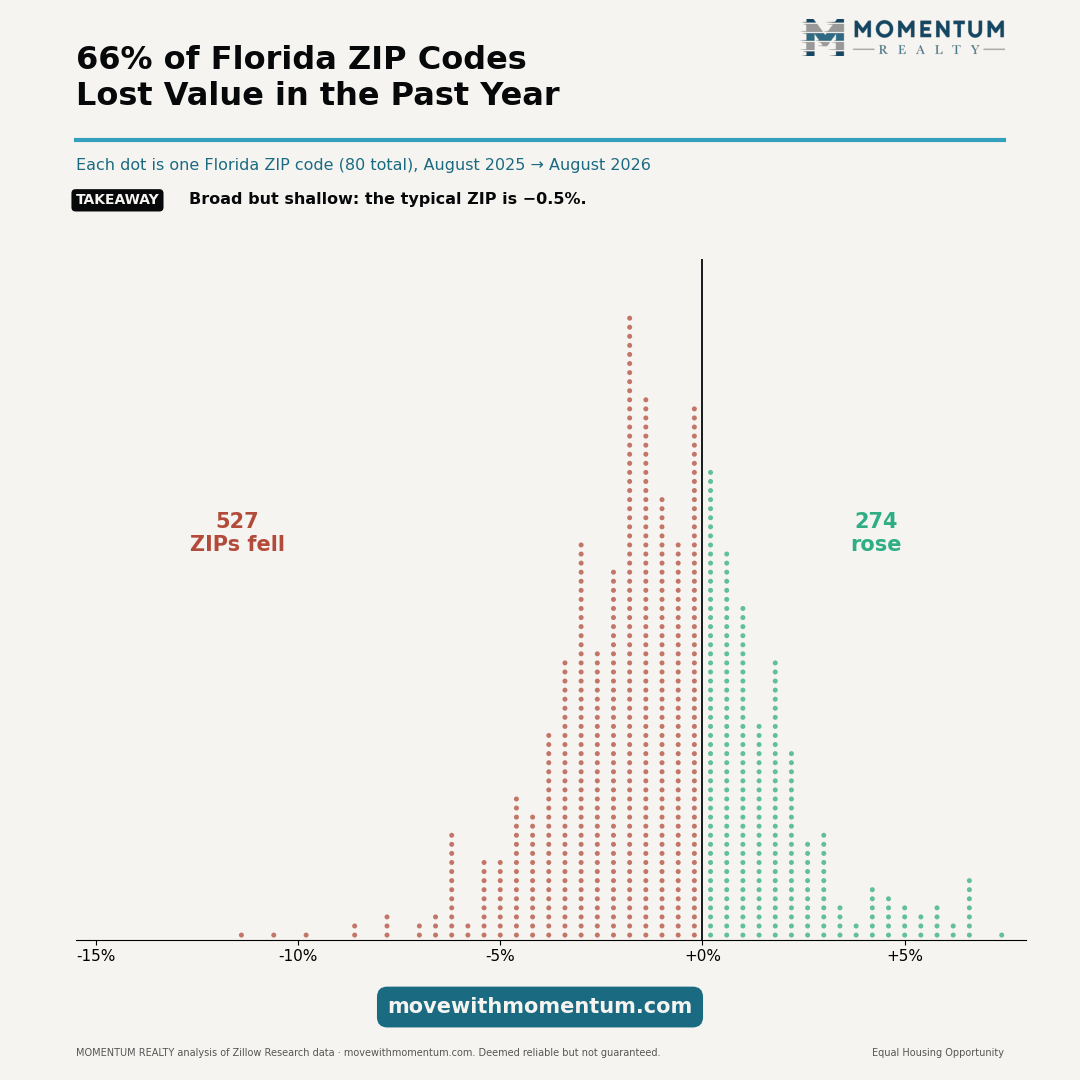
Chart 5 — Same county, opposite markets
In one sentence: County averages are hiding 25-point spreads inside single counties — the real market splits by price segment and property type, not by county line.
Key facts
- Widest intra-county spread: Palm Beach County, where ZIP 33417 fell 11.3% while ZIP 33496 rose 13.2% over the same year.
- The weakest ZIPs are disproportionately older condo/co-op communities; the strongest are high-priced single-family areas.
- Every large Florida county contains both rising and falling ZIP codes.
Findings — what the data shows
Take any large Florida county and compare its best- and worst-performing ZIP over the past year: the spread routinely runs 8–25 percentage points. Palm Beach is the extreme — a county whose headline average (−3% range) describes almost none of its actual neighborhoods, because it blends a −11% condo-heavy ZIP with a +13% luxury single-family ZIP.
Interpretation — why we think it happened
The correction is segmented, not geographic. Insurance premiums, condo association assessments, and post-Surfside structural-reserve requirements act like a tax that scales inversely with price point — a $500/month assessment increase is ruinous math on a $135K condo and a rounding error on a $1M house. Meanwhile the buyers least affected by mortgage rates (cash-heavy, higher-wealth households — see our cash-share research) concentrate in exactly the segments that are holding. The result: the bottom of the market reprices while the top holds or rises, inside the same county.
What this means in practice
Any decision priced off a county average — an offer, a listing price, an underwriting assumption, a headline — inherits this error. The county lookup above and the ZIP rankings exist precisely so buyers, sellers, and reporters can work one level down, where Florida's housing market actually clears. Note these are market-level statistics, not a valuation of any specific property.
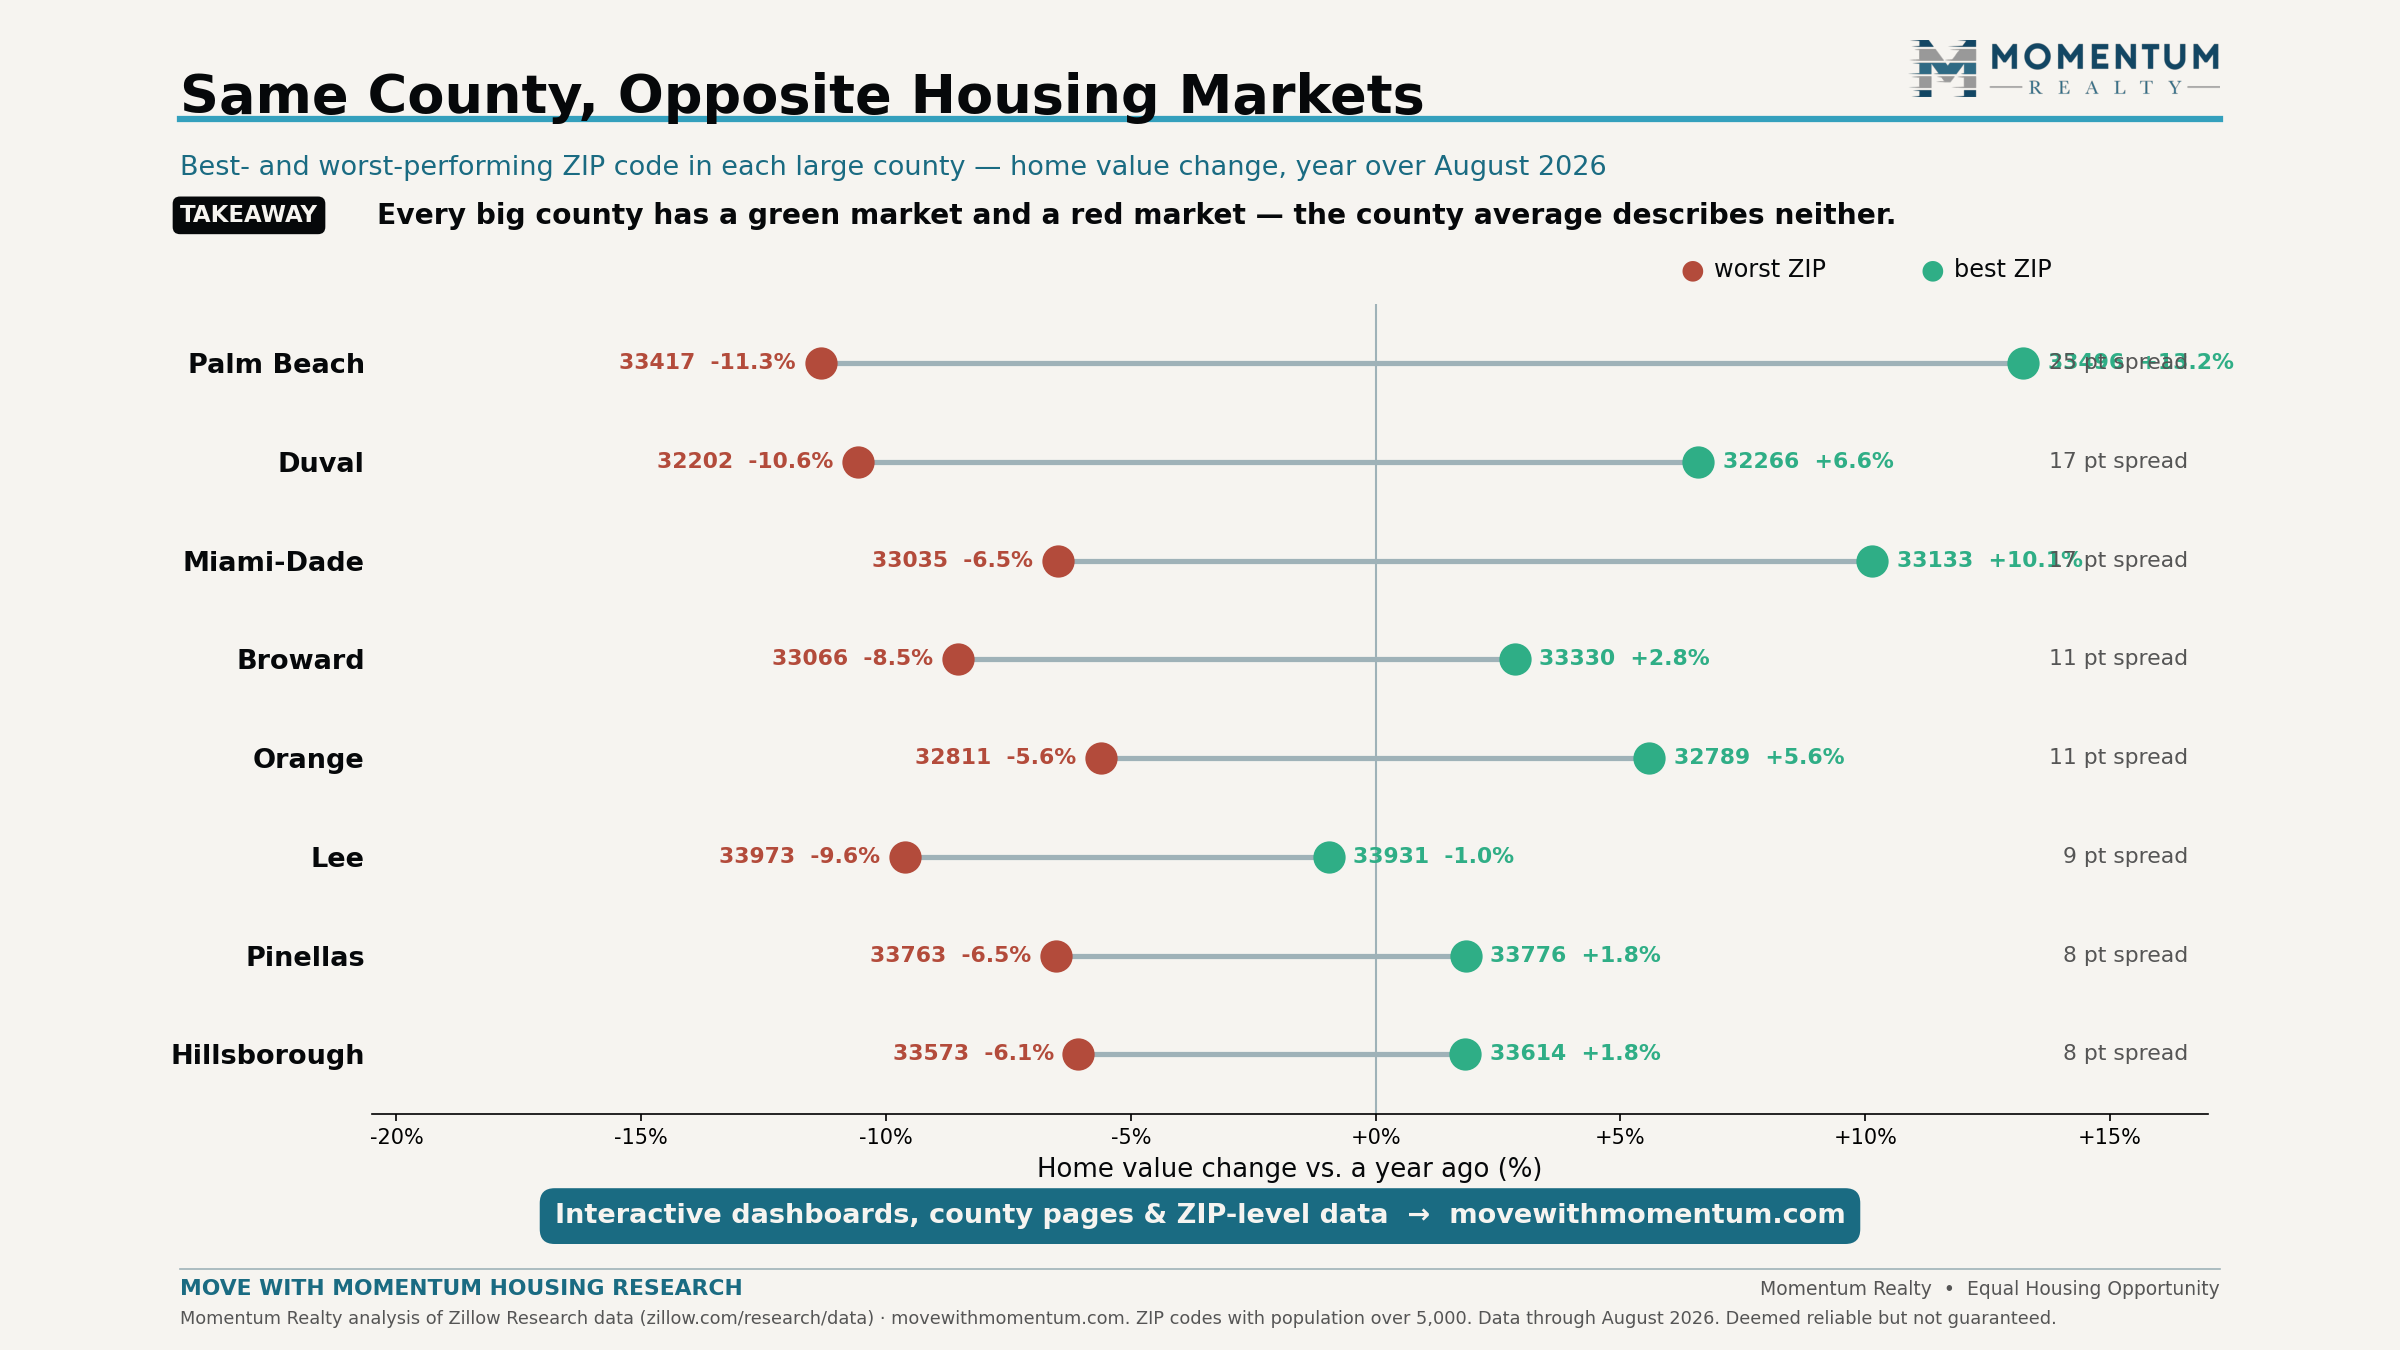
Chart 6 — The Two Floridas
In one sentence: Florida has split into two housing markets — an inland North Florida where several counties are still setting record highs and a coastal peninsula that is correcting, hardest on the southwest Gulf Coast.
Key facts
- 41 of 67 counties were below their year-ago value in August 2026, down from 46 last release.
- The counties still rising are concentrated in inland North Florida; Taylor leads at +6.1%, then Lafayette +5.8% and Hamilton +5.7%.
- Deepest declines: Charlotte −4.9% and Lee −4.4%, both on the southwest Gulf Coast.
- 5 counties are at record-high values: Hamilton, Jefferson, Liberty and Baker in North Florida, plus Hardee.
Findings — what the data shows
The county map has settled into a stable two-color pattern: green concentrated in the rural inland north, red across the peninsula and both coasts, deepest in the southwest. This is not a one-month artifact — the same geography has held for over a year, and the gap keeps widening in the rankings (Chart 8).
Interpretation — why we think it happened
Three overlapping geographies explain the map. Affordability migration: inland North Florida counties are the state's least expensive markets ($180K–$320K), and demand priced out of the metros flows toward them — the one segment of Florida demand that rising costs strengthen rather than weaken. Insurance geography: the coastal counties carry the state's highest and fastest-rising premiums; the southwest coast additionally overlaps Hurricane Ian's 2022 landfall zone, where post-storm rebuilding met the demand cliff. Boom composition: the Gulf Coast pandemic boomtowns (Charlotte, Lee, Sarasota) ran furthest above income-supported prices, so they have the most to give back — Charlotte boomed hard enough that it now ranks last in growth since 2019 despite being a top-tier pandemic winner.
Historical context
Divergence this wide between regions of one state is unusual outside recessions. The inland-north outperformance is the affordability story wearing a different costume: the same force pushing coastal prices down (payments exceeding incomes) pushes demand inland. Whether those small markets can absorb it without overshooting is one of the questions we track monthly — several are already at record highs on thin volume, which cuts both ways.
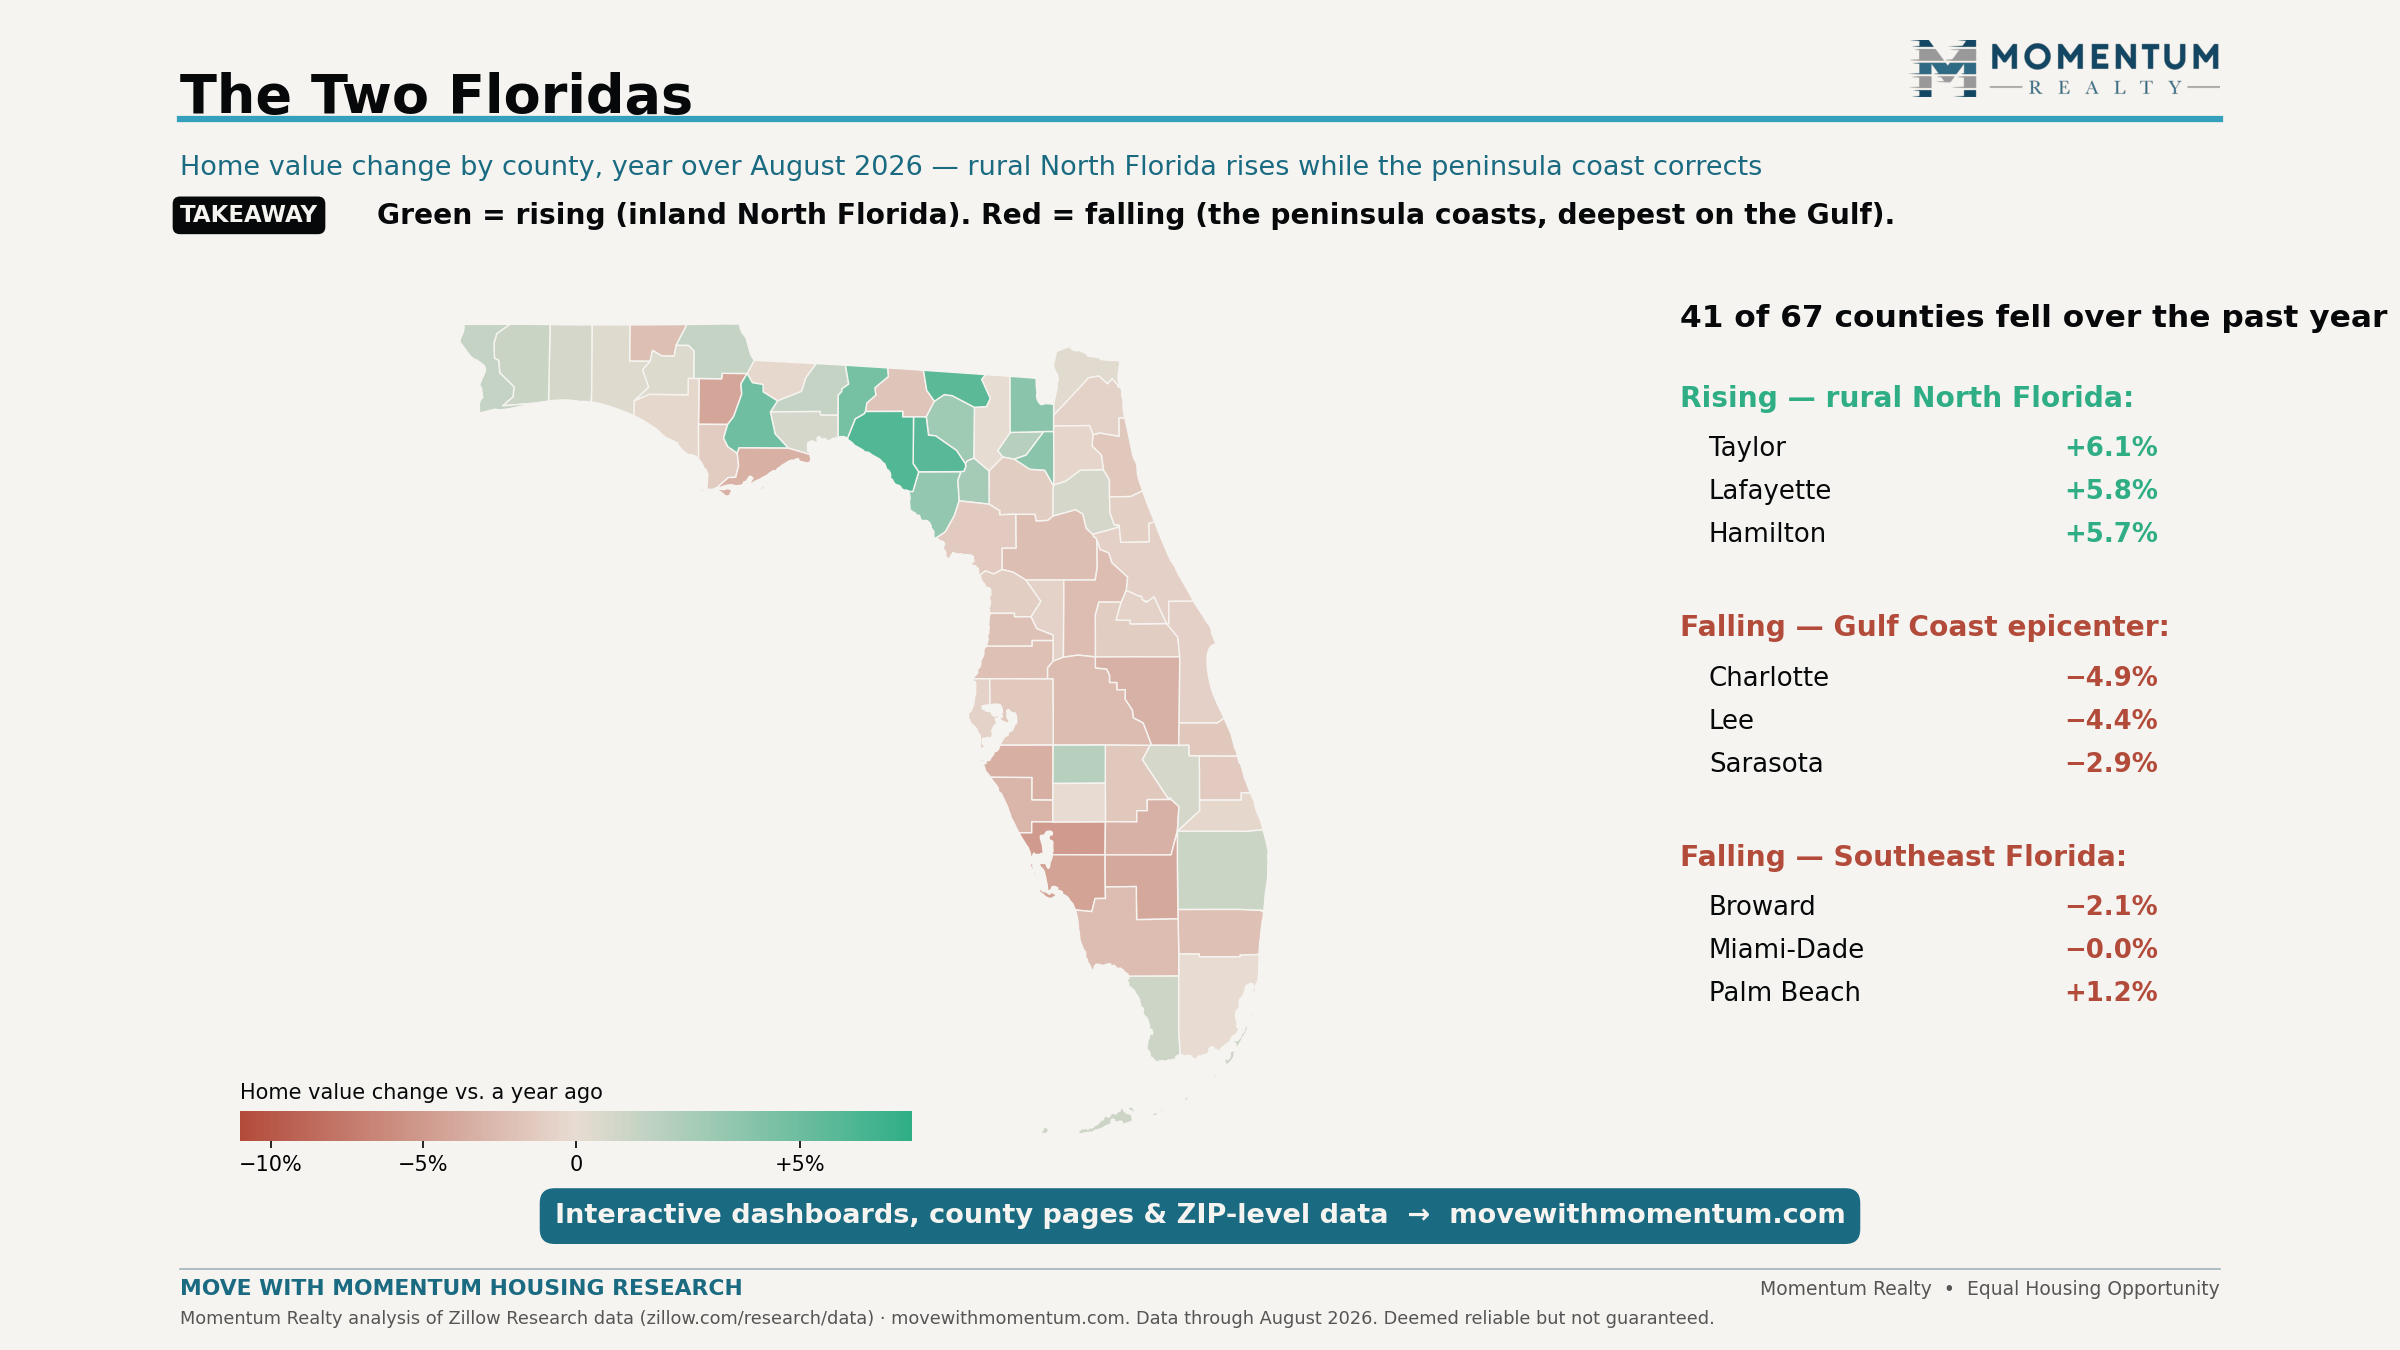
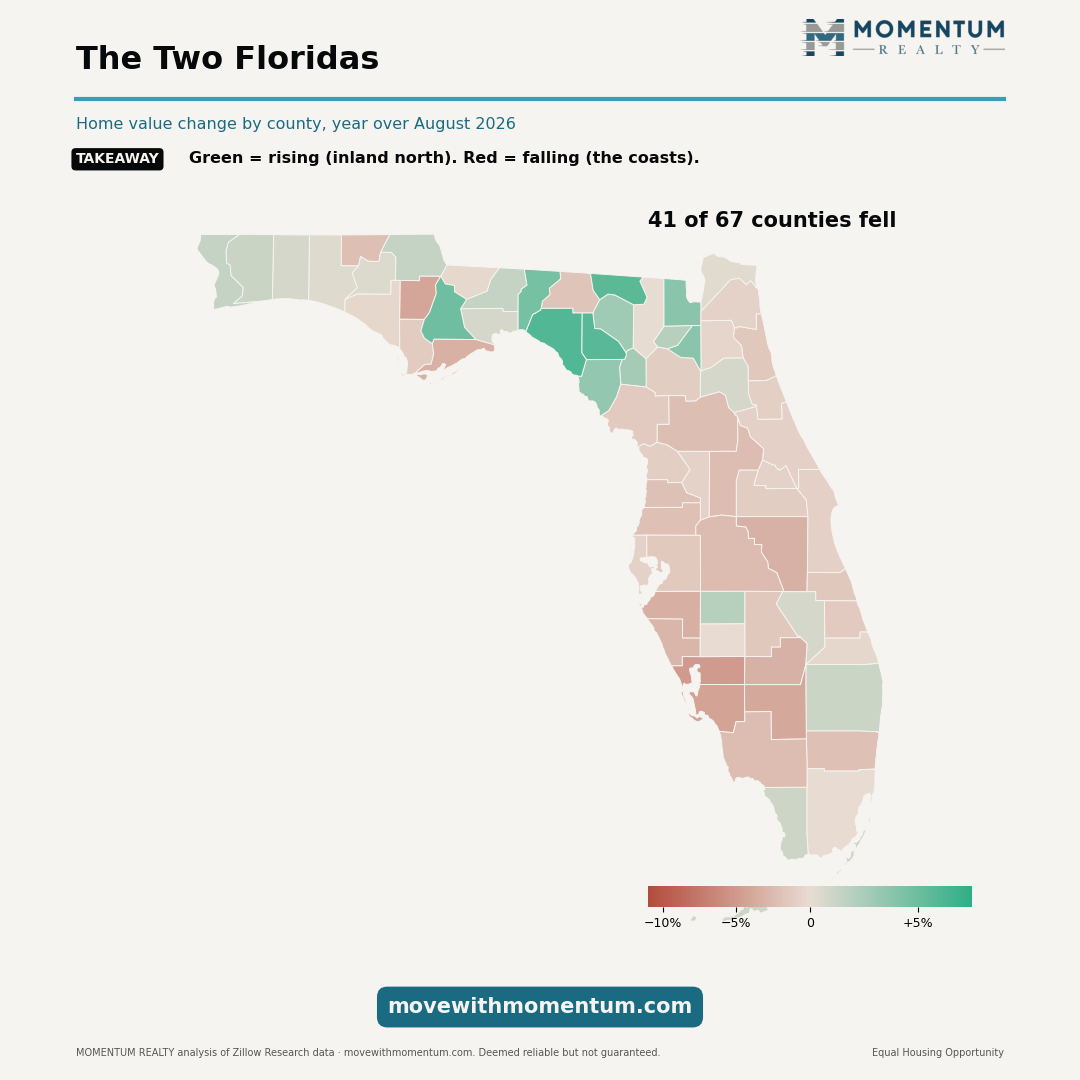
Chart 7 — Palm Beach's 25-point split
In one sentence: Florida's condo repricing works from the bottom up — the cheapest condo-heavy ZIP in Palm Beach County fell 11% while the county's $1M single-family ZIP rose 13%.
Key facts
- ZIP 33417 (West Palm Beach, older condo/co-op communities, ~$135K typical value): −11.3% year over year.
- ZIP 33496 (Boca Raton, ~$1.05M typical value): +13.2% over the same period.
- The 25-point spread is the widest intra-county gap among Florida's large counties.
Findings — what the data shows
Indexed to August 2025, the two ZIP codes have moved in opposite directions nearly every month — this is a persistent structural divergence, not volatility. The lowest-priced housing in one of America's wealthiest counties is repricing at a double-digit annual pace while its highest-priced housing appreciates.
Interpretation — why we think it happened
The economics are brutally simple: fixed costs against a small denominator. Post-Surfside legislation (structural integrity reserve studies, funded reserves, milestone inspections) plus insurance repricing added hundreds of dollars a month to the cost of owning an older condo. On a $139K unit, a $400–600 monthly increase is equivalent to a 25–40% price cut in payment terms — so the price adjusts. On a $1M+ single-family home bought disproportionately with cash, the same shocks barely register. Add rate-sensitive entry-level buyers versus rate-immune wealthy buyers, and both ends of the spread are explained.
Interpretation — what it may signal
Bottom-up repricing tends to climb the ladder slowly: as older-condo prices fall, they pull comparable-segment valuations with them, while the single-family and luxury segments remain on their own cycle. For the statewide numbers, this means condo-heavy metros (Southeast Florida, parts of Tampa Bay) will keep printing weaker aggregate figures than their single-family submarkets actually experience — one more reason segment-level data beats county averages (Chart 5).
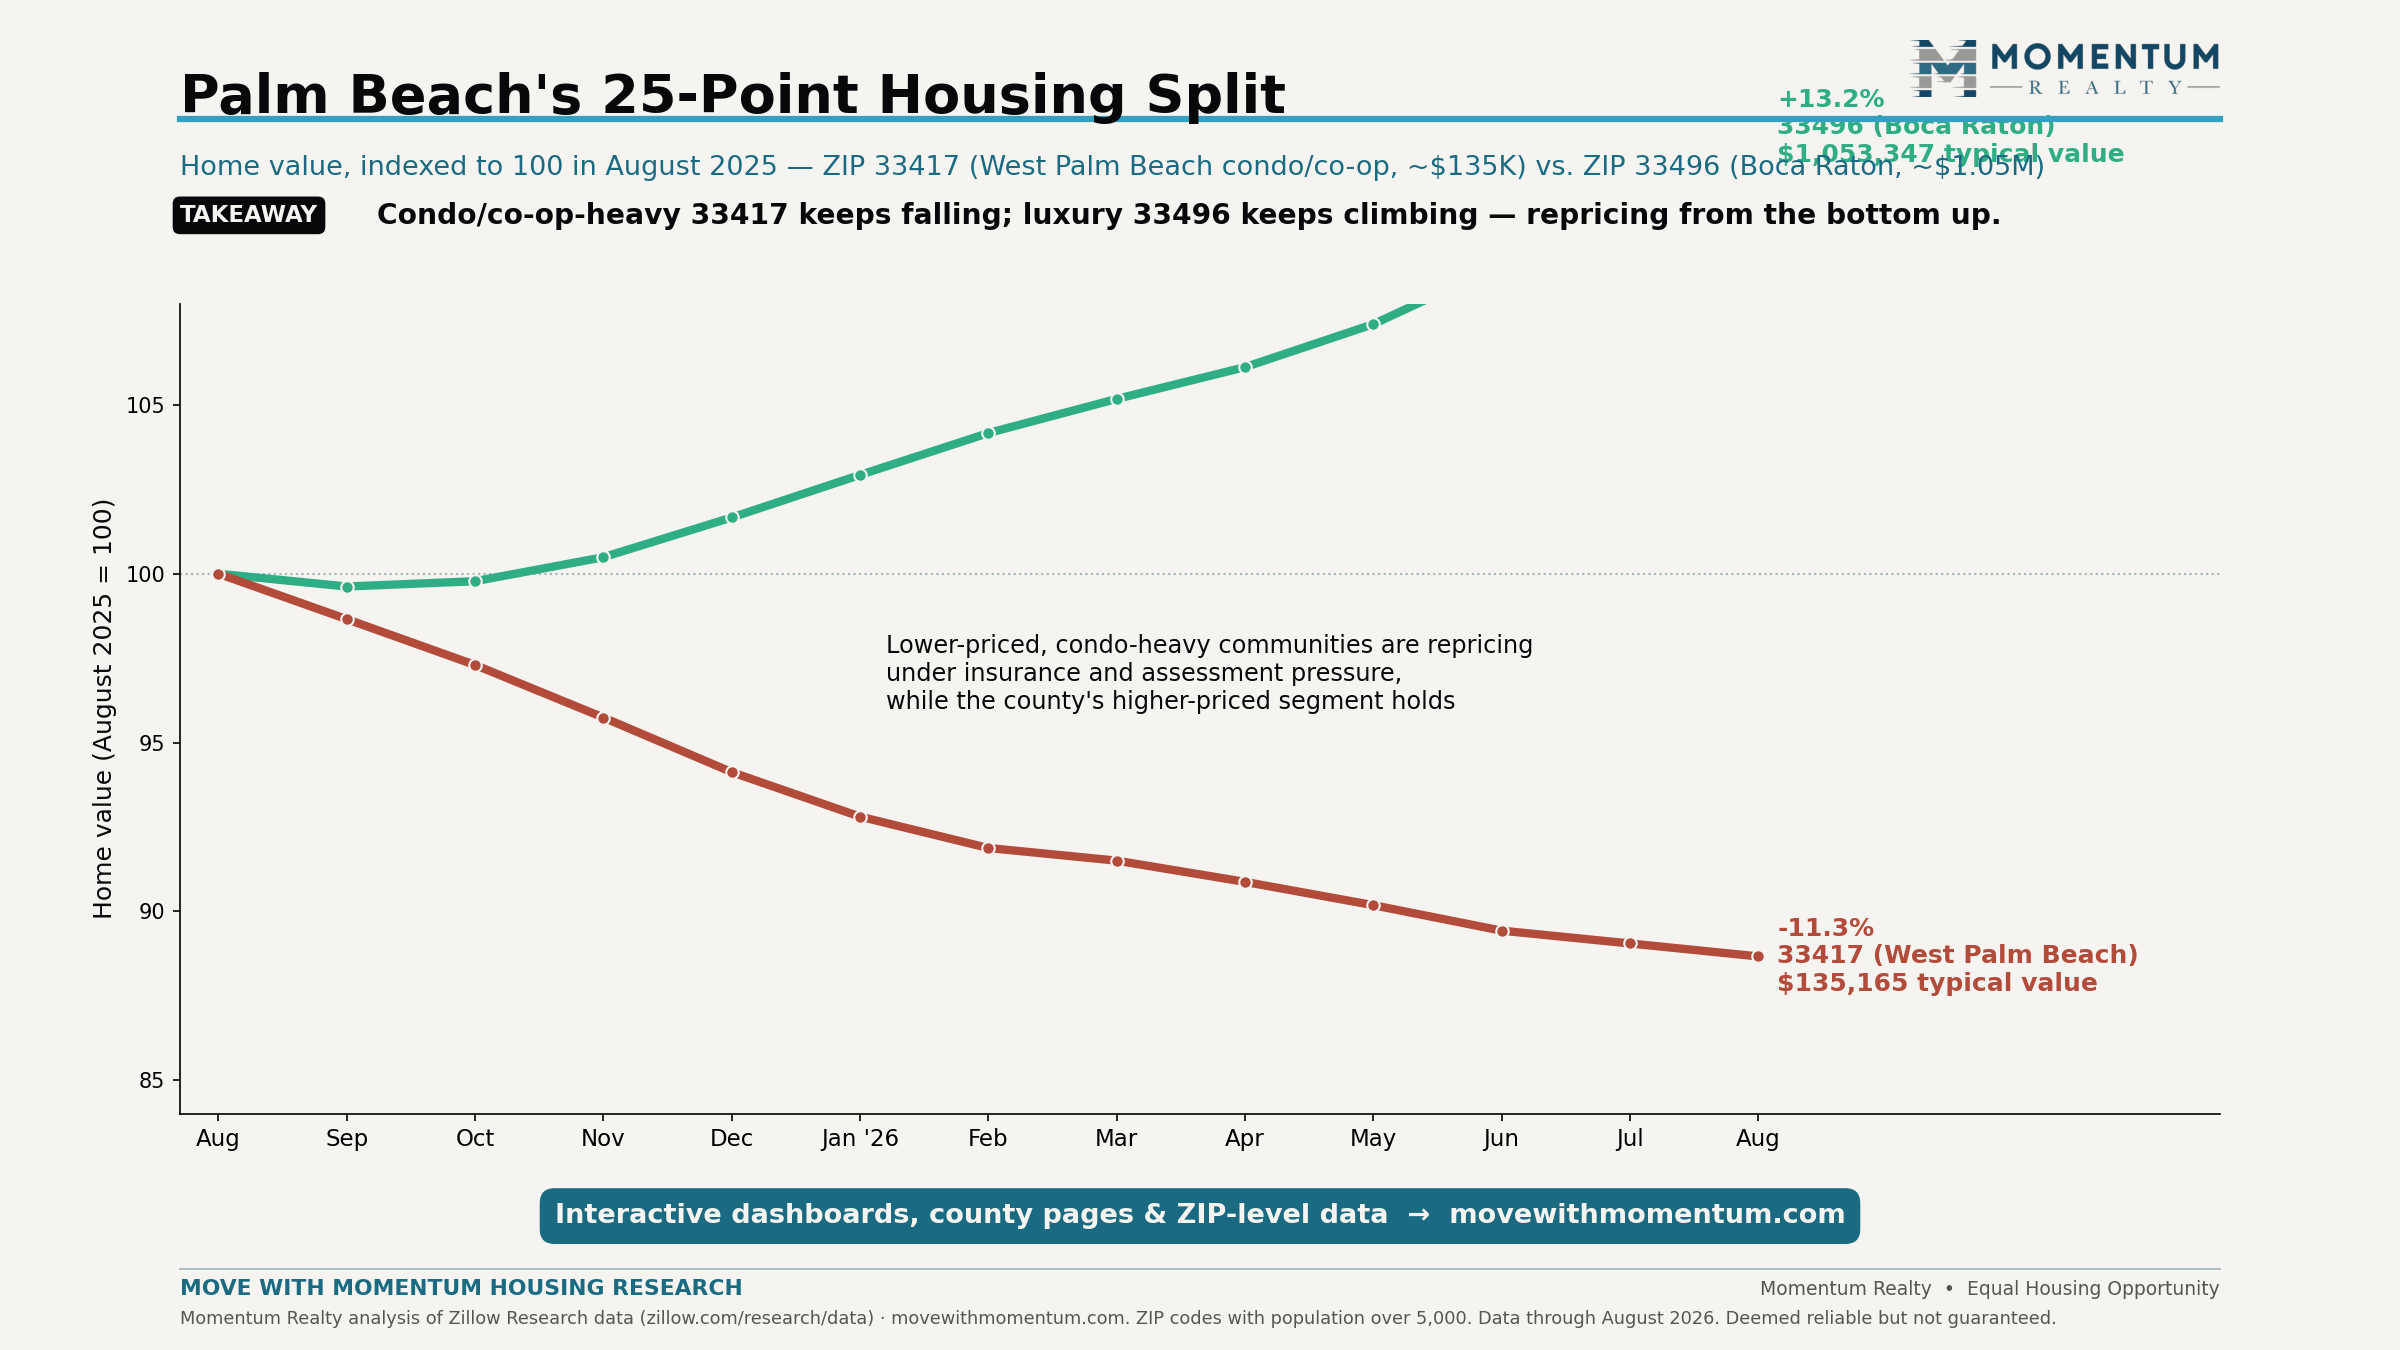
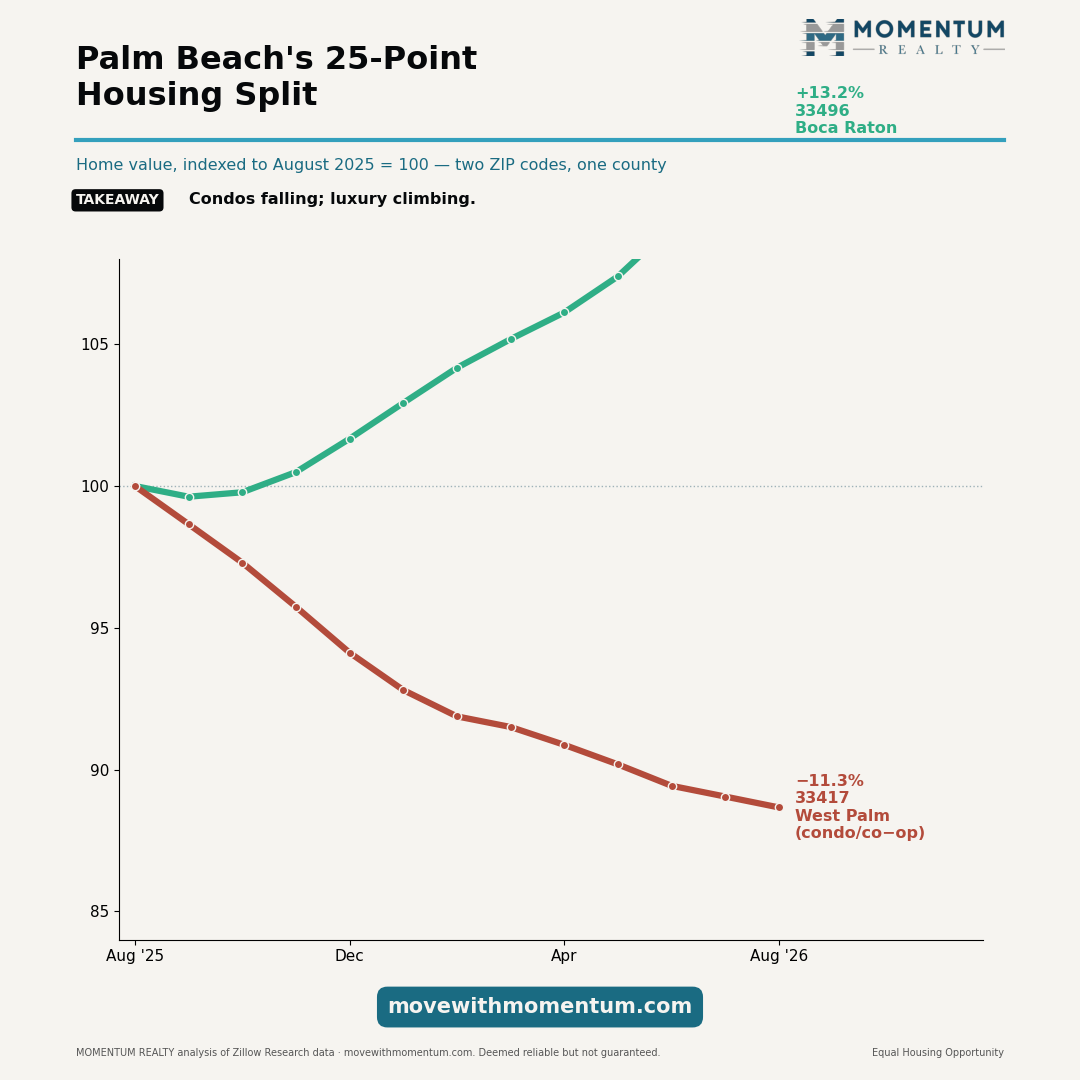
Chart 8 — Florida home values by county, ranked
In one sentence: The boom leaderboard has fully inverted — the cheap rural counties nobody covered lead Florida since 2019, while the pandemic darlings of the Gulf Coast sit at the bottom, as much as 23% below peak.
Key facts
- Every one of Florida's 67 counties remains 34–95% above its 2019 value.
- 5 counties are at record highs (Hamilton, Jefferson, Liberty and Baker in North Florida, plus Hardee); Hamilton and Gilchrist lead the vs-2019 ranking at +95% and +91%.
- Deepest drawdowns from peak: Charlotte −22.6%, Lee −17.5%, Sarasota −16.6%.
- The median county is 5.7% below peak; 30 of 67 are within 5% of peak.
What the table shows
Reading down the vs-2019 column: the top is a roll call of small, inexpensive, inland counties; the bottom is the 2021 boom-town map. Charlotte County is the starkest case — a top-tier pandemic boomtown that has fallen 22.6% from its peak ($384K → $297K) and now ranks dead last in growth since 2019 (+34%). Nothing has round-tripped: the worst-performing county in Florida still beat its 2019 value by a third.
The 2022 column
For most coastal counties the explosive move happened between the 2021 and 2022 columns — and values have drifted sideways-to-down since. Sarasota's 2022 annual average ($476K) exceeds its August 2026 value ($397K): in much of coastal Florida, the story of 2023–2026 is a long unwind of one extraordinary year. Anyone comping against a 2022 sale is comping against the top tick.
How to use this table
The vs-peak column is a negotiation map for buyers (Charlotte, Lee, Sarasota, Manatee offer 2021–2022 prices with 2026 selection) and a pricing reality check for sellers in those markets. The at-peak rows are the affordability-migration story of Chart 6 in tabular form. For researchers, this is the densest single artifact on the page — every county, every year since 2018, growth and drawdown in one image, with the underlying numbers in the release dataset.
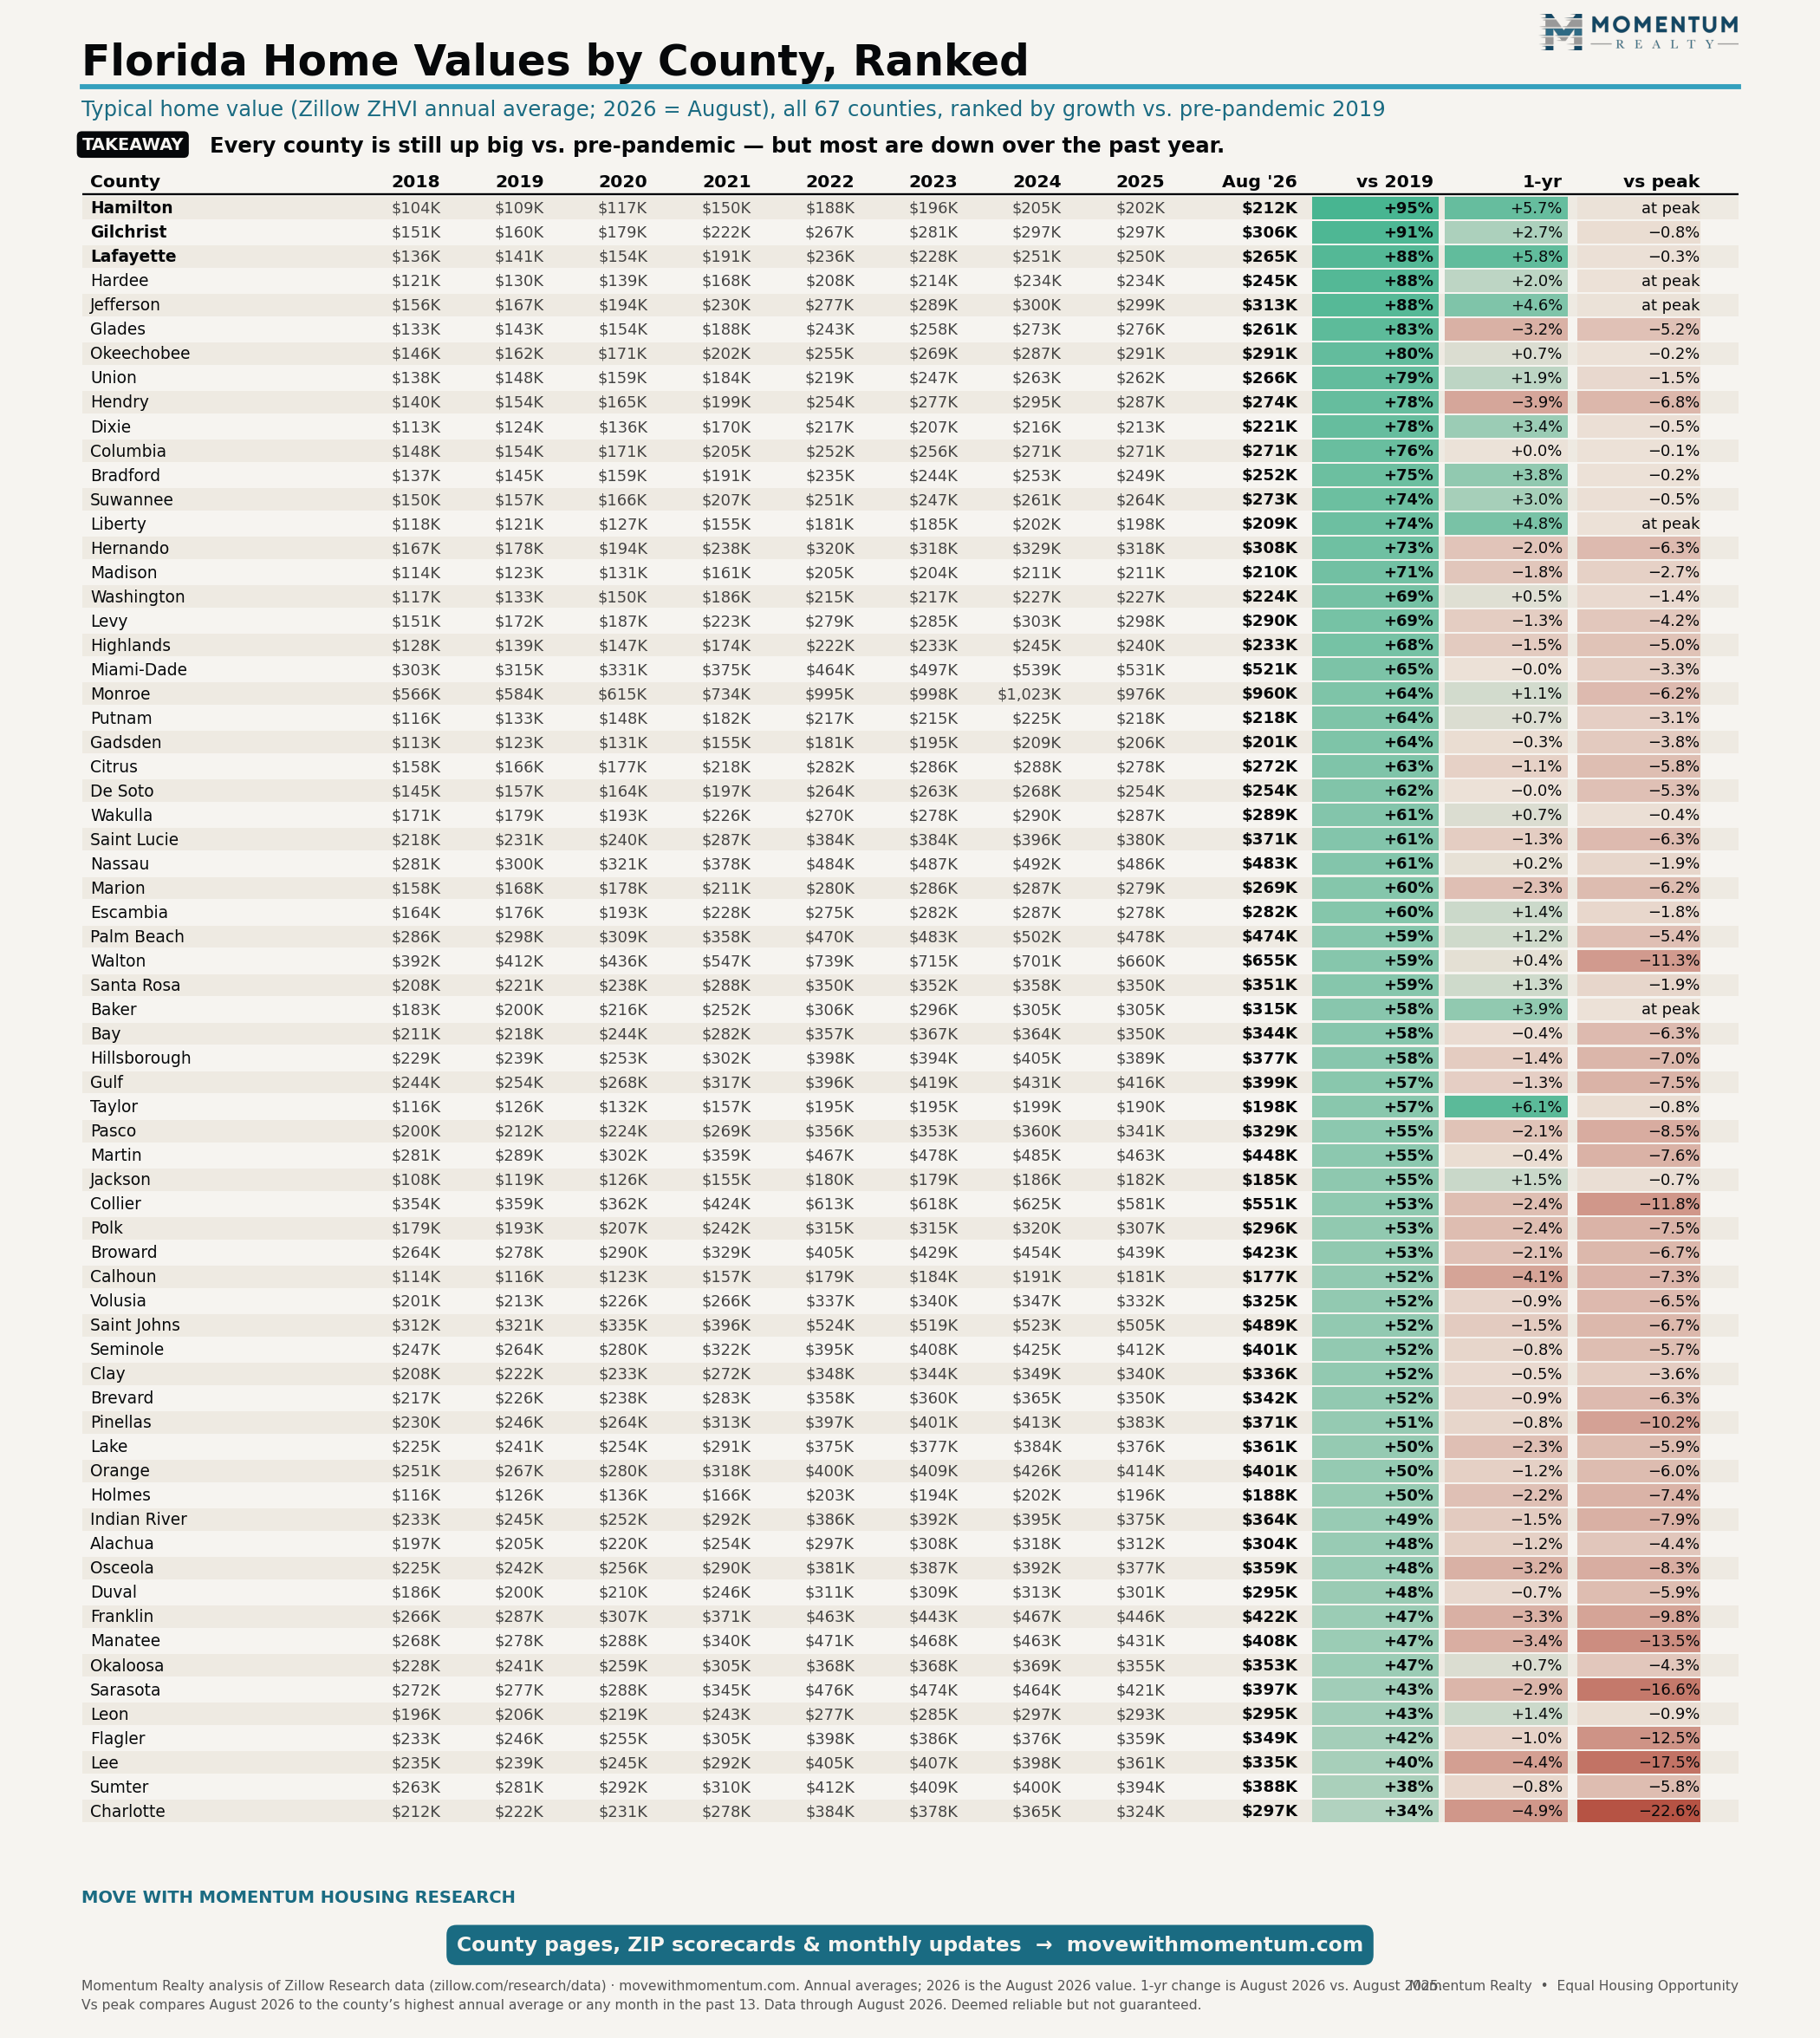
Chart 9 — The 14-year view
In one sentence: Zoom out and the correction nearly disappears — the median Florida county has gained 156% since 2012, and not one of the 67 counties is up less than 83%.
Key facts
- Median county growth since 2012: +156%.
- Range: +83% (Monroe, measured from 2016) to +278% (Hendry County).
- The 14-year gain dwarfs the 2025–26 correction by an order of magnitude.
Why this chart exists
Every month of correction coverage — including ours — risks losing the denominator. This table restores it. A household that bought the median Florida county home in 2012 has seen its value multiply roughly 2.6×; even in the hardest-hit markets, long-term owners retain enormous equity. The current decline is real and worth measuring precisely, which is what the rest of this page does; it is also, on a 14-year axis, a wiggle at the end of a very large move.
Interpretation — what drove 14 years of gains
Three regimes stack on top of each other: the 2012–2019 recovery from the foreclosure-era undershoot (Florida was among the cheapest large-state markets in America in 2012); the 2020–2022 pandemic migration boom, which compressed a decade of demand into two years; and the 2023–2026 era of high rates and high carrying costs now giving part of the second regime back. Hendry's +279% and the broad inland outperformance mostly reflect the first regime's low starting points — the cheapest 2012 markets had the most room to normalize.
The equity cushion and why it matters
This accumulated equity is the structural reason the correction has produced a seller strike instead of a foreclosure wave: owners who can sell at a large lifetime gain — or simply wait — do not become forced sellers. It is the single biggest difference between 2026 and 2008, and it shapes everything else on this page, from inventory withdrawal (Chart 2) to the shallow ZIP distribution (Chart 4).
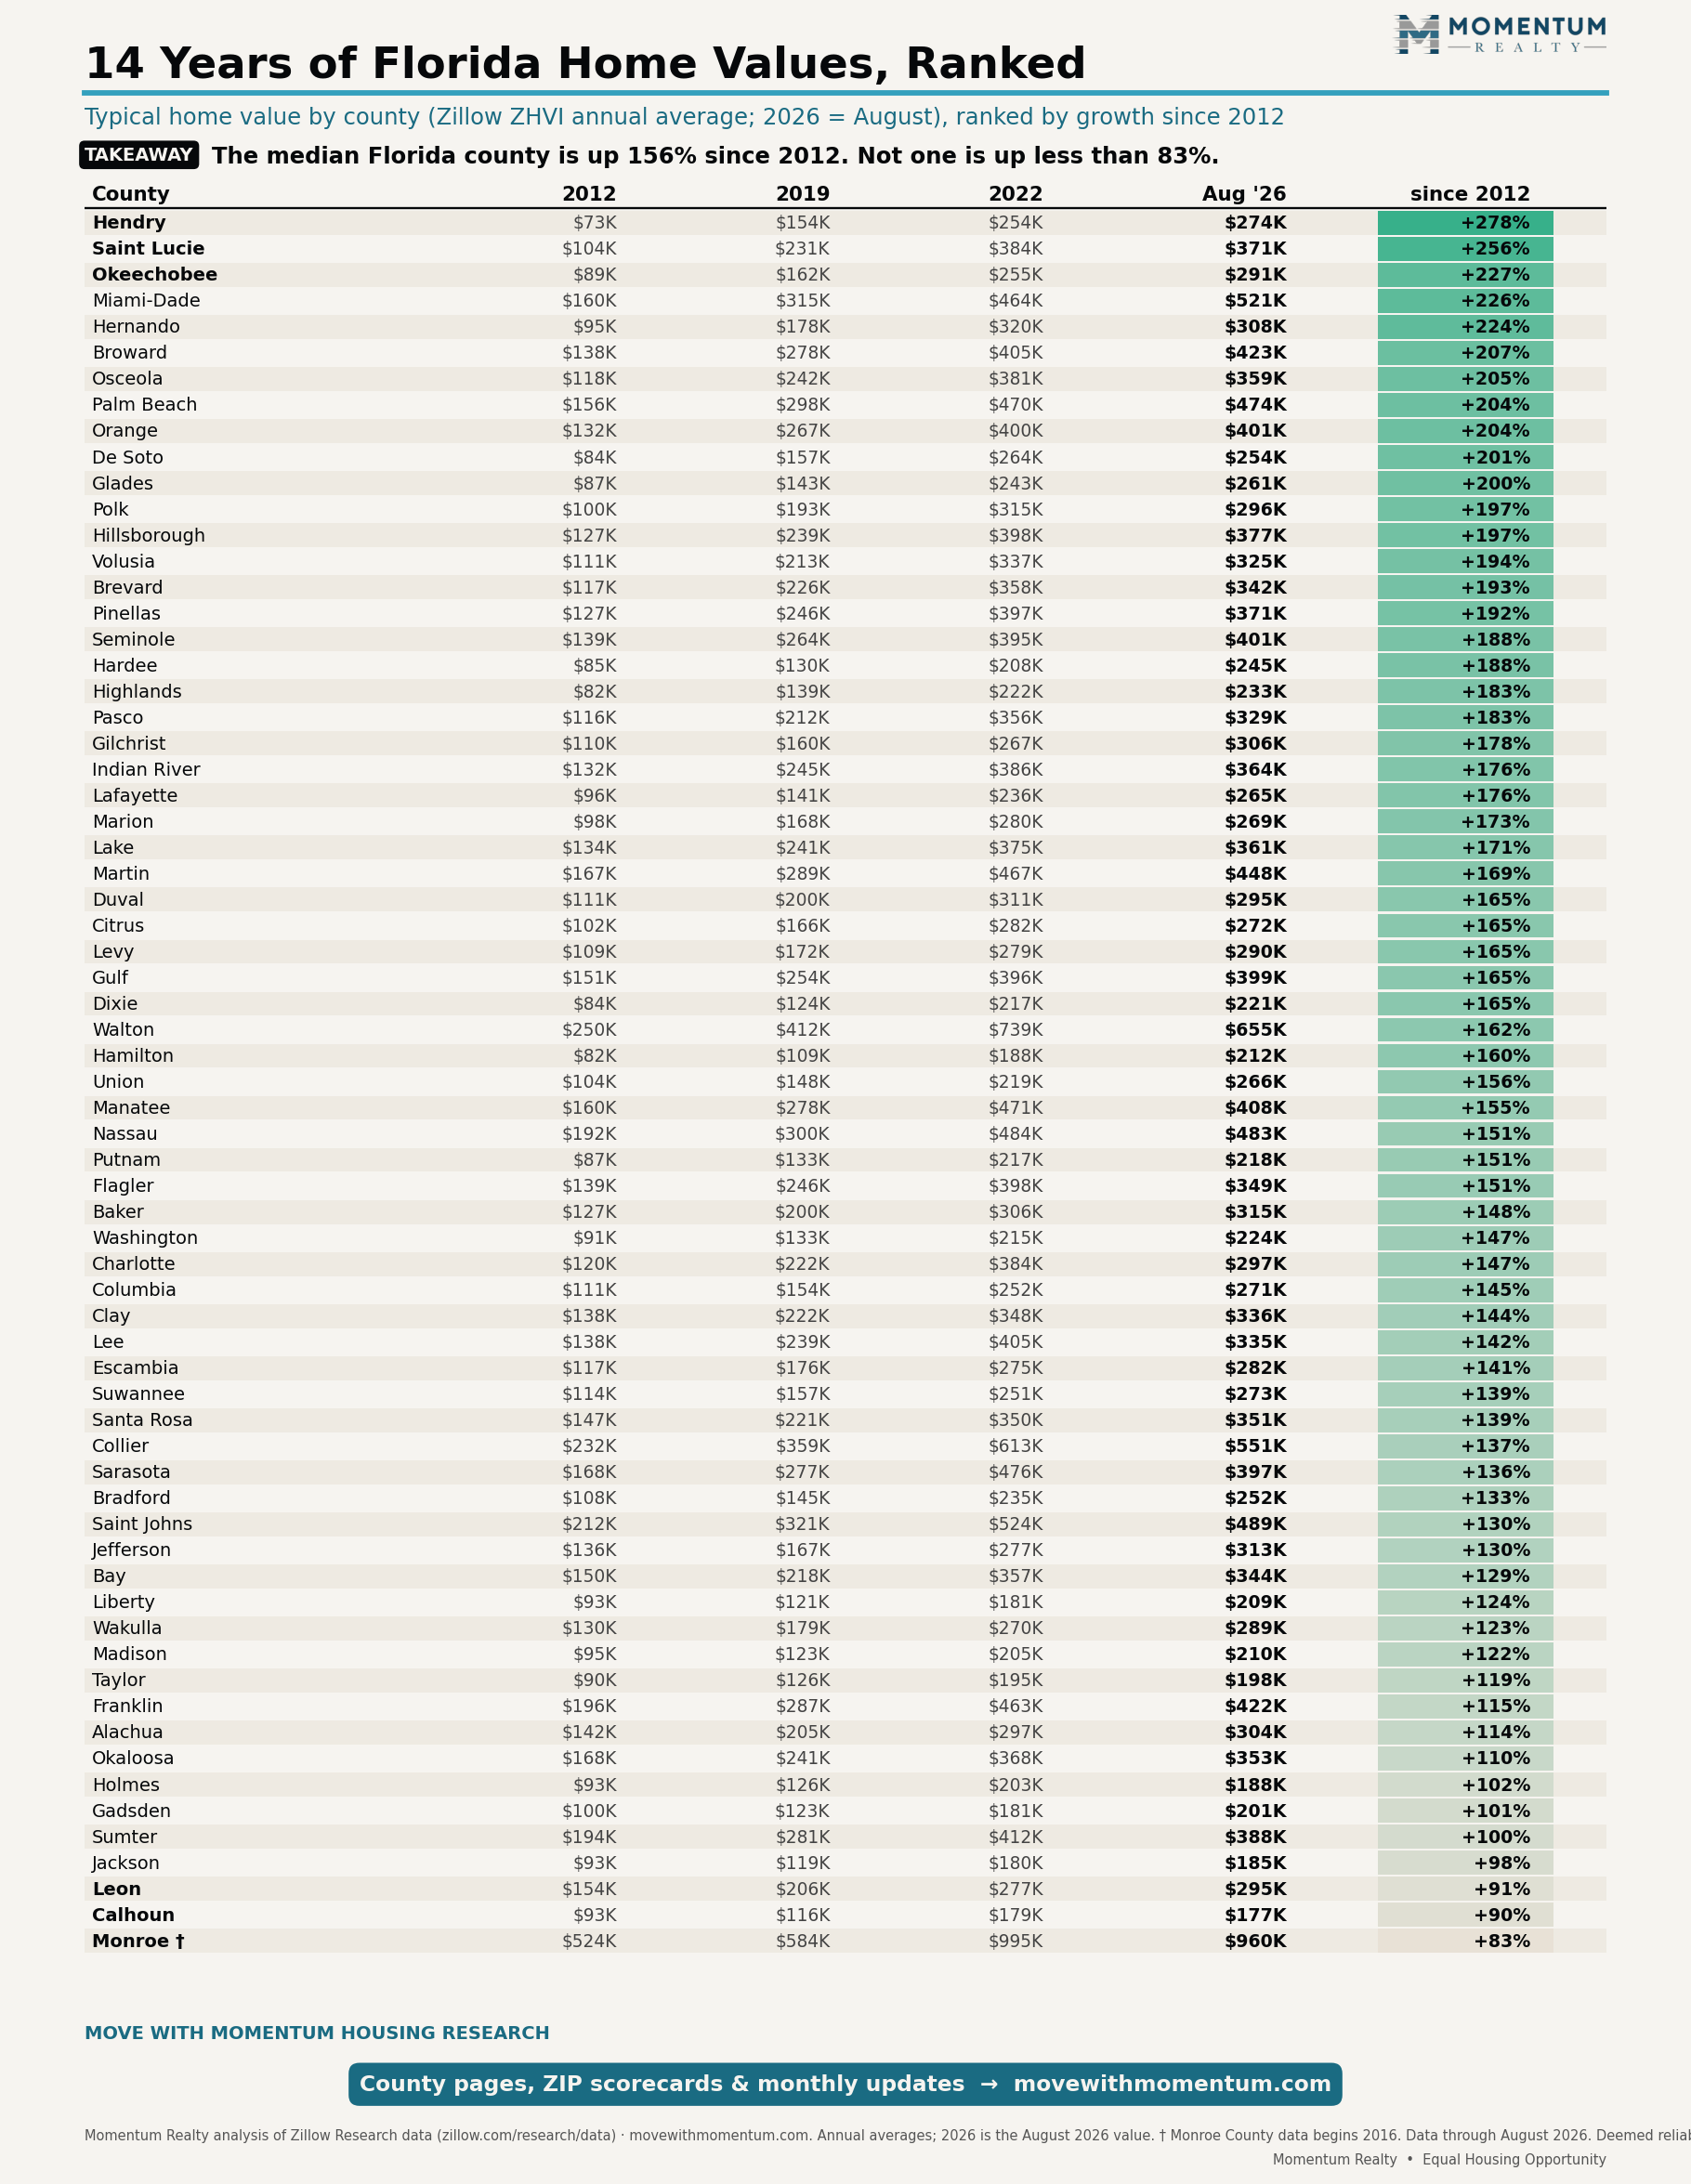
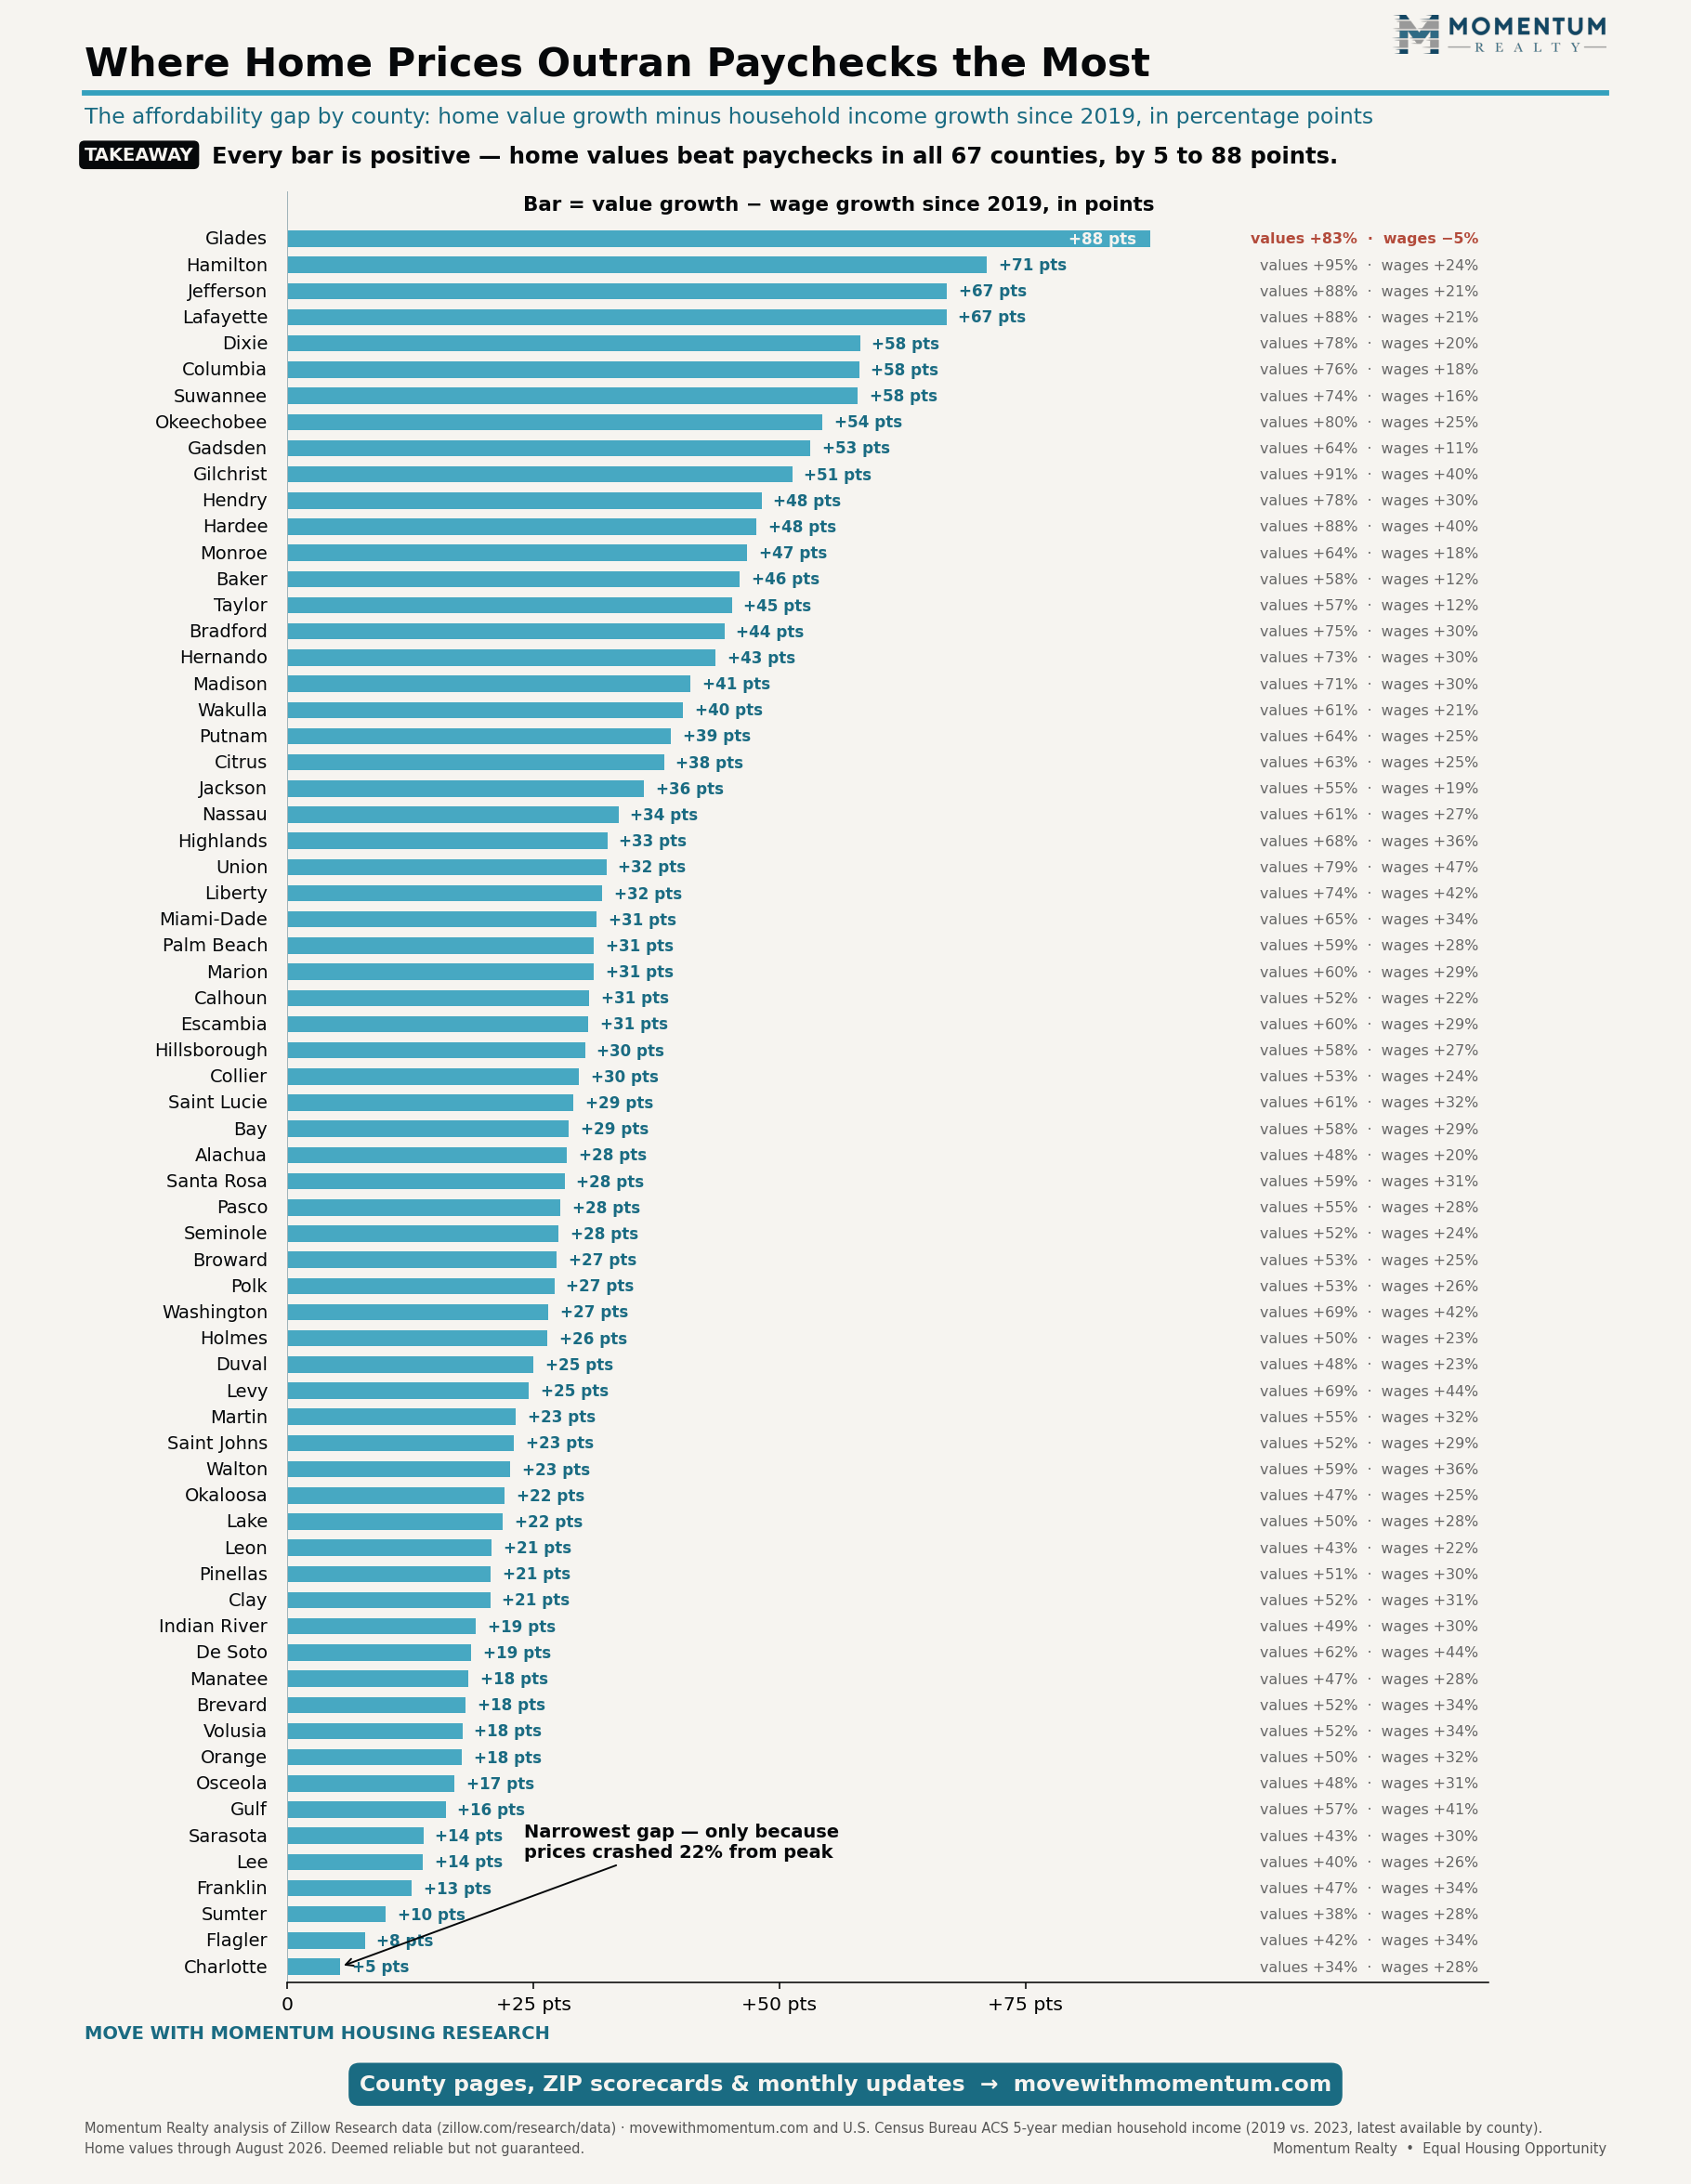
Chart 10 — Where home prices outran paychecks the most
In one sentence: In zero of Florida's 67 counties did household incomes keep pace with home values since 2019 — the affordability gap is the correction's root cause, and it has only partially closed.
Key facts
- Statewide since 2019: home values +54.7%, median household incomes +28.7% (Zillow ZHVI; Census ACS 5-year, 2019 vs 2023).
- Counties where incomes kept pace: 0 of 67.
- Widest gap: Glades County, 88 points (incomes −5%, values +83%). Narrowest: Charlotte, 5.4 points, only because prices fell 23% from peak.
- Union County posted Florida's fastest income growth (+47%) and still lost ground to its housing market (+79%).
Findings — what the data shows
We ranked all 67 counties by home-value growth minus household-income growth since 2019. Every county is positive — every one. The extremes tell the story: in Glades County incomes actually fell while values nearly doubled; in Union County the fastest wage growth in Florida still couldn't keep up. And the only county that came close to parity, Charlotte, got there by crashing — its narrow gap is a symptom of correction, not of health.
Interpretation — why this is the master variable
Housing markets can detach from incomes temporarily — migration surges, cheap credit, and investor flows all did that work in 2020–2022 — but payments are ultimately made out of paychecks. When the payment-to-income ratio stretches far enough, demand thins from the bottom up: first-time buyers exit, then move-up buyers lose their trade-up math, and the market is left to cash-rich segments (which is exactly the segmentation visible in Charts 5 and 7). The 2025–26 correction is this constraint asserting itself. The gap closing from both directions — modest price declines plus continuing wage growth — is the most plausible non-crash path back to a functioning market, and this chart is how we will measure that progress annually as new ACS data lands.
A note on measurement
Income data is Census ACS 5-year (latest: 2023, in 2024 inflation terms), which lags the market; value growth is measured through August 2026. If anything, the lag understates current incomes modestly — and the conclusion survives any plausible adjustment, because the gaps are measured in tens of points, not decimals.
Momentum Buyer Power Index™
In one sentence: A 0–100 score of how strongly current conditions favor buyer negotiation in each county, computed from five observable market inputs — this release's statewide leaders are Manatee (75), Pinellas (74), and Lee (72); the tightest markets are Hamilton (13), Jefferson (25), and Leon (27).
Findings: the index is an equal-weight percentile-rank composite of price-cut share, days on market, inventory change, drawdown from peak, and 1-year value change across all 67 counties. The Gulf Coast correction markets dominate the top of the table; rural North Florida's record-high markets hold the bottom. Every county's score is in the explorer table (sortable, and every county links to its Data Terminal) and the release dataset.
Interpretation: a high score describes conditions historically associated with buyer leverage — many repricing sellers, long marketing times, growing supply — not a prediction that prices will fall further or a recommendation to buy or wait. It is recomputed every release, so scores shift as markets do. Full formula in the research notes; definition in the glossary.
What changed since last month?
The biggest movers in this release (Zillow August data), compared with the August 24 release (July data):
- Direction: the statewide typical value rose 0.10% to $390,638, the first monthly gain since March, after four small declines. On Zillow’s revised series July ($390,251) was the low of the correction.
- Breadth: ZIP codes below their year-ago value fell from 75% to 66% (527 of 801); counties below year-ago fell from 46 to 41 of 67.
- Price cuts: eased for a fifth straight month (25.4% in March → 24.2% in August), still near one in four.
- Largest 1-yr decline: Charlotte County, −4.9%, also the deepest below peak (−22.6%).
- Largest 1-yr gain: Taylor County, +6.1%.
- Record highs: 5 counties (Hamilton, Jefferson, Liberty, Baker, Hardee).
- Charts that moved most: Chart 1 (first uptick since March), Chart 4 (breadth improved to 66%) and Chart 7 (Palm Beach split widened to 25 points).
Every release ships a versioned dataset (release-2026-09.json). Future releases compare against it automatically, so this section will always show precise month-over-month deltas.
Frequently quoted statistics
The numbers most often cited from this page — each button copies the statistic with attribution attached.
For reporters
Suggested attribution: “Momentum Realty analysis of Zillow Research data — movewithmomentum.com” (attribution and data dates are embedded in every image).
Ready quote (draft, pending Jon’s sign-off): “August’s uptick says Florida prices have stopped falling for now, not that they’ve turned. The floor is still being held up by sellers pulling listings, not by buyers coming back.” — Jon Brooks, housing analyst & co-founder, Momentum Realty (former real estate investment banker; B.S. Finance, Virginia Tech).
The numbers most stories need: $390,638 statewide value (+0.10% in August, first gain since March; −1.1% YoY) · inventory −12.2% YoY · price cuts 24.2% (1 in 4) · 66% of ZIPs declining · 41 of 67 counties down · zero counties where wages kept pace since 2019.
Assets: full media kit (ZIP: 11 charts + 5 social squares + brief + writeups) · high-resolution PNGs under every chart above · machine-readable release dataset. Custom cuts (county, metro, ZIP) on request — usually same-day.
Contact: jon@movewithmomentum.com · interviews, background, and data verification welcome.
Embed these charts
Bloggers and publishers: copy the snippet below any chart to embed it. The image stays current at this URL and credit is built in. Square (1080×1080) versions for Instagram and LinkedIn are in the same folder with an sq- prefix.

All 67 Florida counties · ~900 ZIP codes · updated monthly. Explore county scorecards, ZIP rankings, and the market map, or search homes with a Momentum agent.
Methodology
Statewide values are population-weighted averages of county-level Zillow Home Value Index (ZHVI) figures across all 67 Florida counties; 2020–2024 points are annual averages and 2025–2026 points are monthly. Inventory and price-cut shares are Zillow Research county series (price-cut share weighted by county active inventory). Listing metrics (days on market, active/new listings, price-reduced share) are Realtor.com Research monthly county data. ZIP-level figures cover ZIP codes with population over 5,000 (Census ACS). The scenario range in Chart 1 is an illustrative band, not a prediction: no one can guarantee future prices. All information is deemed reliable but not guaranteed and speaks only as of the dates shown.
Statewide aggregation
Florida has no single "statewide home value" in the raw data — we construct it. Each month we take the county-level Zillow Home Value Index (ZHVI, all-homes, smoothed, seasonally adjusted) for all 67 counties and compute a population-weighted average using Census county population as weights. Population weighting means the statewide figure represents the housing experience of the typical Floridian rather than the typical acre: Miami-Dade influences the number ~400× more than Lafayette County. An unweighted average would run several percent lower and overstate rural markets. Historical points for 2020–2024 are calendar-year averages of the same construction; 2025–2026 points are monthly.
Change calculations
Year-over-year change compares each series to the same calendar month one year prior (no interpolation). "Vs. 2019" compares August 2026 to the county's 2019 annual average. "Vs. peak" compares August 2026 to the maximum of (a) every annual average since 2012 and (b) every month in the trailing 13 — a deliberately conservative peak definition that cannot be gamed by a single anomalous month. "At peak" is declared only when the current value is within $1 of that maximum. Growth ranks order all 67 counties by vs-2019 growth.
Inventory, cuts, and listing metrics
Active inventory is Zillow's for-sale inventory count summed across counties; the year-over-year figure compares matching months. Price-cut share is Zillow's county-level share of active listings with a price reduction, weighted by county active inventory (so the statewide share reflects where the listings actually are). Days on market and new-listing counts are Realtor.com Research monthly county data, used unmodified. These two vendors measure slightly different listing universes; we never mix them within a single statistic.
ZIP methodology
ZIP analysis covers the 801 Florida ZIP codes with Census population above 5,000 — the threshold removes PO-box and industrial ZIPs whose thin housing stock produces unstable indexes. Each ZIP's change is computed from its own ZHVI series; the "share declining" statistic counts ZIPs below their value in the same month a year earlier.
Income comparison
County median household income is Census ACS 5-year (table B19013), 2019 vintage vs. 2023 vintage (latest available), in current dollars. The affordability gap is county value growth (2019 annual average → August 2026) minus county income growth (2019 → 2023 ACS), in percentage points. The timing mismatch (values measured 30 months past the latest income data) is disclosed wherever the statistic appears; it biases the gap upward by at most a few points — immaterial against 30–90 point readings.
Assumptions and known limitations
ZHVI is an estimated index, not a ledger of transactions: it is smoothed, seasonally adjusted, and revised by Zillow as new data arrives — our charts adopt revisions at the next monthly release. Small-county series are volatile (several rural counties trade fewer than 20 homes a month). County assignment follows Zillow's geography. The Chart 1 scenario band is illustrative context, not a forecast, and nothing on this page predicts or guarantees future prices. Every figure we compute ourselves is labeled "Momentum calculation" and is reproducible from the release dataset.
Research notes
Limitations: ZHVI is a smoothed, seasonally-adjusted estimate of the typical (35th–65th percentile) home value and is revised by Zillow as new data arrives; small-county and ZIP-level series are noisier than state figures. ACS income is a 5-year estimate with a publication lag (latest: 2023). “Vs peak” uses each county’s highest annual average or any month in the trailing 13 — a conservative definition that can differ from single-month peaks.
The Chart 1 scenario band is illustrative, not a forecast. Definitions: “declining” = below the same month one year earlier; population weighting uses Census county population; ZIP analysis covers ZIPs over 5,000 population (801 of them). Known caveats: price-cut share is inventory-weighted and can move when inventory mix shifts; county names follow Zillow’s conventions.
Revisions: when Zillow revises history, our charts adopt the revised series at the next monthly release; material changes are noted in the version history. Anything labeled “Momentum calculation” is computed by us from the named public sources and is reproducible from the release dataset.
Version history
- v2.5 — September 26, 2026: Release on August Zillow and Realtor.com data: the statewide typical value rose 0.10% to $390,638, the first monthly gain since March, after four small declines (July, at $390,251 on Zillow’s revised series, was the low of the correction). Year-over-year decline narrowed to 1.1%. Breadth improved again (66% of ZIPs below year-ago, from 75%; 41 of 67 counties, from 46). Inventory fell another 2.4% to 175,121 (−12.2% YoY); price cuts eased a fifth straight month to 24.2%. Palm Beach intra-county split widened to 25 points. New chart set (
media-kit-2026-10). Figures reflect Zillow’s routine historical revisions. - v2.4 — August 24, 2026: Release on July Zillow and Realtor.com data: the statewide decline all but stopped — July moved −0.01% to $393,034, a fourth straight cycle low but the smallest monthly move of the correction, and the ninth consecutive month inside ±0.2%. Year-over-year decline narrowed to 1.8%. Breadth improved sharply (75% of ZIPs below year-ago, from 83%) while the three-year picture worsened (68% of ZIPs below their 2023 value, from 65%). Inventory fell another 2.6% to 179,377 (−12.8% YoY); price cuts eased a fourth straight month to 24.3%; counties at record highs thinned from 9 to 5. New media kit (
media-kit-2026-09), release datasetrelease-2026-09.json, mortgage-rate reference updated to the August 20 PMMS (6.65%). Figures reflect Zillow’s routine historical revisions. - v2.3 — August 10, 2026: August release on June Zillow data: statewide value extended to a third consecutive monthly decline and a new cycle low ($392,895); price-cut share eased to 24.5% after peaking near 25.4% in March; inventory decline steepened to −12.3% YoY. Media kit
media-kit-2026-08, release datasetrelease-2026-08.json. - v2.2 — July 7, 2026: Launched the Momentum Buyer Power Index™ (0–100 percentile-rank composite, all 67 counties — in the explorer table, release dataset, glossary, and County Terminals). Added the Florida Housing Scoreboard to the Command Center. Restructured chart essays to separate labeled Findings from Interpretation. County explorer rows now link to each county's Data Terminal.
- v2.1 — July 7, 2026: Research-publication expansion: 300–600-word analytical essays before every chart (what happened / why / historical context), About This Research, Our Process, How to Read These Charts, 16-term anchored glossary, research timeline 2020–2026, common misconceptions, reporter Q&A, misunderstood-statistics guide, research-paper-grade methodology (aggregation, change math, ZIP and income methods, limitations), formal references, county-vs-county and ZIP-vs-ZIP comparison tools, research archive, ~20 additional FAQs, expanded author biography and schema. No data changes.
- v2.0 — July 6, 2026: Page redesigned: command center, executive summary cards, key takeaways, AI summary, sticky contents, per-chart source/citation/download blocks, county explorer table, frequently-quoted statistics, reporters section, versioned release dataset (
release-2026-07.json). Added the values-vs-incomes chart (Chart 10) with county ACS wage overlay and the ranked county tables (Charts 8–9). Fixed the county lookup’s vs-2019 / vs-peak / rank fields (now served as JSON). May 2026 Zillow data. - v1.0 — June 2026: First monthly release: statewide trend, seller-strike scatter, price-cut, ZIP, and map charts with April 2026 data.
About this research
In one sentence: Move With Momentum Housing Research is Momentum Realty's data desk — built to give Florida buyers, sellers, and journalists the market analysis we wished existed, from public data anyone can verify.
Why we built it. Most Florida market commentary is either national research with Florida as a footnote, or local opinion with no data at all. We work these markets daily as a brokerage, so we built the reference we needed: every county, every ZIP, every month, with sources and methods shown. The research is funded by Momentum Realty's brokerage business; we sell no data, take no data-vendor sponsorships, and the numbers say what they say — this month they say prices are falling, which is not a message a brokerage would invent.
Why Zillow Research data. It is public (anyone can verify us at zillow.com/research/data), monthly, covers every county and ZIP we need, maintains consistent methodology across geographies, and publishes revisions transparently. Why Realtor.com Research. Its listing-side metrics (days on market, new listings) come directly from listing feeds and complement Zillow's value-side indexes. Why Census ACS. It is the only income source consistent across all 67 counties. What is original: every aggregation, weighting, ranking, gap calculation, and chart — labeled "Momentum calculation" — plus our proprietary MLS-derived metrics (Pending Ratio™, delisting data) published on the Live Tracker.
Data vs. interpretation. Chart sections separate Findings (what the source data shows) from Interpretation (our analytical read) — named framings like the "seller strike" belong to the second category, and the underlying numbers are always downloadable so you can disagree with us. Cadence. This page updates monthly when Zillow publishes (typically mid-month); the Live Tracker updates daily; datasets are versioned monthly and old releases stay online. Corrections are noted in the version history.
Our process
- 1 · Ingest: county and ZIP source files are pulled from Zillow Research, Realtor.com Research, and Census APIs on release day.
- 2 · Clean: geographies are matched to our county/ZIP registry; population weights attached; thin ZIPs (<5,000 population) excluded.
- 3 · Validate: every headline statistic is recomputed independently from the raw files and cross-checked against the prior release before anything publishes; anomalies are traced to source revisions or rejected.
- 4 · Compute: weighted aggregates, growth series, rankings, and gap metrics are generated by version-controlled scripts — the same code every month.
- 5 · Chart: all graphics are generated programmatically from the computed data (no hand-edited numbers), with sources and dates embedded in each image.
- 6 · Publish: the page, media kit, and machine-readable release dataset ship together.
- 7 · Version: each release is archived as
release-YYYY-MM.json; the next release diffs against it automatically.
How to read these charts
ZHVI ("typical home value"): Zillow's estimate of the value of the typical home (35th–65th percentile of all homes, not just those that sold), smoothed and seasonally adjusted. It moves more slowly and reliably than median sale price and is not distorted by which homes happened to sell — see frequently misunderstood statistics.
Inventory: the count of active for-sale listings; falling inventory is bullish only when prices are rising — falling alongside falling prices signals seller withdrawal. Price cuts: the share of active listings that have taken an asking-price reduction; a leading indicator that turns before values do. DOM: median days on market for active listings — higher means slower. Population weighting: statewide numbers weight counties by residents, so they describe the typical Floridian's market.
Seasonality: listings and cuts follow a spring-peak calendar; ZHVI is seasonally adjusted but listing metrics are not, so compare listing metrics year-over-year, not month-over-month. County vs. ZIP: county figures average away intra-county splits (Chart 5) — always confirm at the ZIP or segment level before acting.
Glossary
- ZHVI (Zillow Home Value Index)
- A smoothed, seasonally-adjusted estimate of the typical home value in a geography, covering the 35th–65th percentile of all homes — sold or not. The value backbone of this page.
- Typical home value
- Shorthand for the ZHVI level: what a mid-market home is worth, as distinct from the median price of homes that happened to sell.
- Median sale price
- The middle price among closed sales in a period. Sensitive to the mix of what sold — a luxury-heavy month raises it with no change in values.
- Active inventory
- The number of homes listed for sale at a point in time. Rises when listings outpace sales and delistings.
- Price-cut share
- The percentage of active listings that have reduced their asking price at least once. A leading indicator of value changes.
- Days on market (DOM)
- How long the median listing has been for sale. Longer DOM = slower market, more buyer leverage.
- Months of supply
- Inventory divided by the monthly sales pace: how long it would take to sell everything listed if nothing new arrived. Roughly 5–6 months is balanced.
- Population-weighted
- An average in which each county counts in proportion to its residents, so statewide figures describe the typical Floridian's market rather than the typical county.
- Peak value
- On this page: a county's highest annual-average value since 2012 or highest month in the trailing 13, whichever is greater. "Vs. peak" measures the drawdown from it.
- Fresh cycle low
- A value below every other reading of the current correction — evidence the decline is ongoing rather than bottomed. Florida printed a string of them through July 2026 (the low on Zillow’s revised series) before August’s uptick.
- Seller strike
- Our term for discretionary sellers withdrawing or withholding listings rather than cutting price — visible as inventory falling while prices also fall (Chart 2).
- Delisting Rate
- Listings withdrawn, expired, or canceled per 100 new listings in a month, measured per MLS on the Live Tracker. Includes routine relist churn; read the trend against its own baseline.
- Momentum Pending Ratio™
- (Pending + under-contract listings) ÷ (active + pending + under-contract): the share of the for-sale market a buyer has already claimed. Measured daily from MLS records; higher = tighter.
- Seller Capitulation Rate™
- The forthcoming churn-adjusted version of the Delisting Rate: delistings that do not relist within 90 days, per 100 new listings — sellers who actually gave up.
- Momentum Buyer Power Index™
- An equal-weight percentile-rank composite (0–100) of price-cut share, days on market, inventory change, drawdown vs peak, and 1-year value change across all 67 counties. Higher = conditions historically associated with more buyer negotiating leverage. Descriptive, not predictive.
- Negative equity
- Owing more on a mortgage than the home is worth. Rare in Florida today because values remain 35–93% above 2019 in every county — the key structural difference from 2008.
- Affordability gap
- Home-value growth minus household-income growth over a period, in percentage points (Chart 10). Positive in all 67 counties since 2019.
Research timeline: how Florida got here
Common misconceptions
"Inventory is falling, so demand must be back." No. Inventory falls when listings leave faster than they arrive — and listings can leave by selling or by quitting. Florida's 2025–26 inventory decline came with falling prices and rising cut-shares: that combination is seller withdrawal, not absorption (Chart 2).
"A price cut means the home was overpriced." Not necessarily. In a market falling ~3% a year, a correctly-priced January listing is overpriced by June through no error of the seller. Cut-share rising market-wide measures the market moving under sellers, not an epidemic of bad pricing.
"The county is down 3%, so my home lost 3%." County averages conceal 8–20 point spreads across ZIPs and segments (Charts 5, 7). Older condos and entry-level segments are repricing far faster than single-family and luxury segments in the same county.
"Zillow says values fell, but median sale prices rose — someone's wrong." Neither. Median sale price reflects which homes sold (mix); ZHVI estimates the value of all homes. When entry-level sales collapse, the median rises even as every home loses value. See below.
"A correction means a crash is coming." The defining features of 2008 — negative equity, forced selling, credit contagion — are largely absent: every county remains 35–93% above 2019, and the equity cushion converts distress into patience (Chart 9). The data supports a grinding repricing; it does not currently support a crash narrative. We publish the leading indicators monthly so readers can watch that assessment get tested.
Questions reporters ask us
Is Florida crashing? No — correcting. Statewide values are down 1.8% year over year to a fresh cycle low; the median county sits 5.3% below peak while remaining far above pre-pandemic levels. "Broad, shallow, and led by identifiable segments" is the accurate description.
Why are inland counties outperforming? Affordability migration: they are Florida's least expensive markets, and demand priced out of the metros flows to them. Twelve rural counties are at record highs — the same force pushing coastal prices down pushes inland demand up.
Will rate cuts fix this? They would help payments, but the gap is bigger than rates: values outgrew incomes by ~30 points since 2019 even before rates rose. A one-point rate cut restores roughly a tenth of the lost affordability; watch price cuts and the pending ratio for whether it changes behavior.
Why are condos weaker? Fixed cost shocks against small denominators: insurance repricing plus post-Surfside reserve and inspection requirements add hundreds of dollars monthly, which is devastating math at $138K and irrelevant at $1M (Chart 7).
What's driving the Gulf Coast declines? The stack: the state's biggest pandemic overshoot, Hurricane Ian's landfall zone, the insurance-cost epicenter, and heavy retiree/second-home exposure — the most discretionary demand in a downturn (Charts 6, 8).
What should we watch next month? Three numbers: the price-cut share (does the five-month climb continue?), inventory (do withdrawn sellers return?), and our MLS delisting data on the Live Tracker (is the seller strike intensifying?).
Frequently misunderstood statistics
Five numbers that get conflated in housing coverage — they measure different things and routinely move in different directions:
- Median sale price — the middle closed transaction. Moves with mix: if luxury keeps selling while entry-level stalls, it rises in a falling market. Fine for "what are buyers paying," misleading for "what are homes worth."
- Average sale price — same mix problem, plus distortion from outliers. A handful of $20M closings moves a county average; avoid it for trend analysis.
- ZHVI / typical value — a modeled estimate of all homes' value, sold or not. Immune to mix; the right tool for "are values rising or falling," which is why this page is built on it.
- List price — a seller's opening claim, not a market fact. Useful mainly through its changes (price cuts) and its spread to sale price.
- Sale-to-list ratio — what fraction of asking sellers actually got; measures negotiability. Falls when buyer leverage rises even if headline prices look flat.
Rule of thumb: mix-sensitive statistics (medians, averages) answer "what sold?"; index statistics (ZHVI) answer "what changed?" A market where the median sale price rises while ZHVI falls is not a contradiction — it is a market where the bottom stopped transacting.
Common questions
Are Florida home prices still falling in 2026?
Not in August. The population-weighted typical value was roughly flat from December 2025 through March 2026, slipped slightly from April through July, then rose 0.10% in August 2026 to $390,638, the first monthly gain since March. Values are still 1.1% below a year earlier, and 66% of ZIP codes with population over 5,000 were below their year-ago value as of August 2026, down from 75% in July.
Why did prices pause over the winter, then slip again?
The evidence points to supply withdrawal rather than a demand recovery. Active inventory is down 12.2% from a year ago, with the biggest declines in the counties where prices fell most — consistent with discretionary sellers delisting rather than cutting further. When spring re-listers returned at higher asking prices, price cuts climbed back to 1 in 4 listings and values slipped from April through July before August’s small uptick.
Which parts of Florida are still rising?
As of August 2026, most of the counties with year-over-year gains are smaller inland North Florida counties (per Zillow ZHVI), while several higher-priced coastal ZIP codes in Southeast Florida also rose. See Charts 4 and 5 for the distribution.
How often is this page updated?
Monthly, when the source datasets refresh. Each chart carries its own data-through date.
Is this like 2008?
The data says no. In 2008 Florida values round-tripped their boom amid forced selling and mass negative equity. Today every county remains 35–93% above 2019, the median county is 4.8% off peak, and the equity cushion turns potential distress into patience — sellers withdraw instead of dumping. The correction is real; the crash mechanics are absent.
What role does insurance play?
A central one. Property insurance premiums raise the cost of ownership independent of price, hitting coastal counties and older condos hardest — the exact geographies and segments falling most. In payment terms, insurance increases act like a permanent rate hike concentrated on specific properties.
Why do you use Zillow's index instead of median sale prices?
Median sale prices move with the mix of what sold — a month where entry-level sales stall makes the median rise even as values fall. ZHVI estimates the value of all homes, sold or not, so it isolates actual value change. We use Realtor.com data where listing-side facts (DOM, new listings) are the question.
Which counties are strongest right now?
By 1-year growth: rural inland North Florida — Lafayette (+7.8%) leads, and 9 rural counties are at record highs. By resilience near peak, 36 of 67 counties sit within 5% of their all-time highs. The county explorer above sorts all 67 by any measure.
Which counties are weakest?
The southwest Gulf Coast: Charlotte (−6.6% year over year, −22.0% from peak), Lee (−5.4%, −17.0%), and Sarasota (−4.3%, −16.0%). These were among the biggest pandemic boomtowns and sit in the insurance-cost and Hurricane Ian recovery zone.
Are investors leaving Florida?
National data shows large investors as net sellers in several Sun Belt metros. Our MLS-based research program is building Florida-specific measurements (cash-buyer share, operator listing behavior); early data shows cash purchases at 25–43% of closings depending on market. Follow the Live Tracker for updates.
What happens if sellers return in the fall?
Inventory would rebuild from withdrawn listings — the "shadow queue." If demand hasn't improved, more supply meeting the same buyers implies renewed pressure on prices; that re-test is precisely what broke the winter floor in April–May. Delisting and relisting data on the Live Tracker will show it first.
Should I wait to buy?
We publish data, not timing advice — prices can move either way from here. What the data does say: negotiability (cuts at 1 in 4, rising DOM) is the strongest since 2020, declines are broad but shallow, and segment choice (Charts 5, 7) matters more than timing the statewide bottom. Talk to a professional about your situation.
Why did values rise 48% in the first place?
Sub-3% mortgage rates, pandemic-era migration into Florida, remote work unlocking location choice, and a decade of underbuilding colliding with two years of compressed demand. The 2020–2022 episode compressed roughly a decade of appreciation into two years; the correction is unwinding part of it.
How do new-construction incentives affect these numbers?
Builders typically cut effective prices through rate buydowns and incentives that don't fully appear in asking prices, so builder-heavy submarkets can be softer than list data suggests. Our MLS research measures builder share of inventory and builder cut behavior — a dedicated tracker is on the roadmap.
What would make you say the market has bottomed?
Sequence, not a single print: price-cut share rolling over first, then inventory stabilizing without withdrawal (sellers staying while listings get absorbed), then the pending ratio rising on the Live Tracker, and finally year-over-year value declines shrinking for several consecutive months. None of the four has happened yet as of this release.
Do rising rents change the picture?
Rents matter through yields: as prices fall and rents hold, gross yields improve, which eventually attracts investor demand and puts a floor under prices. A rent and yield layer is on the research roadmap pending licensing review of rental data in our MLS feeds.
Can I republish these charts and figures?
Yes — with credit: "Momentum Realty analysis of Zillow Research data — movewithmomentum.com." Attribution is embedded in every image, embed codes are provided above, and the underlying dataset is downloadable. For custom cuts, email jon@movewithmomentum.com.
How are corrections handled?
When a source revises history or we find an error, we adopt the fix at the next release and document it in the version history. The versioned datasets mean any figure we've ever published can be checked against the release it came from.
Does Momentum Realty's business bias this research?
The incentive risk runs the other way: a brokerage benefits from optimism, and this page has spent months documenting price declines. The research is funded by the brokerage, uses public data anyone can verify, labels every calculation, and ships its raw numbers. Judge it by reproducibility.
What's the Live Tracker and how is it different?
This page is the monthly deep-dive built on public data. The Live Tracker updates daily from our six licensed MLS feeds with metrics public data can't see — pending ratio, delistings, new-listing flow — per market, never blended. Together they cover both cadences.
Download the data
Researchers should never need to scrape this page. Stable monthly endpoints (treat these as the v0 data API — a documented API is planned):
- release-2026-09.json — this release: headline statistics + all 67 counties (values, growth, peak, inventory, cuts, DOM, income gap). Versioned; prior months stay online.
- counties.json — live county dataset (values, 13-month sparklines, inventory, price cuts, Realtor.com metrics).
- zips.json — ~900 ZIP codes with value history anchors.
- county-yearly.json — annual county values, 2012–2026.
- Media kit (ZIP) — all charts (PNG), social squares, brief, and writeups.
CSV versions: use the “Download data (CSV)” buttons under each chart or in the county explorer (generated in your browser from the release dataset — nothing to install). XLSX cuts available on request. License: republish with credit — “Momentum Realty analysis of Zillow Research data · movewithmomentum.com.”
Research archive
Every monthly release stays online permanently — page, media kit, and dataset.
- September 26, 2026 (current) — Zillow August data · first monthly gain since March: +0.10%, $390,638 · charts in
media-kit-2026-10 - August 24, 2026 — Zillow July data · the decline all but stops: −0.01%, $393,034 · media kit · dataset
- August 10, 2026 — Zillow June data · third straight decline, cycle low $392,895 · media kit · dataset
- July 2026 — Zillow May data · the winter flatline cracks · media kit · dataset
- June 2026 — April data · the winter flatline holds · first release of the monthly tracker (pre-dataset-versioning; figures preserved in the June media kit)
- Releases from September 2026 onward will be listed here automatically, with page snapshots, kits, and datasets.
References
- Zillow Research. "Housing Data" (ZHVI all-homes county and ZIP series; for-sale inventory; share of listings with a price cut). zillow.com/research/data. Accessed September 26, 2026; data through August 2026.
- Zillow Research. "ZHVI Methodology." zillow.com/research.
- Realtor.com Research. "Monthly Housing Market Trends" (county inventory metrics, days on market, new listings). realtor.com/research/data. August 2026 vintage.
- U.S. Census Bureau. American Community Survey 5-Year Estimates, Table B19013 (median household income), 2019 and 2023 vintages. data.census.gov.
- U.S. Census Bureau via FRED. "New Private Housing Units Authorized by Building Permits: 1-Unit Structures for Florida" (FLBP1FH). fred.stlouisfed.org.
- Freddie Mac. Primary Mortgage Market Survey (30-year fixed rate). freddiemac.com/pmms. August 20, 2026 reading: 6.65%.
- Move With Momentum Housing Research. "Florida Housing Market Release Dataset, August 24, 2026" (all Momentum calculations, machine-readable). movewithmomentum.com/data/fl-market/release-2026-09.json.
- MLS-derived metrics (Live Tracker): realMLS, BeachesMLS, Space Coast MLS, DBAAR, Pensacola AoR MLS, Stellar MLS via MLS GRID — aggregate statistics with per-feed attribution. movewithmomentum.com/data/florida-live-tracker.
Move With Momentum Research Hub
Get this report the day it drops
One email a month when the new Florida data lands — the charts, the story, nothing else.
New: Florida Live Tracker — daily Pending Ratio™ & Seller Capitulation Rate™ from MLS records · Florida median home prices by county · County market scorecards · NE Florida market dashboard