
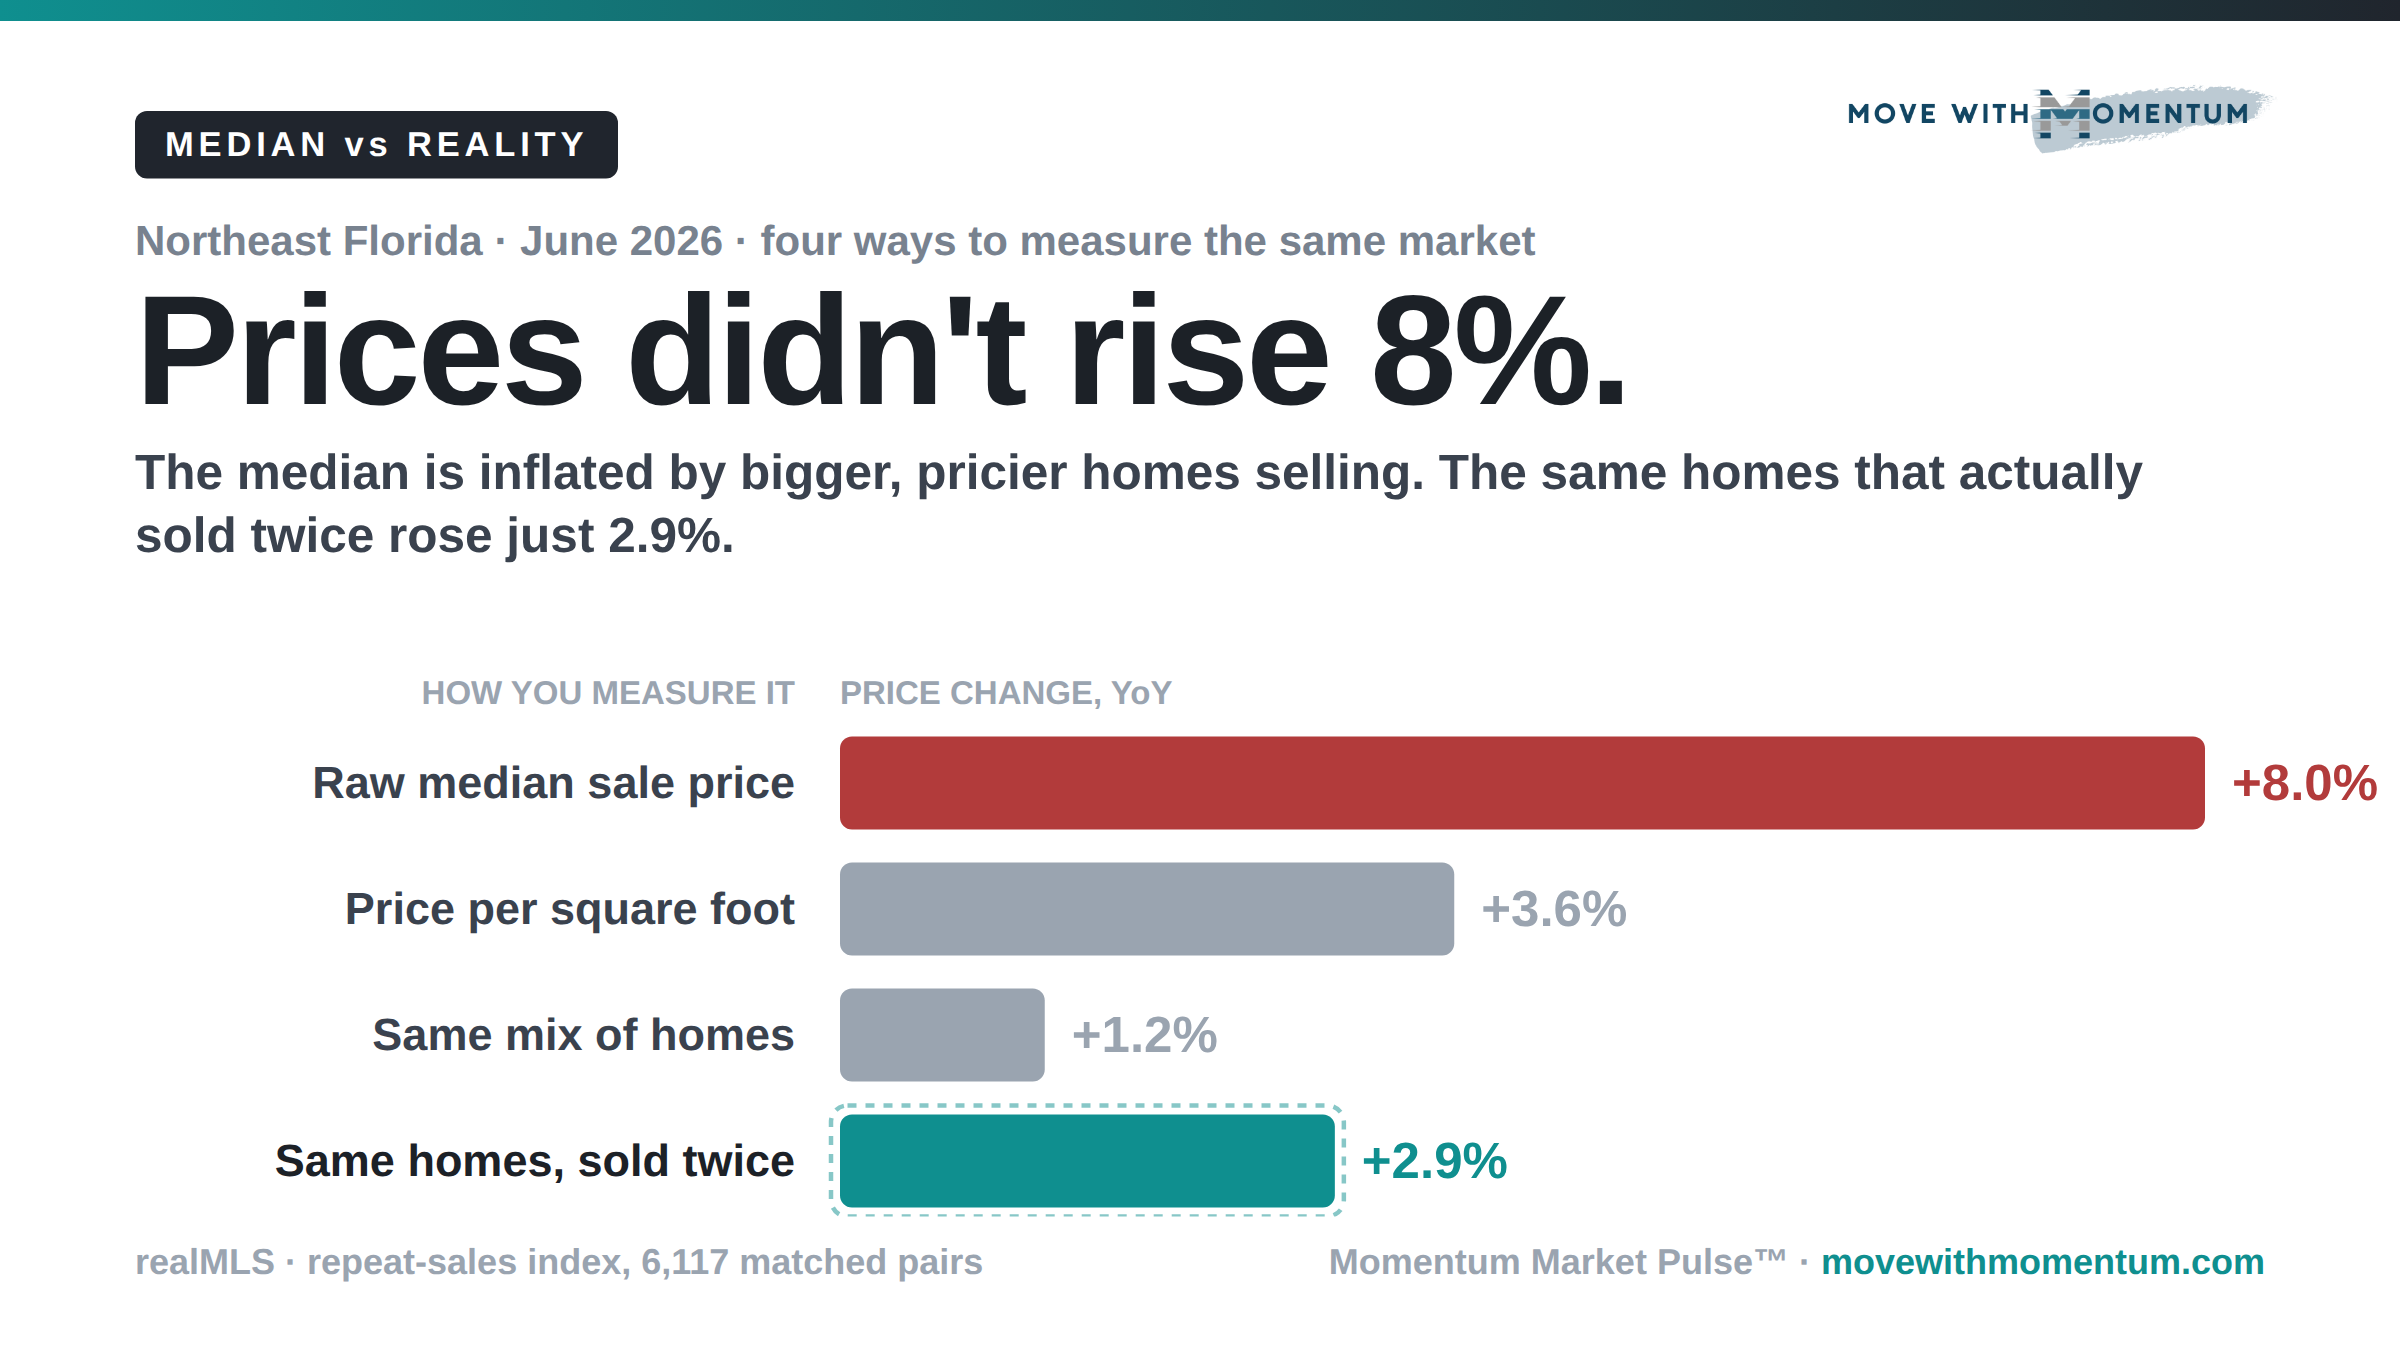
Correction (October 7, 2026): the same-home figure in this post was originally +2.9%, computed from every repeat sale 1–15 years apart — which carried the 2020–22 run-up into a number we then compared with a 12-month median change. Recomputed on short holds only (homes bought 1–3 years before their June 2026 resale; 1,850 single-family pairs), it is +1.7% a year. The point of the piece stands — the +8% median was mostly mix — and the real move was smaller still. Owners who bought 5+ years ago averaged +6.7% a year, almost all of it before 2022.
Before I tell you what the June numbers say, let me tell you what they don't.
You'll read that the typical Northeast Florida home sold for about 8% more than it did a year ago. Take that number with a big grain of salt - because most of the confusion in this market comes down to how price change gets calculated, and the most-quoted method is the worst one.
The median just finds the middle sale in the pile. It doesn't tell you whether any individual home gained value - only what the middle house that happened to sell cost. So when the mix of what's selling shifts toward bigger, pricier homes, the median climbs even when values are flat. And that's exactly what's happening right now: the average home sold this June was 6.5% larger than a year ago, with fewer starter homes (sales under ~$300K fell from 27% to 22% of the market) and more high-end ones ($750K-plus rose from 12% to 15%). Bigger, pricier houses selling makes the "middle" sale look higher - that's not appreciation, that's a change in what got counted.
The honest way to measure it is to watch the same house sell twice - a repeat-sales index. Ignore the mix; just track homes that sold, then sold again. By that method - 1,850 short-hold matched pairs (homes bought 1–3 years ago) - Northeast Florida values are up about 1.7% a year, not 8%.
That's the number I trust, and it quietly reframes everything below. With that out of the way, here's what June actually showed.
The market cooled - in volume far more than price
Buyer demand pulled back hard: pending sales were down 26% from a year ago, with the 30-year mortgage rate sitting at 6.52% and affordability stretched about as thin as it's been this cycle.
You can feel the cooling everywhere in the listing data. More than half of active listings - 52% - have cut their price. That's the highest share since the last real slowdown. Some perspective before you panic: at the bottom of the 2009 crash, that number hit 75%. We're elevated, not collapsing. But the days of naming your price and watching offers roll in are over.
At the 2021 peak, nearly half of all homes sold above asking; today it's 15%. Homes still move - a typical one in about 29 days - but the leverage has shifted back toward buyers.
So why haven't prices actually fallen?
If demand fell 26%, why did real values still tick up ~3% instead of dropping? Two reasons.
First, inventory is still tight (more data to come on accidental landlords) - around four months of supply, closer to a balanced market than a buyer's market. You can't have a price crash without a flood of listings, and we don't have one - yet.
Second, cash is still king. About 22% of buyers - better than 1 in 5 - paid cash in June. Cash buyers don't care about 6.52% rates. They keep transacting when financed buyers step back, and they put a floor under the whole market.
The 25-year view is the one that matters
If you own here, zoom out. In 2001, the typical Northeast Florida home sold for about $118,000. Today it's around $420,000 - and even discounted for every measurement quirk, that's a generation of real, durable wealth-building, straight through a historic crash and the sharpest rate spike in 40 years.
That's the real story of this market. Month to month it wobbles. Year to year the narrative flips from "boom" to "bust" and back. But the people who owned Northeast Florida real estate through the noise have done extraordinarily well - because real estate here has always been a long game, and we've benefitted historically, tremendously, from migration patterns.
What it means for you
If you're buying: you have more leverage than you've had in years. Half the market is cutting price, true appreciation has cooled to low single digits, and sellers are negotiable in a way they simply weren't in 2021.
If you're selling: price to your home's real value, not to a median headline. The buyers out there are careful and rate-sensitive, and the ones who overprice are the ones sitting on the market - and eventually cutting (sometimes, by a lot).
If you already own: breathe. Cooling volume is not a crash (though in some areas we're already seeing a correction), and the long arc here has rewarded patience every single time.
These numbers come from the June 2026 Momentum Market Pulse™, computed from realMLS data across Northeast Florida's seven counties. Want the full report - with the charts, the price bands, and the county-by-county breakdown? It's free at movewithmomentum.com.
- Jon Brooks, Co-Founder, Momentum Realty / jon@movewithmomentum.com
This article summarizes Jon Brooks's market commentary and includes his opinions. It is for general informational purposes only and is not financial, investment, legal, or tax advice. Metro-level statistics are never a price for any specific home. Consult a licensed professional about your situation.