
Once an offer is accepted, the next question is always the same: how long until this is done? In Northeast Florida there is a real answer, and it has moved less over 25 years than most people assume.
We pulled every residential closed sale in the realMLS footprint back to 2001, 609,763 of them after cleaning, and measured one thing on each: the number of days between the signed contract date and the close date. Then we split the series by how the buyer paid. What comes back is a quarter century record of how long a deal takes here, lane by lane, and one of the oldest rules of thumb in the business does not survive it.
The financed lanes have converged
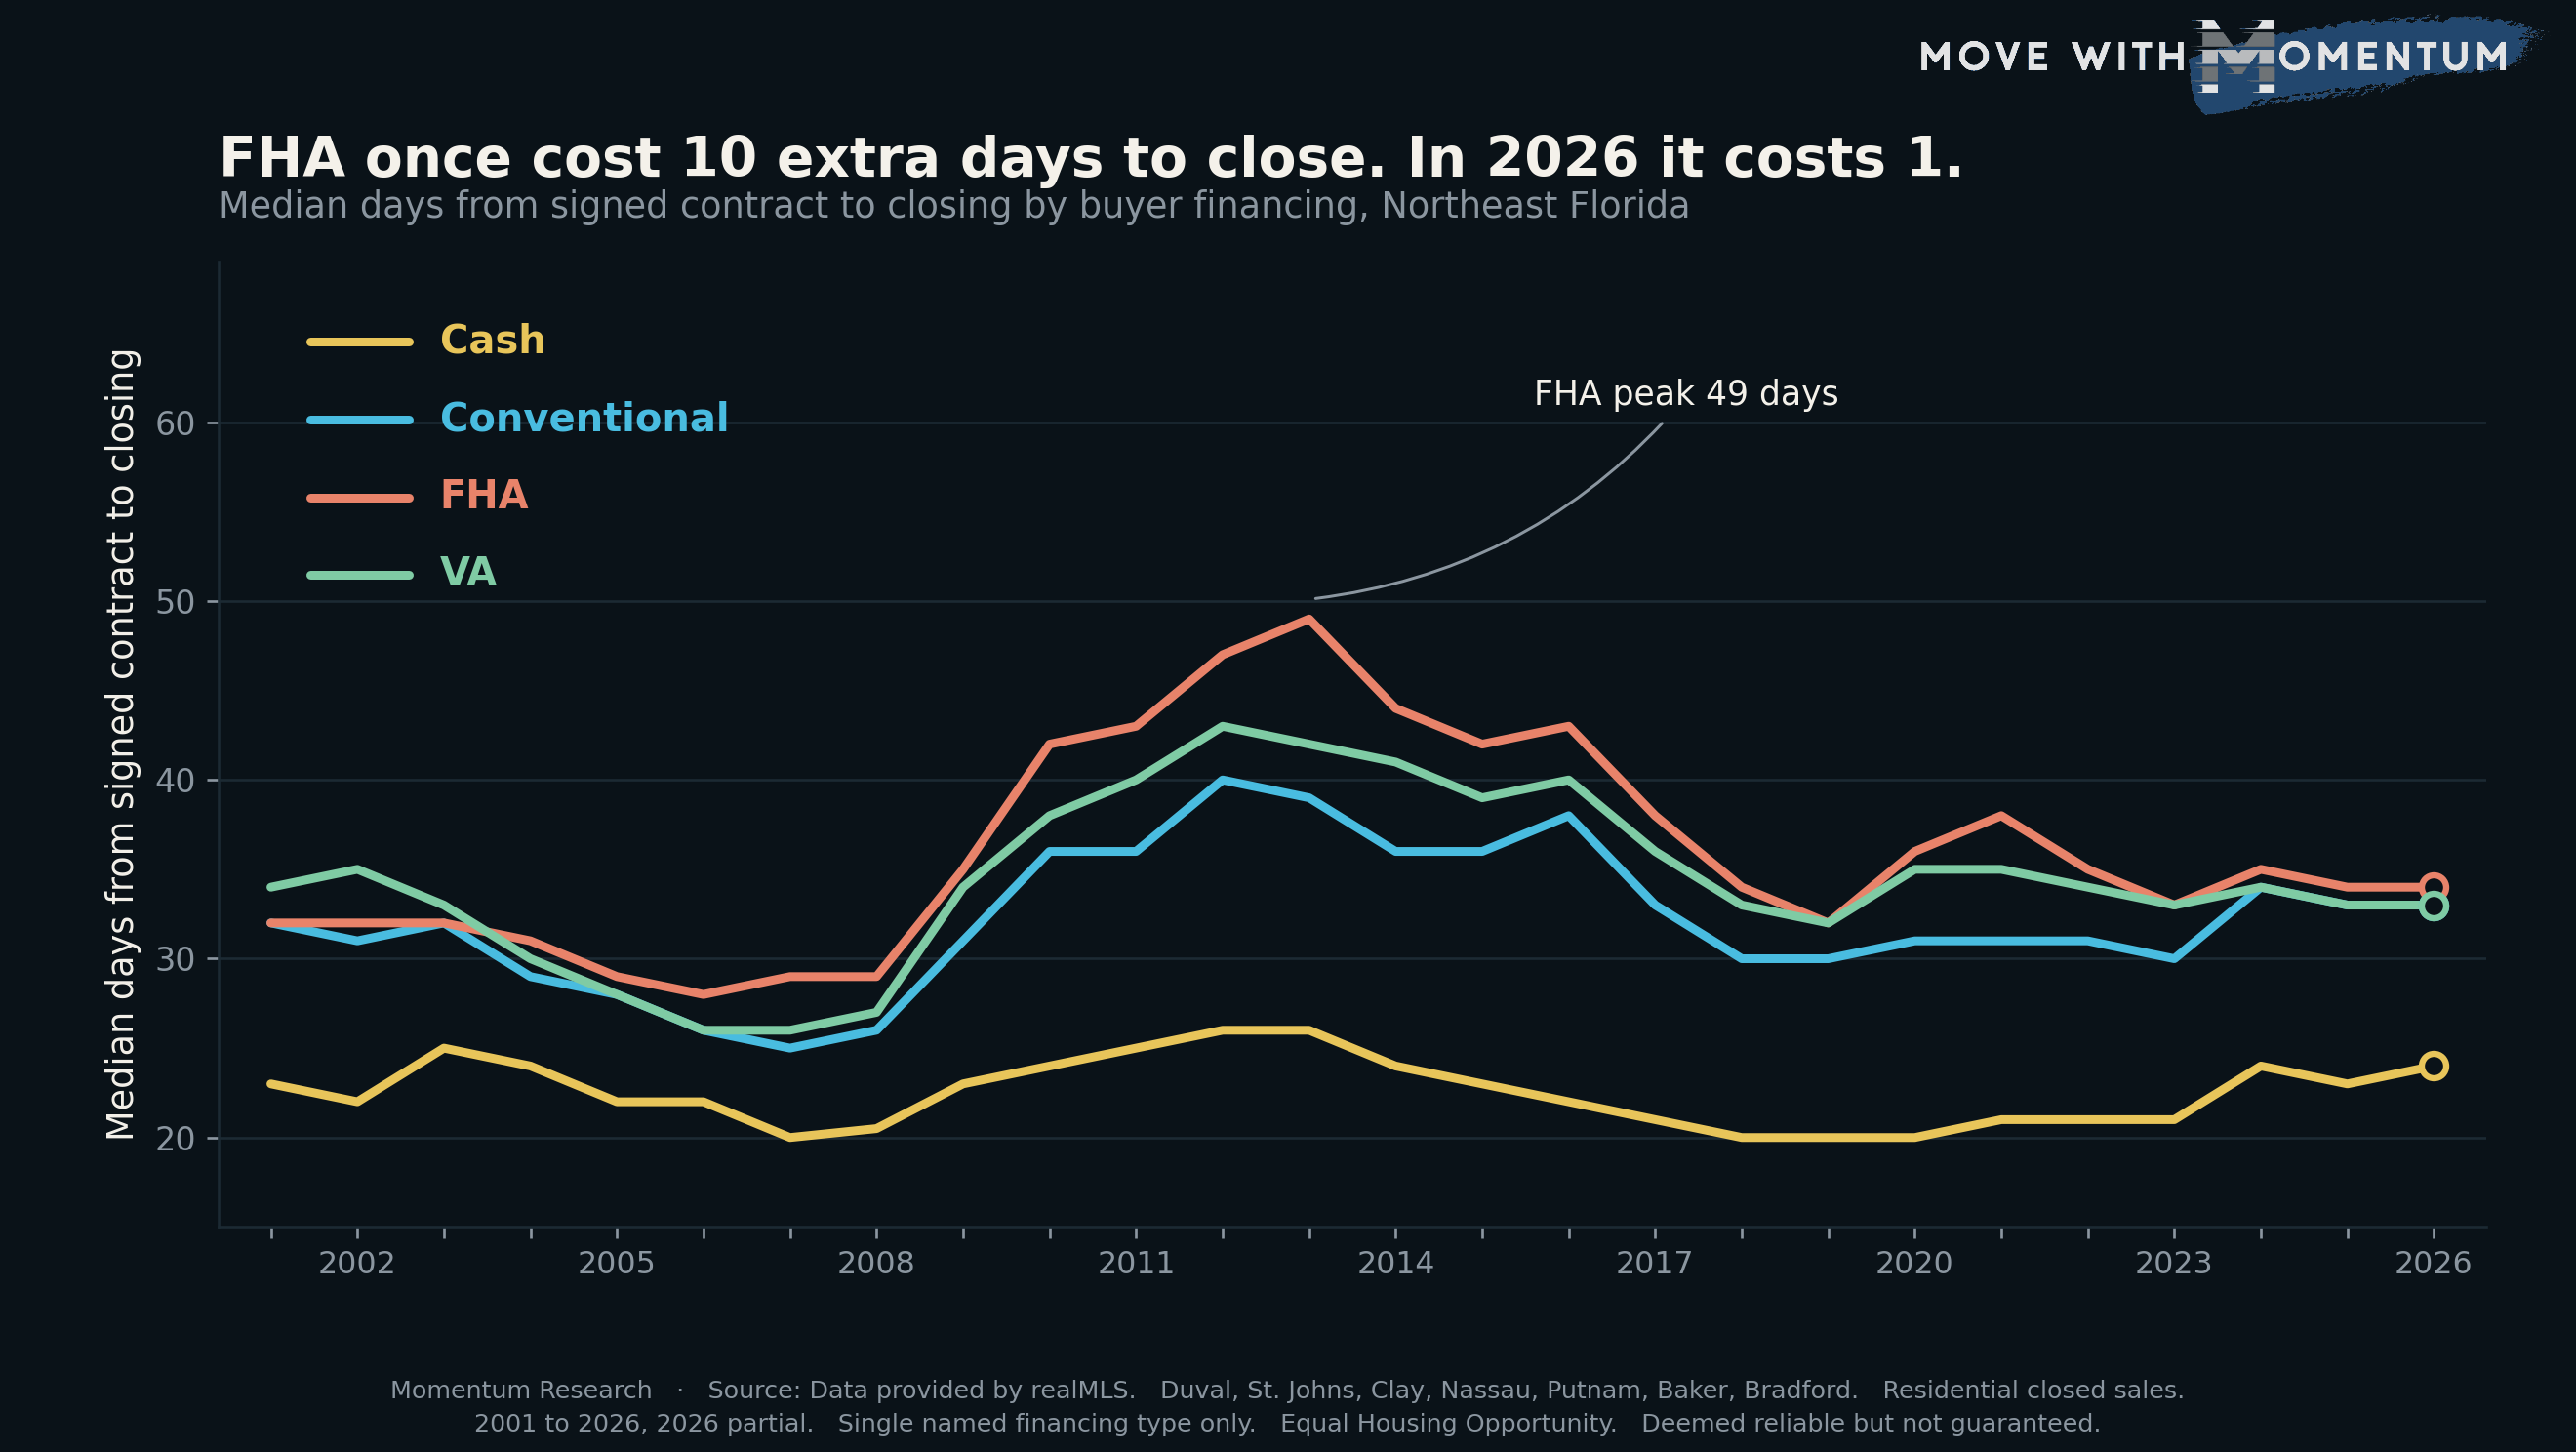
In 2013 the three financed lanes were far apart. A conventional purchase took a median 39 days from contract to closing. VA took 42. FHA took 49. That is 10 days more for FHA than conventional and 7 more than VA, which on a standard contract is the difference between making the date and asking for an extension.
In 2026 those same three lanes read 33 for conventional, 34 for FHA, and 33 for VA. One day of spread across all of them. The reputation that a government backed loan drags a closing out is roughly a decade out of date in this market. An offer discounted today on the theory that FHA underwriting adds weeks is being marked down for a gap that has already closed.
Financing type still tells you something about how a deal is structured, and the mix itself keeps moving: we charted which loans buyers here actually use in FHA and VA loans are back to a third of Northeast Florida home sales. What financing type no longer tells you, on these numbers, is which financed offer reaches the closing table first.
Cash is worth about ten days, and always has been
The cash line is the flattest series on the chart. It has run between 20 and 26 days every single year since 2001, and it sits at 24 in 2026. It did not blow out during the crisis and it did not compress during the frenzy. Whatever else the market was doing, a cash purchase took about three and a half weeks.
Against 33 or 34 days for a financed purchase, that is a gap of roughly ten days, and it has been roughly ten days for a generation. It is a genuine advantage and it is worth pricing honestly in a negotiation: ten days is real, and ten days is also not a month. A seller trading thousands of dollars for a cash close is buying a week and a half of calendar, which may or may not be the right trade depending on what is waiting on the other end.
The slow era was a lending story, not a market story
The one period that genuinely dragged was 2010 to 2016. FHA ran 42 to 49 days for seven straight years, peaking at 49 in 2013, and conventional peaked at 39 in the same year. Cash barely moved through any of it and stayed in its usual 20s.
That split is the useful part. If closings had slowed for reasons shared across the whole market, cash would have slowed too, because cash deals run through the same title companies, the same municipalities and the same inspection schedules. Cash did not slow. The delay appeared only where a lender was in the file, which puts the cause in underwriting and appraisal turn times rather than in buyer behaviour, inventory or anything about the homes themselves.
It also means the recovery after 2016 was a process improvement, not a change in the market. Note that this clock starts at the signed contract. The earlier stretch, from list date to contract, is a separate measurement, and we track it in how long homes take to sell in Northeast Florida in 2026.
Every lane has slowed a little since 2023
Worth flagging honestly: the series has widened again slightly. Conventional went from 30 days in 2023 to 33 in 2026, FHA from 33 to 34, and cash from 21 to 24. Every lane is 1 to 3 days slower than it was two years ago.
That is a small move over a short window, and cash moved with the financed lanes rather than against them, which is not the signature of a lending bottleneck. It is a thing to watch across the next few years rather than a trend to call now. It does sit alongside other changes at the closing table, including the rise in seller concessions, which is a separate measurement of the same negotiation.
How agents can use this data
With a seller weighing competing offers: price the timing difference off the record instead of off reputation. Between a conventional offer and an FHA offer, the median difference in this market in 2026 is one day. Between either of those and a cash offer it is about ten. If an offer is being scored down for its financing, put a number of days on that penalty and check the number against the series before it costs the seller price.
With a buyer trying to strengthen an offer without raising the price: the calendar is negotiable and it is cheaper than money. A financed buyer can propose a closing date at the market median rather than the contract default, arrive fully underwritten instead of prequalified, and get the appraisal ordered in the first days rather than the second week. The 2010 to 2016 record shows the financed lanes move on lender turn times, and lender turn times are the part of the timeline a buyer can actually influence.
At a listing appointment: sellers want to know how fast they get to the table. There is a real answer for this market in 2026: a median 33 to 34 days from signed contract on a financed sale, and about 24 on cash. Show the 25 year chart rather than quoting a range from memory. A figure with a quarter century of closings behind it holds up under questions.
On social or with press: one line carries it. In Northeast Florida, FHA purchases closed 10 days slower than conventional ones in 2013. In 2026 the gap is one day. Pair it with the Jacksonville market data hub for price and inventory context.
Keep the framing on the loan process, the contract and the calendar, never on who uses which type of financing. And cite the source line at the bottom of this post whenever you quote the figures, presented as market medians rather than as a promise about any single transaction.
People also ask
How long does it take to close on a house with an FHA loan?
In Northeast Florida the median FHA purchase closed 34 days after the contract was signed in 2026, against 33 days for conventional and 33 for VA. That one day of spread is a recent development: in 2013 the FHA median was 49 days against 39 for conventional. Figures are per Momentum Research analysis of realMLS closed residential sales and are deemed reliable but not guaranteed.
Is a cash offer really faster?
Yes, by about ten days in this market. The median cash purchase closed 24 days after contract in 2026, against 33 to 34 days for the financed lanes. The cash median has held between 20 and 26 days every year since 2001, so the advantage is durable, but it is measured in days rather than weeks. A cash close still needs title work, and any contract can run late.
What slows a closing down?
In this data the slow stretches show up only when a lender is in the file. From 2010 to 2016 the FHA median ran 42 to 49 days while the cash median barely moved, which points at underwriting and appraisal turn times rather than at something shared by every sale. Title work, surveys, insurance binders and repair negotiations can add time to any transaction, but those would have moved the cash lane too, and they did not.
The takeaway
The oldest timing rule in this business, that FHA closings take substantially longer, was true in Northeast Florida in 2013 and is not true in 2026. Conventional, FHA and VA now finish within a day of each other, at 33, 34 and 33 days from signed contract. Cash finishes about ten days sooner, as it has every year since 2001. When the market did slow, it slowed only in the financed lanes, which is where the fix came from too. If you are weighing offers or writing one, use the days, not the reputation. When you are ready to put a real number on your own home, start a comps based valuation on our home value page. Data reflects closed sales in the realMLS footprint and is deemed reliable but not guaranteed. This is general information, not investment advice.
Momentum Research. Equal Housing Opportunity.
This article was compiled with the help of automated tools from realMLS closing records and may contain errors. Information is deemed reliable but not guaranteed. It is for general information only and is not financial, investment, legal, or tax advice. Verify all facts independently before relying on them. Method: Momentum Research analysis of realMLS closed residential sales in Baker, Bradford, Clay, Duval, Nassau, Putnam and St.
Johns counties, close years 2001 through 2026, with 2026 partial and therefore incomplete. The metric is CloseDate minus PurchaseContractDate. Records are deduplicated on ListingId plus CloseDate, leaving 609,763 usable sales; rows missing either date, or spanning below 0 or above 365 days, are dropped. Only sales carrying exactly one named financing type are counted, so blank, other, private and seller financed rows are excluded rather than folded into a bucket they do not belong in.
A year and financing lane must have 300 or more sales to be plotted.