
Every market report in Northeast Florida leads with the same number: the median days on market. Ours is 38 days so far this year. It is an honest figure, correctly calculated, and it describes almost nobody.
First, the number most people actually mean. If you count from the day a home lists to the day it closes, the median Northeast Florida sale took 78 days in January through July 2026: a median 38 days to go under contract, then a median 32 more to reach the closing table. We report 78 as the median of that full span measured on each individual home, not as 38 plus 32, because adding two medians together gives 70 and that is not a figure any house experienced.
That 78-day number is the honest answer to the question. The rest of this piece is about why the 38-day half of it is far less useful than it looks.
We put all 360,408 closed sales in the seven-county realMLS footprint since 2001 into four time-on-market buckets, holding the window at January through July for every year so the partial current year cannot fake anything. What comes out is not a market that clusters around its own average. It is a market with two ends and a thin middle.
The median describes about one sale in ten
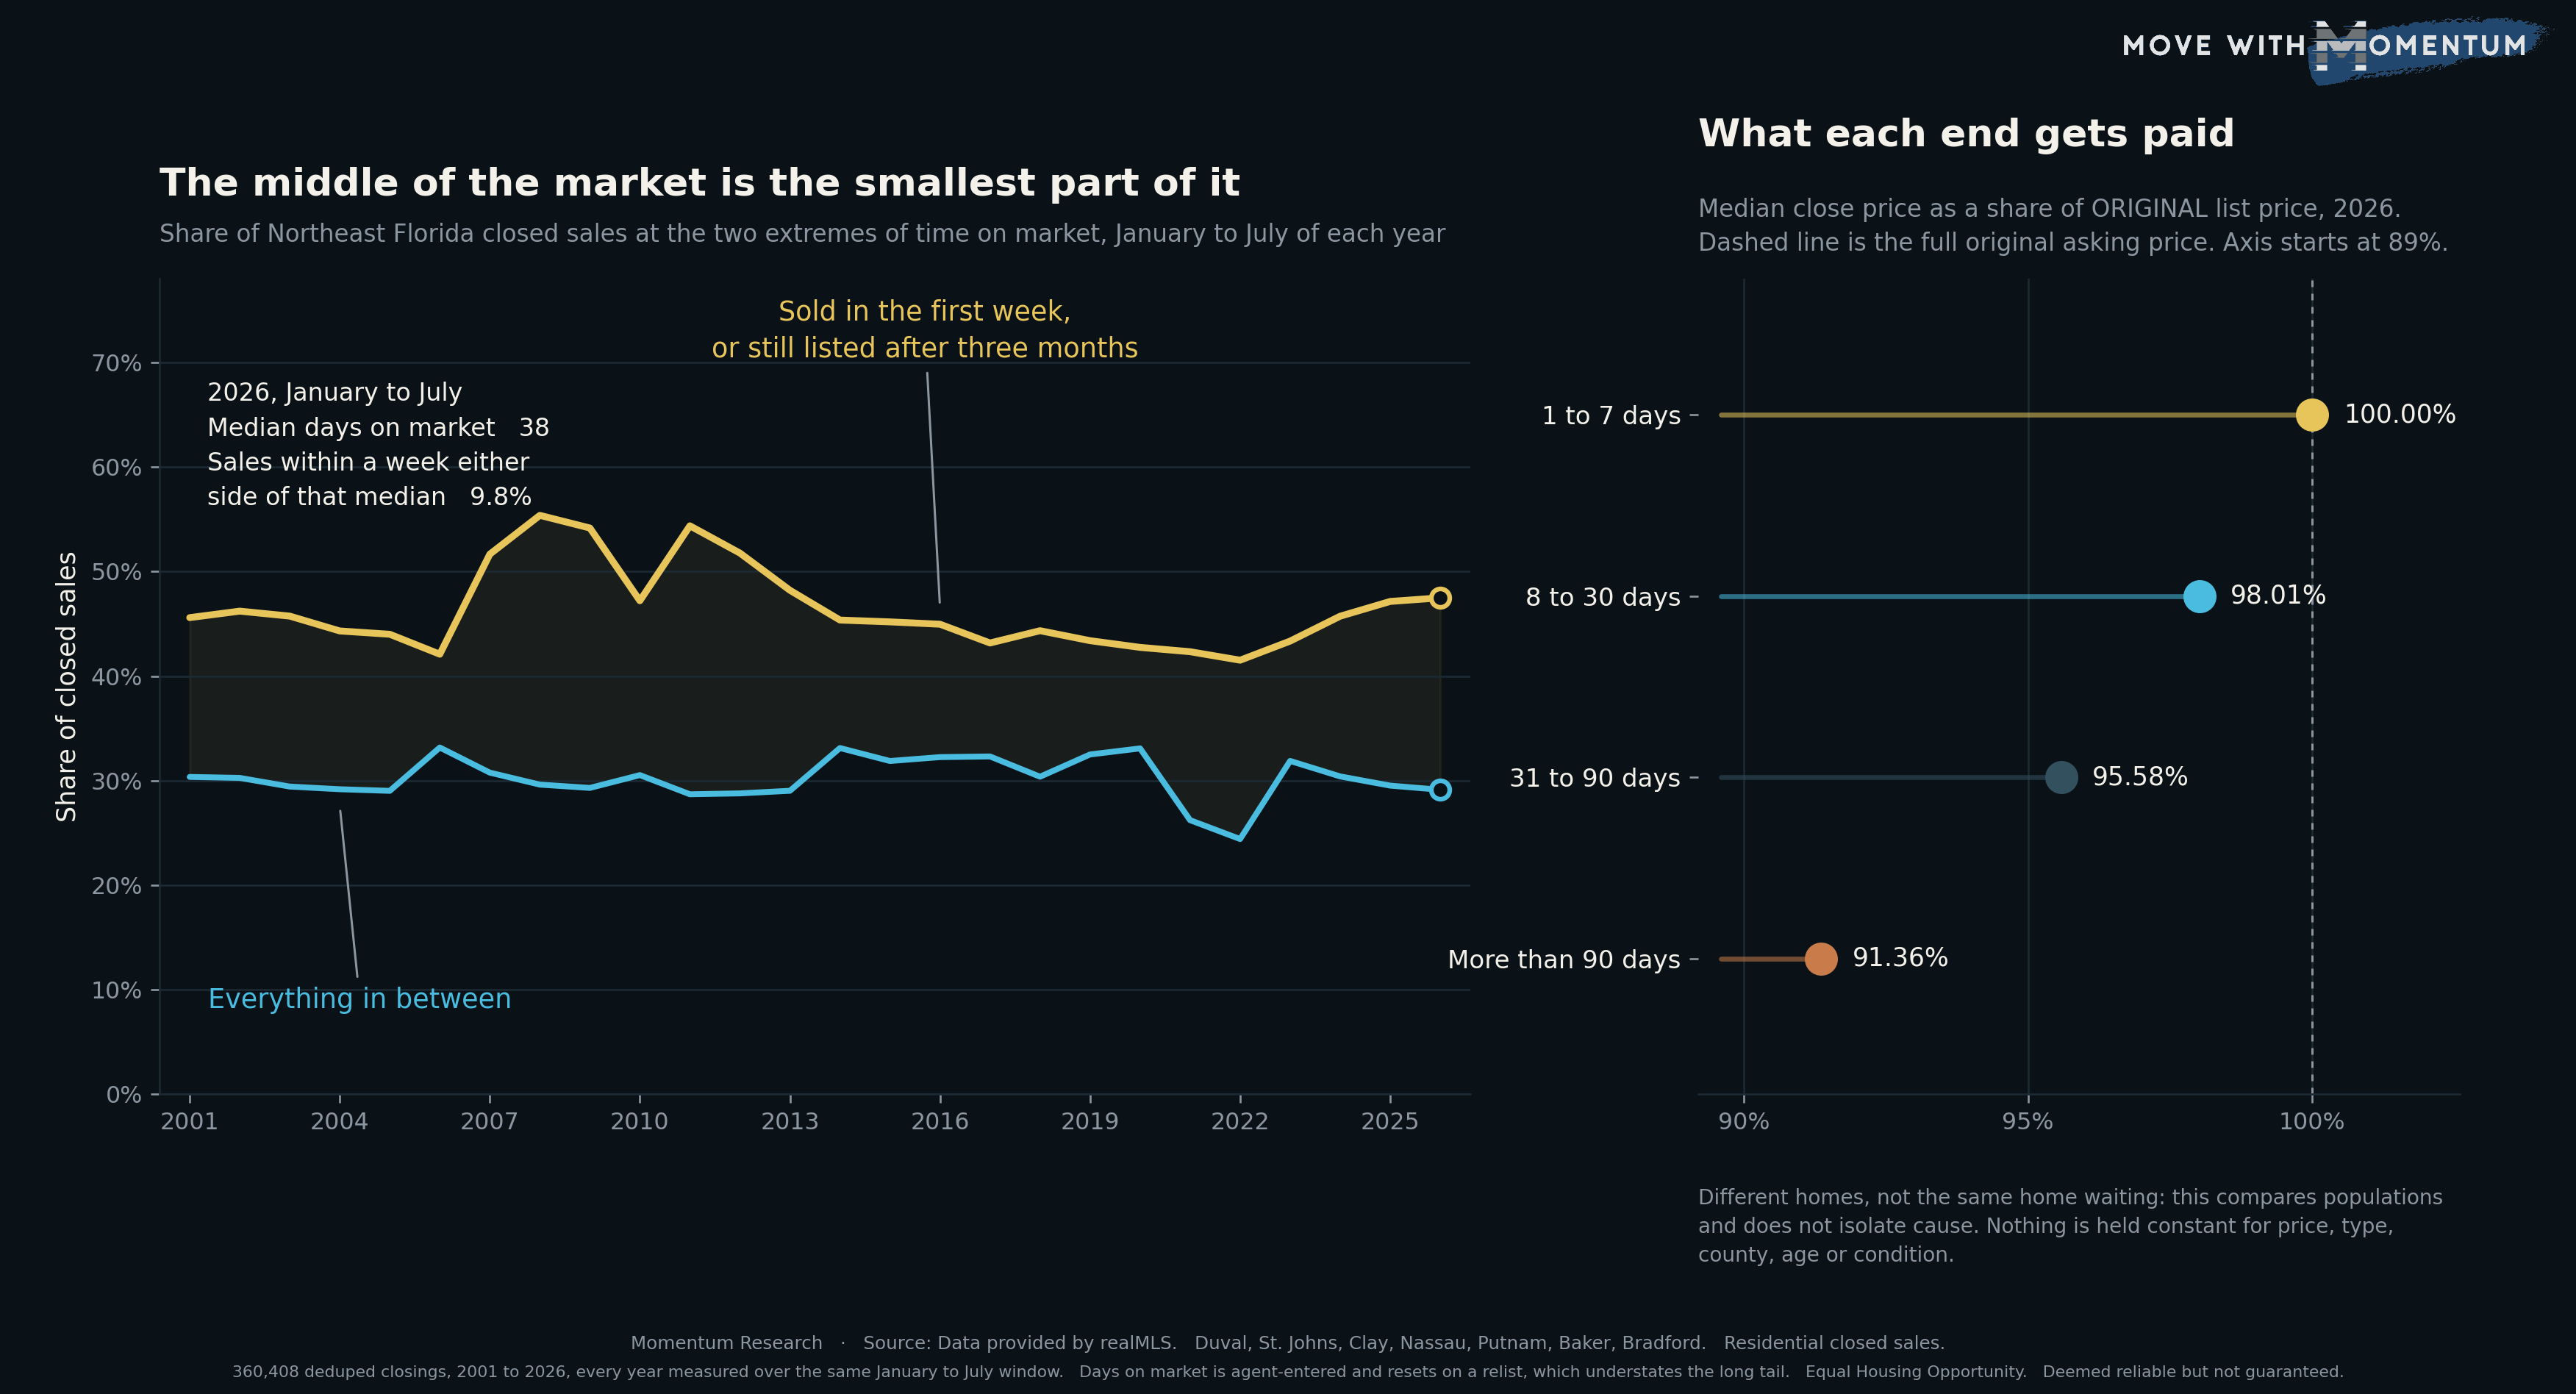
In January through July 2026 the median Northeast Florida home went under contract in 38 days. Only 9.8% of sales closed within a week either side of that. Put another way, if you tell a seller to expect the typical timeline, you are describing an outcome that roughly one home in ten actually gets.
That is not a quirk of this year. The share of sales landing near the median has been under 14% in 24 of the last 26 years. The one genuine exception is the frenzy: in 2022 the median fell to 17 days and 23.8% of sales landed near it, because when almost everything sells immediately the distribution finally does bunch up. Every other year, the middle is thin.
Two ends and a thin middle, in all 26 years
In 2026, 21.2% of closings went under contract inside seven days and 26.3% took more than ninety. Those two opposite outcomes are 47.5% of the market between them. The entire 31-to-90-day middle, which is what most people picture when they imagine a normal sale, is 29.1%.
The extremes have outweighed the whole middle in 26 of the 26 years we can measure. The mix shifts a lot with conditions, and that part is intuitive: in 2011 the slow end swelled to 47.7% and the fast end shrank to 6.7%, while in 2022 it inverted to 32.6% fast and 8.9% slow. What does not change is that the middle never wins. It has run between 24.4% and 33.2% for a quarter of a century regardless of what the market was doing.
This is the part that matters for anyone setting expectations. The question facing a listing is not really "how many days will this take." It is closer to a fork: this home is either going to move almost immediately or it is going to sit, and the middle path is the least likely of the three.
What each end gets paid
The two ends do not just differ in speed. They close at visibly different prices relative to what the seller originally asked.
Measured against original list price, not the last reduced price, 2026 sales that went under contract in the first week closed at a median of exactly 100.00% of the original ask, and 22.4% of them closed above it. Sales taking 8 to 30 days closed at 98.01%. From 31 to 90 days, 95.58%. Beyond ninety days, 91.36%, with only 3.2% closing above the original ask.
End to end that is a spread of 8.64 points of the asking price. On a $400,000 list price it is about $34,600 of difference between the two ends of the same market in the same year.
What this does not prove
The price ladder above is a comparison of different homes, not a measurement of what waiting costs a particular seller. That distinction is the whole ballgame and we are not going to blur it.
Homes that sell in their first week are, on average, homes that were priced correctly for their condition and segment from the start. Homes that sit past ninety days disproportionately started above what the market would pay. So the 8.64-point spread is substantially a story about the accuracy of the original asking price, and only partly a story about elapsed time. Causation runs in both directions here and nothing in this dataset separates them. Anyone who tells you this proves that waiting costs you 8.64 points is overreading it.
Nothing is held constant for price, property type, county, age or condition either. And there is a real measurement wrinkle worth naming: days on market is agent-entered and it resets when a listing is withdrawn and put back on. That means the long tail here is understated, not overstated, because some of what shows up as a fresh listing is a home that has been trying for a year. We have measured that separately, and a relisted home carries a median 196 days of total market time against 37 for a home that sold on its first listing.
How agents can use this data
Replace the single-number timeline with the fork. Telling a seller "about five weeks" sets up an expectation that one listing in ten meets. Telling them that roughly a fifth of homes go in the first week, a quarter take more than three months, and the odds of landing in the tidy middle are under one in three is both more accurate and more useful. It also makes the first two weeks feel as consequential as they actually are.
Treat day 8 as a checkpoint, not day 60. The gap between the first-week band and the 8-to-30-day band is already about two points of original list price. Whatever review of price, photography, access and condition is going to happen is worth doing while the listing is still inside its first month, because the price outcome is deteriorating from the very first band onward, not just at the end.
Use original list price, not reduced list price, when you talk about how close a home sold to ask. The 91.36% figure at the slow end only appears when you measure against the original number. Measured against the final reduced price, a long, painful listing can look like it sold near ask. That is the arithmetic that lets an overpriced launch disappear from the record, and it is why we track price cuts separately.
Cite it with the caveat attached. These are medians across many property types and price points in seven counties, drawn from realMLS closed sales for January through July. Give the source and the date range, and say plainly that the comparison is between different homes rather than proof of what waiting does to any one of them. The caveat is what makes the number usable rather than arguable.
People also ask
How long does it take to sell a house in Jacksonville?
Measured from listing to closing, the median Northeast Florida home took 78 days in January through July 2026: a median 38 days to go under contract and a median 32 more to close. Many published Jacksonville figures quote list-to-close and land in the 89 to 103 day range using different data sources, so check which span a number covers before comparing. The 38-day half is also a poor description of a typical sale. Only 9.8% of closings landed within a week either side of it. About 21.2% went under contract within seven days and 26.3% took more than ninety days, so the two extremes together were 47.5% of all sales while the 31-to-90-day middle was 29.1%. Figures are Momentum Research analysis of realMLS closed sales across Baker, Bradford, Clay, Duval, Nassau, Putnam and St. Johns counties.
Do homes that sell faster sell for more in Northeast Florida?
They close nearer the original asking price. In 2026, homes going under contract within seven days closed at a median 100.00% of their original list price, against 98.01% at 8 to 30 days, 95.58% at 31 to 90 days and 91.36% past ninety days. That is an 8.64-point spread. It is not proof that waiting causes a lower price, because fast sales are also disproportionately homes that were priced accurately at launch. The two effects cannot be separated in this data.
Is the Jacksonville market slower than it used to be?
It is close to its long-run normal rather than unusually slow. The 2026 median of 38 days sits alongside 41 days in 2001, 38 in 2002 and 37 in 2003, and well inside the 34-to-46 day range of 2016 through 2020. It is much slower than the 17-to-19 day frenzy of 2021 and 2022 and much faster than the 79-to-84 days of 2008 through 2011. The comparison that makes 2026 look slow is usually a comparison against the frenzy rather than against normal conditions.
The takeaway
The headline days-on-market number is real, but it is a summary of a distribution that has almost nothing in the middle. In this market a listing mostly goes one of two ways, and which way it goes is worth roughly eight and a half points of the asking price. The useful conversation with a seller is not about the average. It is about which end they are setting themselves up to land in during the first two weeks.
It fits with the other thing we found this month about how averages hide structure here, that the compass direction from downtown moves price per square foot 2.4x while distance barely moves it at all. The regional summary figures in Northeast Florida consistently conceal more than they reveal.
Method and limits
Source is realMLS closed sales for Baker, Bradford, Clay, Duval, Nassau, Putnam and St. Johns counties, property type Residential, deduplicated on listing identifier plus close date. The window is fixed at January through July of each year, 2001 through 2026, so that the partial current year is compared like for like rather than as a stub.
Records were required to carry a close date, a close price and a days-on-market value between 0 and 730; that leaves 360,408 usable closings, and years are reported only where at least 2,000 closings survive the filters. Time-on-market bands are 1 to 7 days, 8 to 30, 31 to 90 and more than 90.
The list-to-close figure is the median of the close-date-minus-on-market-date span computed on each individual sale (16,191 records carrying a purchase contract date, spans of 0 to 365 days), not the sum of two separate medians. The price ladder measures median close price as a percentage of ORIGINAL list price, restricted to records with an original list price between $25,000 and $5,000,000.
Days on market is entered by the listing agent and resets when a property is withdrawn and relisted, which understates the slow end; cumulative days on market is the field that captures relisting and it is analysed separately. Figures are medians, not averages, and nothing is controlled for price, property type, county, age or condition. Data provided by realMLS and deemed reliable but not guaranteed. Equal Housing Opportunity.