
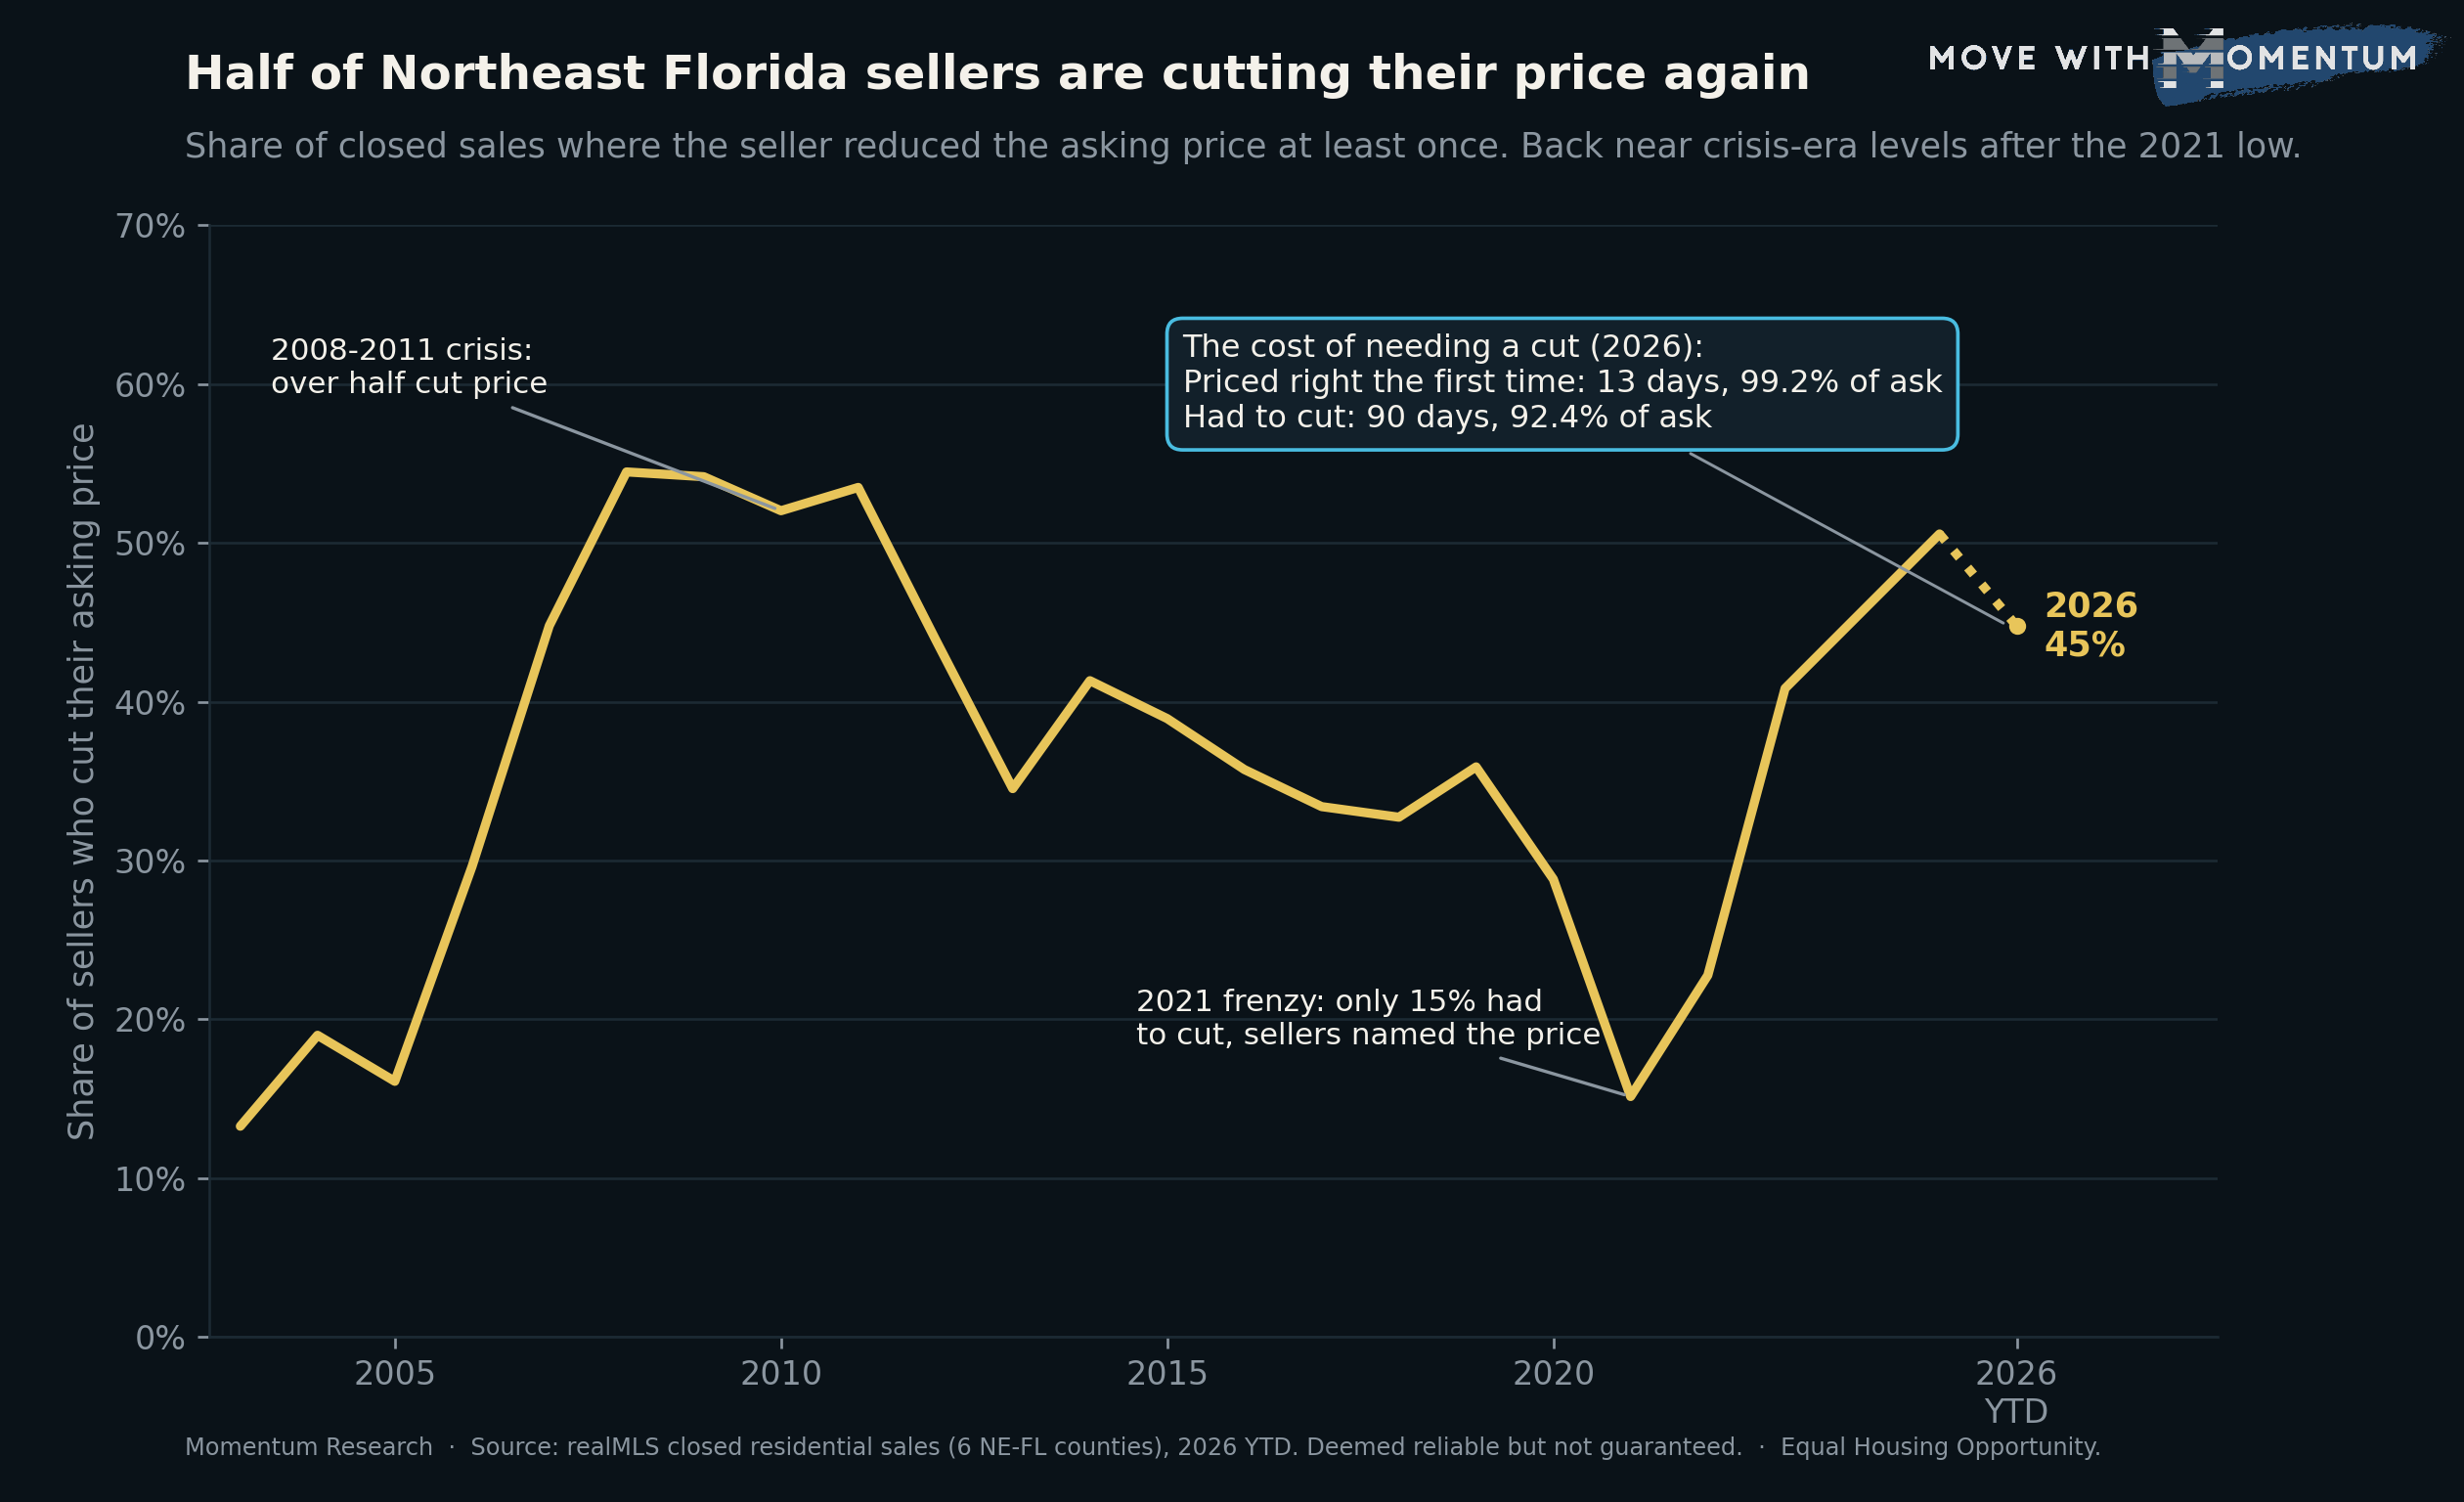
Here is a number that should change how you list a home: in 2026, about 45 percent of Northeast Florida sellers had to cut their asking price at least once before it sold. Not long ago that was rare. In the 2021 frenzy only about 15 percent cut, because sellers essentially named the price and buyers paid it. The share is now back near where it sat during the 2008 to 2011 downturn, when more than half of sellers cut.
We took every closed sale across the six realMLS counties, Baker, Clay, Duval, Nassau, Putnam, and St. Johns, and flagged each one where the seller reduced the asking price at least once. Tracking that share year by year turns "how much leverage do sellers have" into a single line you can read at a glance.
Back to cutting, after the frenzy let sellers name the price
The pattern tells the story of the market's mood. Price cuts were common through the long recovery, eased into the late 2010s, then all but disappeared in 2021 when demand overwhelmed supply and homes sold in days. As mortgage rates roughly doubled and buyers regained leverage, the share of sellers cutting climbed fast: about 23 percent in 2022, 41 percent in 2023, 46 percent in 2024, and roughly half in 2025, holding near 45 percent so far in 2026. Homes are still selling, but sellers no longer set the terms. This is the seller-side mirror of what we saw in how long homes now take to sell.
What a price cut actually costs
The more useful number is the penalty, and it is large. In 2026, Northeast Florida homes that cut the asking price sold in a median of 93 days and closed at about 92 percent of the original list price. Homes that never cut sold in a median of 13 days and closed at about 99 percent of the original list. That is roughly seven times as long on the market and about seven percentage points less of the asking price.
The cut is not really the villain here. The high starting price is. A listing that opens above the market gets skipped by the buyers who are actually shopping in its true range, sits while newer listings look fresh next to it, and eventually drops its price to attract the buyers it should have reached on day one, by which point the listing looks stale and negotiation has shifted to the buyer. The price cut is the visible symptom of an anchor that was set too high.
How agents can use this data
With a seller who wants to "test" a high price: show the split. Priced right, the median NE-FL home sold in about two weeks near full ask in 2026; the homes that started high and had to cut sat about three months and netted roughly seven points less. Testing a high number is not free, it is measured in months and dollars.
With a stale listing that has already cut: reset expectations to the current comps in one decisive move rather than chasing the market down in small steps. The data shows a home carrying a price-cut history closes further below its original ask; the goal is to stop the bleed, not to save face on the first number.
With a buyer: a long days-on-market plus a price cut is a real negotiating signal. It says the first price missed and the seller has already blinked, which is exactly the profile that closes below original ask. Fresh listings priced correctly do not.
On social or with press: the chart carries it. One line: about 45 percent of Northeast Florida sellers cut their price in 2026, and the ones who did sold in 93 days at 92 percent of ask, versus 13 days at 99 percent for the ones who priced it right.
Keep it about the pricing and the market, not about any individual seller. Cite the source line below if you quote the numbers, and never present them as guaranteed.
People also ask
How many home sellers cut their price in Northeast Florida in 2026?
About 45 percent of closed sales in the realMLS footprint (Baker, Clay, Duval, Nassau, Putnam, and St. Johns counties) had at least one asking-price reduction in 2026, up from a low of about 15 percent in the 2021 frenzy and near the 52 to 55 percent levels of the 2008 to 2011 downturn, per Momentum Research analysis of realMLS closings.
Does cutting your asking price mean selling for less?
On average, and more slowly. In 2026 Northeast Florida homes that reduced the asking price sold in a median 93 days at about 92 percent of the original list price, versus 13 days at about 99 percent for homes that never cut. The gap reflects starting too high, not the price cut itself, per realMLS closing records.
How do I avoid having to cut my price?
Price to current comparable sales from day one. The data shows homes priced in line with the market sell in about two weeks near full asking price, while homes that start high and later cut tend to sit around three months and net less. This is general guidance, not a guarantee about any specific home.
The takeaway
The share of sellers cutting their price is a clear read on who holds the leverage, and right now it is back near downturn levels after the 2021 low. The lesson is not to fear a price cut; it is to avoid needing one. Homes priced to the market sold in about two weeks near full ask in 2026, while homes that started high and cut sat about three months and closed roughly seven points lower. If you are selling, the first price is the whole game. For how fast homes are moving overall, see our days-on-market breakdown, or start a real, comps-based valuation on our home value page. Data reflects closed sales in the realMLS footprint and is deemed reliable but not guaranteed. This is general information, not investment advice.
Momentum Research. Equal Housing Opportunity.
This article was compiled with the help of automated tools from realMLS closing records and may contain errors. Information is deemed reliable but not guaranteed. It is for general information only and is not financial, investment, legal, or tax advice. Verify all facts independently before relying on them. Source: Momentum Research analysis of realMLS closed residential sales, Baker, Clay, Duval, Nassau, Putnam, and St. Johns counties, share of sales with at least one asking-price reduction (original list price greater than final list price) and, for 2026, median days on market and median close-to-original-list ratio for sales that did versus did not cut. Original-list data is thin before 2003. 2003 to 2026 YTD.