
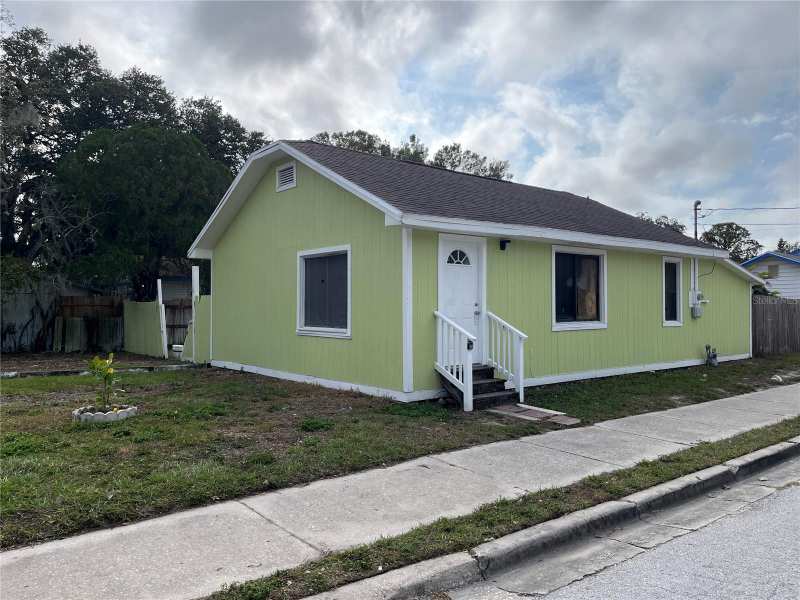
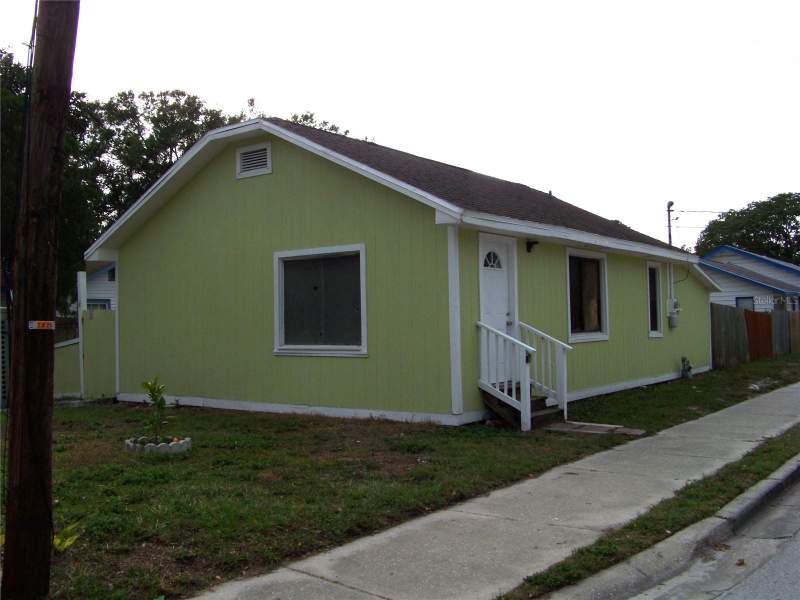
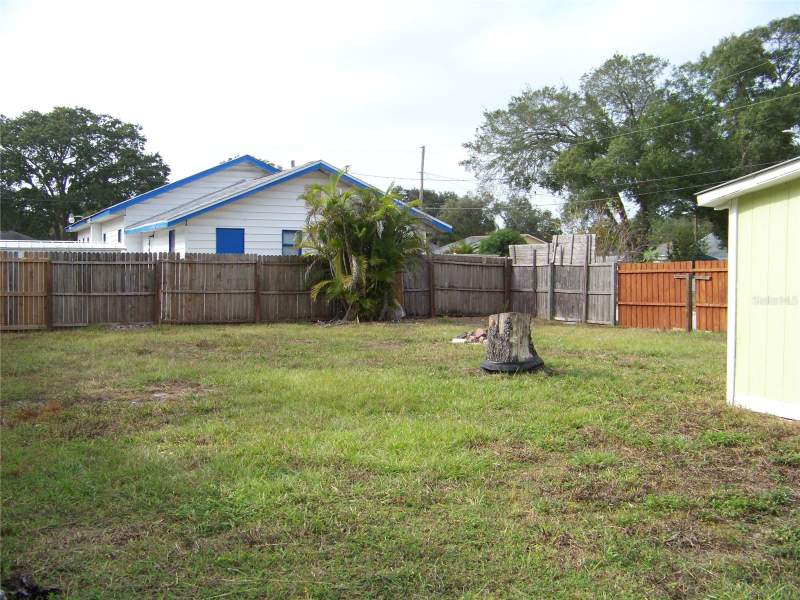
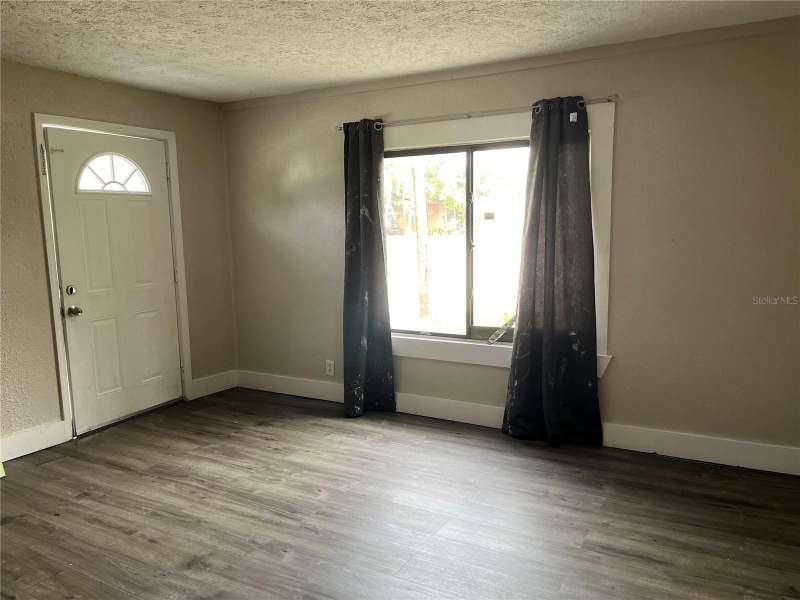
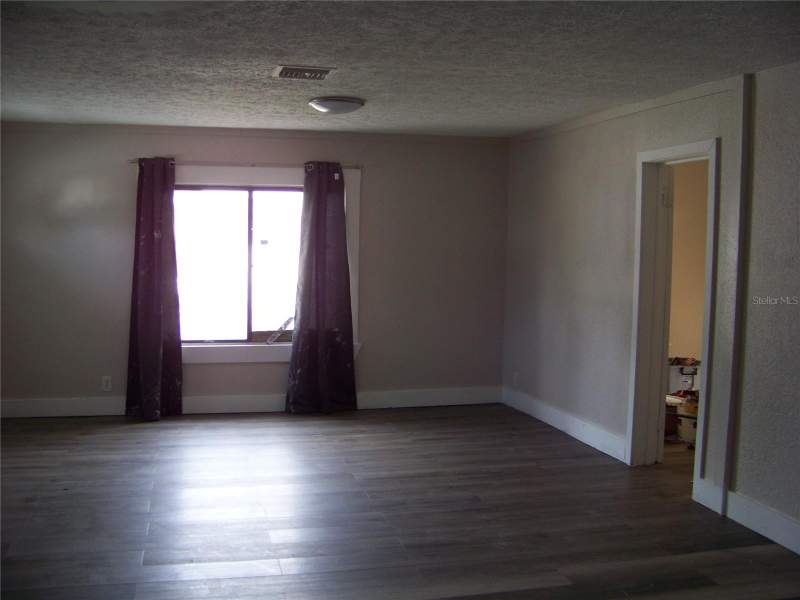
1554 Tilley Avenue, Clearwater, FL 33756
Sources: Stellar MLS (listings + 12-mo closed sales), FEMA, modeled insurance. Interpretation: Momentum Research. Data notes
As of October 20, 2026, 1554 Tilley Avenue in Belmont Sub 2Nd Add, Clearwater is listed at $264,500 (744 sq ft, about $356 per sq ft). That sits within a few percent of Belmont Sub 2Nd Add's median closed sale of $252,500 over the last 12 months (10 recorded sales). Per square foot it is above the community's recent $245/sq ft by about 45%. It has been 603 days on market, longer than the community's typical 16 days to contract. Listing facts: built in 1930, no HOA. The parcel maps to FEMA flood zone X, outside the special flood hazard area. Figures are from the MLS record and county data; deemed reliable but not guaranteed.
- No CDD assessment on record
- Built 1930 · 96 yrs
- 744 sq ft of living area
- Listed at $264,500 — recent neighborhood median sale price ~$252,500 (nearby sales; deemed reliable, not an appraisal)
- 603 days on market
- No HOA reported by the listing (confirm)
About this home
Welcome to your future home or investment opportunity! This charming property is not just a house; it's a great starter home or an ideal investment property for savvy investors. The recent upgrades make it move-in ready, ensuring a hassle-free experience for it's new owners.
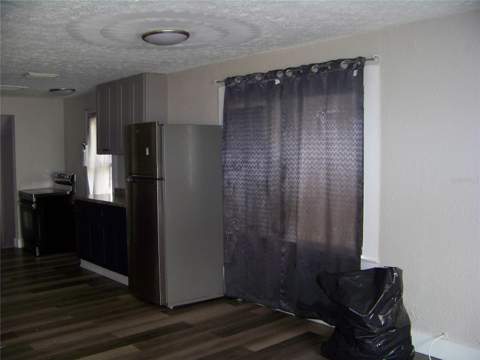
Step inside, and you'll be greeted by a fresh interior. The entire space has been updated to provide a comfortable environment and a welcoming space for you and your loved ones. Outside, the house boasts a new roof, siding, HVAC and exterior paint--all completed within the past few years.
Don't miss out on the chance to own this gem of a property - a perfect blend of comfort, convenience and investment potential. Schedule a viewing today and envision the possibilities that await you in this lovely home.
All 6 photos
Description provided by GRACE REALTY & PROPERTY MGMT and reproduced from the MLS; not independently verified.

 Provided via the Stellar MLS Internet Data Exchange, as distributed by MLS GRID · Listings courtesy of Stellar MLS as distributed by MLS GRID · Listings courtesy of Stellar MLS as distributed by MLS GRID. · deemed reliable but not guaranteedIDX information is provided exclusively for consumers' personal, non-commercial use and may not be used for any purpose other than to identify prospective properties consumers may be interested in purchasing. Data is deemed reliable but is not guaranteed by the MLS to be accurate.
Every fact, sourced
Listing data, public records, our calculations, and what to verify — each fact shown once. Estimates and calculations shown are for general information only, are not appraisals or advice, and should be independently verified.
Listing facts MLS
Public records & third-party data
Calculated estimates
Buyer should verify Buyer verify
Estimated monthly payment
- Principal & interest $1,465/mo 80%
- Taxes $231/mo 13%
- Insurance $144/mo 8%
$1,840/mo at 20% down, 30-yr @ 7.4% · edit any field to update.
Editable estimate — not a loan offer. Estimates only; see data & estimate notes.
What it really costs to own 1554 Tilley Avenue
The parts of the monthly number a mortgage calculator leaves out, from this listing's MLS record, the county tax roll, Citizens and FEMA. Property facts only.
| HOA dues | The listing states there is no HOA. |
|---|---|
| Home and flood insurance | The average Citizens Property Insurance premium in Pinellas County is $1,911/yr (20,791 policies, Citizens detail by county, April 2026); private-market quotes differ by roof age, wind mitigation and distance to the coast. The page's modeled range for this home is $1,000–$2,500/yr; neither is a quote. Flood: this address maps to FEMA zone X, outside the high-risk zone; flood insurance is optional but most lenders and insurers recommend it. Statewide, a zone X flood policy runs about $500–$700/yr (FEMA Risk Rating 2.0 averages, not a quote). |
| Roof and age | Built in 1930. An original roof would be about 96 years old; under Florida's 2022 reform (SB 2-D) carriers may require an inspection past 15 years, so budget for a roof report and ask for the roof permit date. |
Flood zone & elevation
Sourced environmental data for the parcel. Confirm with FEMA and your insurer.
From the FEMA National Flood Hazard Layer. In this zone lender-required flood insurance is generally not mandated; confirm for the parcel.
Approximate parcel elevation from USGS; confirm exact elevation with a survey.
Pinellas County is on the Florida coast; wind coverage is a major part of the premium. Premiums and coverage vary by home (roof age, wind mitigation, claims history); obtain a quote from a licensed insurer.
Natural hazard risk
FEMA National Risk Index for Pinellas County, FL: overall Relatively High. Ratings compare this county with every county in the United States for expected annual loss from each hazard.
Source: FEMA National Risk Index (county level, hazard risk ratings only). Ratings describe the county, not this parcel; the flood zone shown above is parcel-specific. Verify insurance requirements with your lender and agent.
Internet & broadband
Address-level fiber service is not confirmed for this home. Check the FCC National Broadband Map (broadbandmap.fcc.gov) or the provider for this address.
Cable broadband is common in Florida and Georgia towns but not confirmed for this address; verify with the provider.
5G home internet and satellite service depend on the exact location; check coverage for this address.
Pricing & the Belmont Sub 2Nd Add market
How this home is priced against recent nearby sales, and where Belmont Sub 2Nd Add has been over 25 years. Momentum Research analysis of Stellar MLS records; closed sales, deemed reliable but not guaranteed. Estimates only; see data notes.
This home’s $/sq ft vs. nearby sales
List $/sq ft against recent nearby closed sales; the community median is marked.
Price vs. size in Belmont Sub 2Nd Add
Each dot is a closed sale since 2012 (58 total). This home is the gold marker.
Sale price (y) by living area in sq ft (x). Stellar MLS closed sales.
Median $/sq ft by year
Community sold $/sq ft, 2014–2026. This home lists at $356/sq ft.
Median sale price by year
12-month median closed price, 2014–2026.
This home’s history
- 1930BuiltPer public record
- About Feb 2025Listed (per MLS)MLS reports 603 cumulative days on market as of October 20, 2026
- Jul 10, 2026First seen on movewithmomentum.comObserved at $264,500
- NowActiveCurrently for sale
Build year is from public record. The MLS list date is approximate (today minus the cumulative days on market the MLS reports, which can span relistings). Other milestones reflect movewithmomentum.com’s own observations since we began tracking this listing and are not the MLS listing history; dates and prices are deemed reliable but not guaranteed.
Price & listing history
Building permits
Comparable recent sales
4 closed sales in BELMONT SUB 2ND ADD in the last 18 months — same property type, living area within 30% of this home. Sold prices are MLS closed-sale records, deemed reliable but not guaranteed.
Median of these 4 sales: $252,500 ($245/sq ft). Stronger local evidence. Shown for general reference only — not an appraisal or a statement of this home’s value.
The Messtimate
Our automated estimate of the likely sale-price range for this home — modeled from recent closed sales nearby adjusted to today's market, a local size-and-age model, and the county tax roll. It is an estimate, not an appraisal, not market value, and not an offer. A licensed agent's CMA sees the condition, the lot, and the live market that a model can't.
Directional estimate — built from 4 comparable closed sales in BELMONT SUB 2ND ADD (same property type, closed within the last 18 months, each adjusted to today's market).
Track record: across 2,984 recent closed sales we scored, the closed price landed inside the Messtimate range 58% of the time; median miss 9.6% (closed sales statewide, FL + GA feeds that permit an automated estimate). Re-scored weekly; last 2026-10-20.
Actual list price: $264,500 ($356/sq ft) — the seller's asking price is not an input to this range; compare the two.
A 50% spread on the same house — here is what a model can't see:
- Condition & updates — a 1930 home may have had its roof, kitchen, or HVAC replaced since, or not; the model can't see either.
- The lot & views — a premium golf, water, or preserve lot vs. a road-facing one.
- Carrying costs & concessions — insurance, CDD/HOA and seller-paid buydowns change what a buyer actually pays.
And what the live market is doing right now:
- This home: 603 days on market vs. a 16-day community median
- 2 active listings competing
- ≈3.3 months of supply
- 12 closed here in the last 12 months
Selling your own home? Try the Messtimate on your address →
Methodology: 20th–80th percentile band combining time-adjusted $/sq ft of comparable closed sales (4); MLS closed-sale records. Automated valuation model output for general information only — not an appraisal, not market value, not an offer, and not reviewed by a licensed appraiser. Updated October 20, 2026.
Momentum Property Score
60/100 is solid, mid-pack across the objective indicators below. It reflects only those measures — not the home’s quality, condition, or desirability.
A 0-100 score built from objective property and market data: flood risk, insurance, pricing, supply, affordability, and recent sales. Higher means more measures line up in a buyer’s favor. It reflects only the factors below.
Coverage: 6 of 8 indicators had valid data for this home; indicators without data are left out, not scored as zero. Momentum Scores are objective, rules-based indicators computed from listing facts, public records, and recent comparable sales. They do not measure property condition, quality, or investment suitability, and they are not appraisals, valuations, investment advice, or judgments about a neighborhood or who should live there. Verify independently.
The Momentum read
🟢 Buyer-leaning conditions around this listing. 3.3 months of supply in the surrounding market and 603 days on market for this home, against a 16-day area median.Days on market:this home 603Area median: 16 daysWhy it matters: above-median time on market, together with the level of supply, is a clear sign of how much leverage sits with buyers.Momentum Research interpretation of the MLS facts in the snapshot above. Based on Stellar MLS data distributed by MLS GRID for the period 2012 through 2026. As of September 20, 2026.
🟡 Asking $356 per square foot, about 45% above the community’s $245 median. Belmont Sub 2Nd Add’s 12-month median sold price per square foot is $245. Median sold price per square foot is down 2.5% year over year. Confidence: Medium · 10 closed sales in 12 monthsMLS facts: Stellar MLS closed sales. A per-square-foot gap is context, not an appraisal; condition, lot, and view set the final number here.
39% of homes in Belmont Sub 2Nd Add are owner-occupied. An estimated 61% are non-owner-occupied, including 21% held in a company or trust and 11% out-of-state owners.Why it matters: a high owner-occupied share typically means fewer rentals nearby and steadier resale demand.Source: Florida Department of Revenue 2025 assessment roll (public records), 187 homes matched. Community-level context.
Recent Belmont Sub 2Nd Add sales closed near 87.1% of original asking.Why it matters: the community’s own record shows how far opening prices typically move, and how often buyers compete without financing.Momentum Research analysis of Stellar MLS records, community-level, 12 months ending September 20, 2026. Aggregates only; deemed reliable but not guaranteed.
What’s unique here: one of only 3 active listings in Belmont Sub 2Nd Add, no CDD assessment.
Jump to: About this home · Every number, sourced · Monthly cost · Flood & risk · History · FAQ
Updated October 20, 2026 · MLS facts carry their source; interpretation lines are Momentum Research · Data sources & freshness
Seen enough photos?
Want to see 1554 TILLEY AVENUE?
Tell us when works for you and a local agent will reach out to arrange a showing and answer your questions about this home.
Listed by GRACE REALTY & PROPERTY MGMT · MLS # TB8352295
Request a showing
Similar homes for sale near BELMONT SUB 2ND ADD
Active listings nearby at a comparable size and price. Listings held by brokerages other than Momentum Realty are marked with the listing broker. Deemed reliable but not guaranteed.
Newest listings in CLEARWATER
- 1462 Morrow Drive, CLEARWATER · $579,000 · 4 bd / 3.0 ba · listed October 20, 2026 (courtesy of BOSSHARDT REALTY SERVICES LLC)
- 3034 Eastland Boulevard #D202, CLEARWATER · $140,000 · 2 bd / 2.0 ba · listed October 20, 2026 (courtesy of CAPE CORAL SUSAN REALTY INC.)
- 5 S Jupiter Avenue, CLEARWATER · $469,700 · 3 bd / 2.0 ba · listed October 20, 2026 (courtesy of CHARLES RUTENBERG REALTY INC)
- 2455 Golden Pasture Circle, CLEARWATER · $379,000 · 2 bd / 2.5 ba · listed October 20, 2026 (courtesy of PINTES REALTY LLC)
- 2291 Grovewood Road, CLEARWATER · $549,700 · 3 bd / 3.0 ba · listed October 20, 2026 (courtesy of CHARLES RUTENBERG REALTY INC)
- 2501 Harn Boulevard #J12, CLEARWATER · $125,000 · 1 bd / 1.0 ba · listed October 20, 2026 (courtesy of LAMAR PROPERTIES, INC.)
Recently off market in BELMONT SUB 2ND ADD
- 1540 Tilley Avenue · last listed $344,900 · 2026-10-07
- 1500 S Martin Luther King Jr Avenue · last listed $187,000 · 2026-09-24
Just listed: new homes for sale in Central Florida & Tampa Bay in the last 48 hours · updated hourly · RSS · Central Florida & Tampa Bay market today: new listings, price cuts, pendings
More on BELMONT SUB 2ND ADD
Go deeper on BELMONT SUB 2ND ADD
See schools, amenities, builders, HOA/CDD detail, and every active & sold home in the community — the single biggest advantage of buying here over a portal.
Assigned schools
Schools currently assigned to this address in Pinellas County, provided as neutral factual data. Assignments can change — confirm current zoning with the school district. This is not a statement about the home's suitability for any person or family.
Assigned schools per the MLS listing — assignments can change; confirm current zoning with the district. Browse school-zone pages →
City, county & community guides
Where this home sits, with links to the matching guides. General reference only.
Buyer research checklist
Items worth confirming for 1554 Tilley Avenue, chosen from what the record shows. This is general guidance, not advice about this specific property.
- Built in 1930 (96 years): ask for the roof and HVAC replacement dates — insurers commonly ask for roof age on homes this old, and it changes the premium.
- The listing reports no HOA: confirm with the county record that no deed restrictions or mandatory association apply to this parcel.
- FEMA flood zone X: flood insurance is not usually required, but get a quote anyway — FEMA reports roughly one in four flood claims come from outside high-risk zones.
- Get a homeowners insurance quote for this specific address in Pinellas County; a wind-mitigation inspection and, on older homes, a four-point inspection can change the premium.
- Listed living area is 744 sq ft: verify it against the property appraiser's record and measure before relying on it.
- Order a survey to confirm lot boundaries and easements.
- Review permit history with the county.
- Property taxes: the estimate on this page (about $2,777/yr) assumes reassessment at the list price; the seller's current bill is not a guide Exemptions and portability change the actual bill — confirm with the county property appraiser.
- School zoning shown here comes from district data and changes; confirm the assigned schools directly with the district before relying on them.
Data sources & freshness
| Listing record | Stellar MLS, checked against the MLS hourly (last: October 20, 2026) |
| Comparable sales | Stellar MLS closed sales in BELMONT SUB 2ND ADD, last 18 months, as of September 20, 2026 |
| Flood zone & elevation | FEMA flood maps + USGS elevation (Zone X shown above) |
| Taxes & monthly cost | Typical county effective rate applied to the list price; an estimate, not a bill |
| Insurance figure | Modeled estimate; obtain a real quote before offering |
| Schools | 2025-26 district assignments; verify with the district |
Momentum Research lines are our own analysis of Stellar MLS records; MLS data is deemed reliable but not guaranteed. Estimates are informational, not appraisals or advice. Methodology: how Momentum scores are computed.
Frequently asked questions
How big is 1554 Tilley Avenue and when was it built?
Per the listing record, 1554 Tilley Avenue was built in 1930 and has 744 sq ft of living area, 3 bedrooms and 1.0 bathrooms. Living area and lot size come from the MLS record and should be verified against the county property appraiser.
What community is 1554 Tilley Avenue in?
1554 Tilley Avenue is in Belmont Sub 2Nd Add in Clearwater, Pinellas County. The comparable-sales section on this page shows recent closed sales nearby from the same MLS data.
Does 1554 Tilley Avenue have an HOA?
The listing reports no HOA. Confirm with the county record that no deed restrictions or mandatory association apply to the parcel.
Why might property taxes on 1554 Tilley Avenue differ from the current owner's?
The estimate on this page (about $2,777 per year) assumes reassessment at the list price less the homestead exemption. Florida reassesses a home after it sells; for a homesteaded seller the Save Our Homes cap on their assessment does not transfer, and a buyer's own exemptions and portability are applied separately, so the two bills usually differ. Any tax figure shown here is an estimate, not the actual bill — confirm with the county property appraiser and tax collector.
Is 1554 Tilley Avenue in a flood zone?
The FEMA flood map places this parcel in Zone X, outside the special flood hazard area, so flood insurance is not usually required by a lender. It is still available and worth quoting; confirm the parcel's status with FEMA and your insurer.
Can I rely on the figures on this page?
No. Estimated taxes, insurance, payments, and any market or comparable-sales summary are opinions and estimates for general information only and should not be relied upon. Verify all information independently before making any decision.
See 1554 TILLEY AVENUE in person
Private tours available 7 days a week, in person or by live video walkthrough. Request a tour or send a question and a licensed Momentum Realty agent will follow up.
Momentum Realty · licensed in FL & GA
Opinion & estimate — do not rely on this page. Any figure on this page that is not a verbatim fact from the listing or a public record — including estimated property taxes, insurance, CDD/HOA amounts, mortgage payments, comparable-sales summaries, and market statistics — is an opinion and estimate provided for general informational purposes only. These figures may be inaccurate or out of date, are not appraisals, valuations, or financial, legal, tax, or investment advice, and should not be relied upon. Do not make any purchase, offer, financing, or other decision based on this page. Independently verify everything — price, square footage, lot size, year built, taxes, CDD/HOA, flood status, school assignments, permits, and community rules — with the listing broker, the county, your lender, a licensed inspector, an insurer, and your own advisors before acting.
Estimate methodology. Tax estimates apply county millage to the list price (less the homestead exemption where the parcel is matched to the certified roll) and will differ from the actual assessed bill. Cost and market figures are derived from available data and simple calculations, not a professional appraisal. We make no representation that any estimate reflects fair market value.
Equal Housing Opportunity. Content on this page is compiled from public records, MLS data, and automated sources and may contain errors or be out of date. It is general information only, not a representation about any specific property, community, builder, or association. Verify information independently before relying on it. Momentum Realty supports the Fair Housing Act and does not discriminate on the basis of race, color, religion, sex, handicap, familial status, national origin, sexual orientation, or gender identity. Information about schools, distances, and amenities is provided as neutral factual data to help you research the property and is not a statement about who should or should not live here or the suitability of the home or neighborhood for any person or group. School data may change — confirm current assignments with the school district.
Found an error? If you are the owner, listing agent, or a party to this property and believe any information is inaccurate, email and we will review and correct or remove it promptly.
Automated content. Some summaries, distances, and estimates on this page are generated automatically from public and proprietary data sources and may contain errors or omissions. We strive for accuracy but cannot guarantee the completeness or accuracy of any information. Verify anything important independently.
No warranty; measurements & photos. No guarantee, warranty, or representation of any kind is made regarding the completeness or accuracy of any information, descriptions, or measurements on this page — including square-footage measurements and property condition — all of which should be independently verified through appropriate means, including in-person inspection and public records. Photographs may be virtually staged or digitally enhanced and may not reflect actual property conditions. Momentum Realty and its agents expressly disclaim any liability in connection with the information provided.
MLS / IDX. The data relating to real estate for sale on this web site comes in part from the Internet Data Exchange (IDX) program of the Stellar MLS Internet Data Exchange, as distributed by MLS GRID. Real estate listings held by brokerage firms other than Momentum Realty are marked with the listing broker's name and include the name of the listing agent. Data provided is deemed reliable but is not guaranteed by the MLS to be accurate. The information being provided is for consumers' personal, non-commercial use and may not be used for any purpose other than to identify prospective properties consumers may be interested in purchasing. Source: Stellar MLS, as distributed by MLS GRID. Listings courtesy of Stellar MLS as distributed by MLS GRID. All rights reserved.
Listing data is deemed reliable but is not guaranteed and is subject to change or withdrawal without notice. Square footage and lot size are approximate. Real estate brokerage services provided by Momentum Realty, licensed in Florida and Georgia. © 2026 Move With Momentum LLC.