
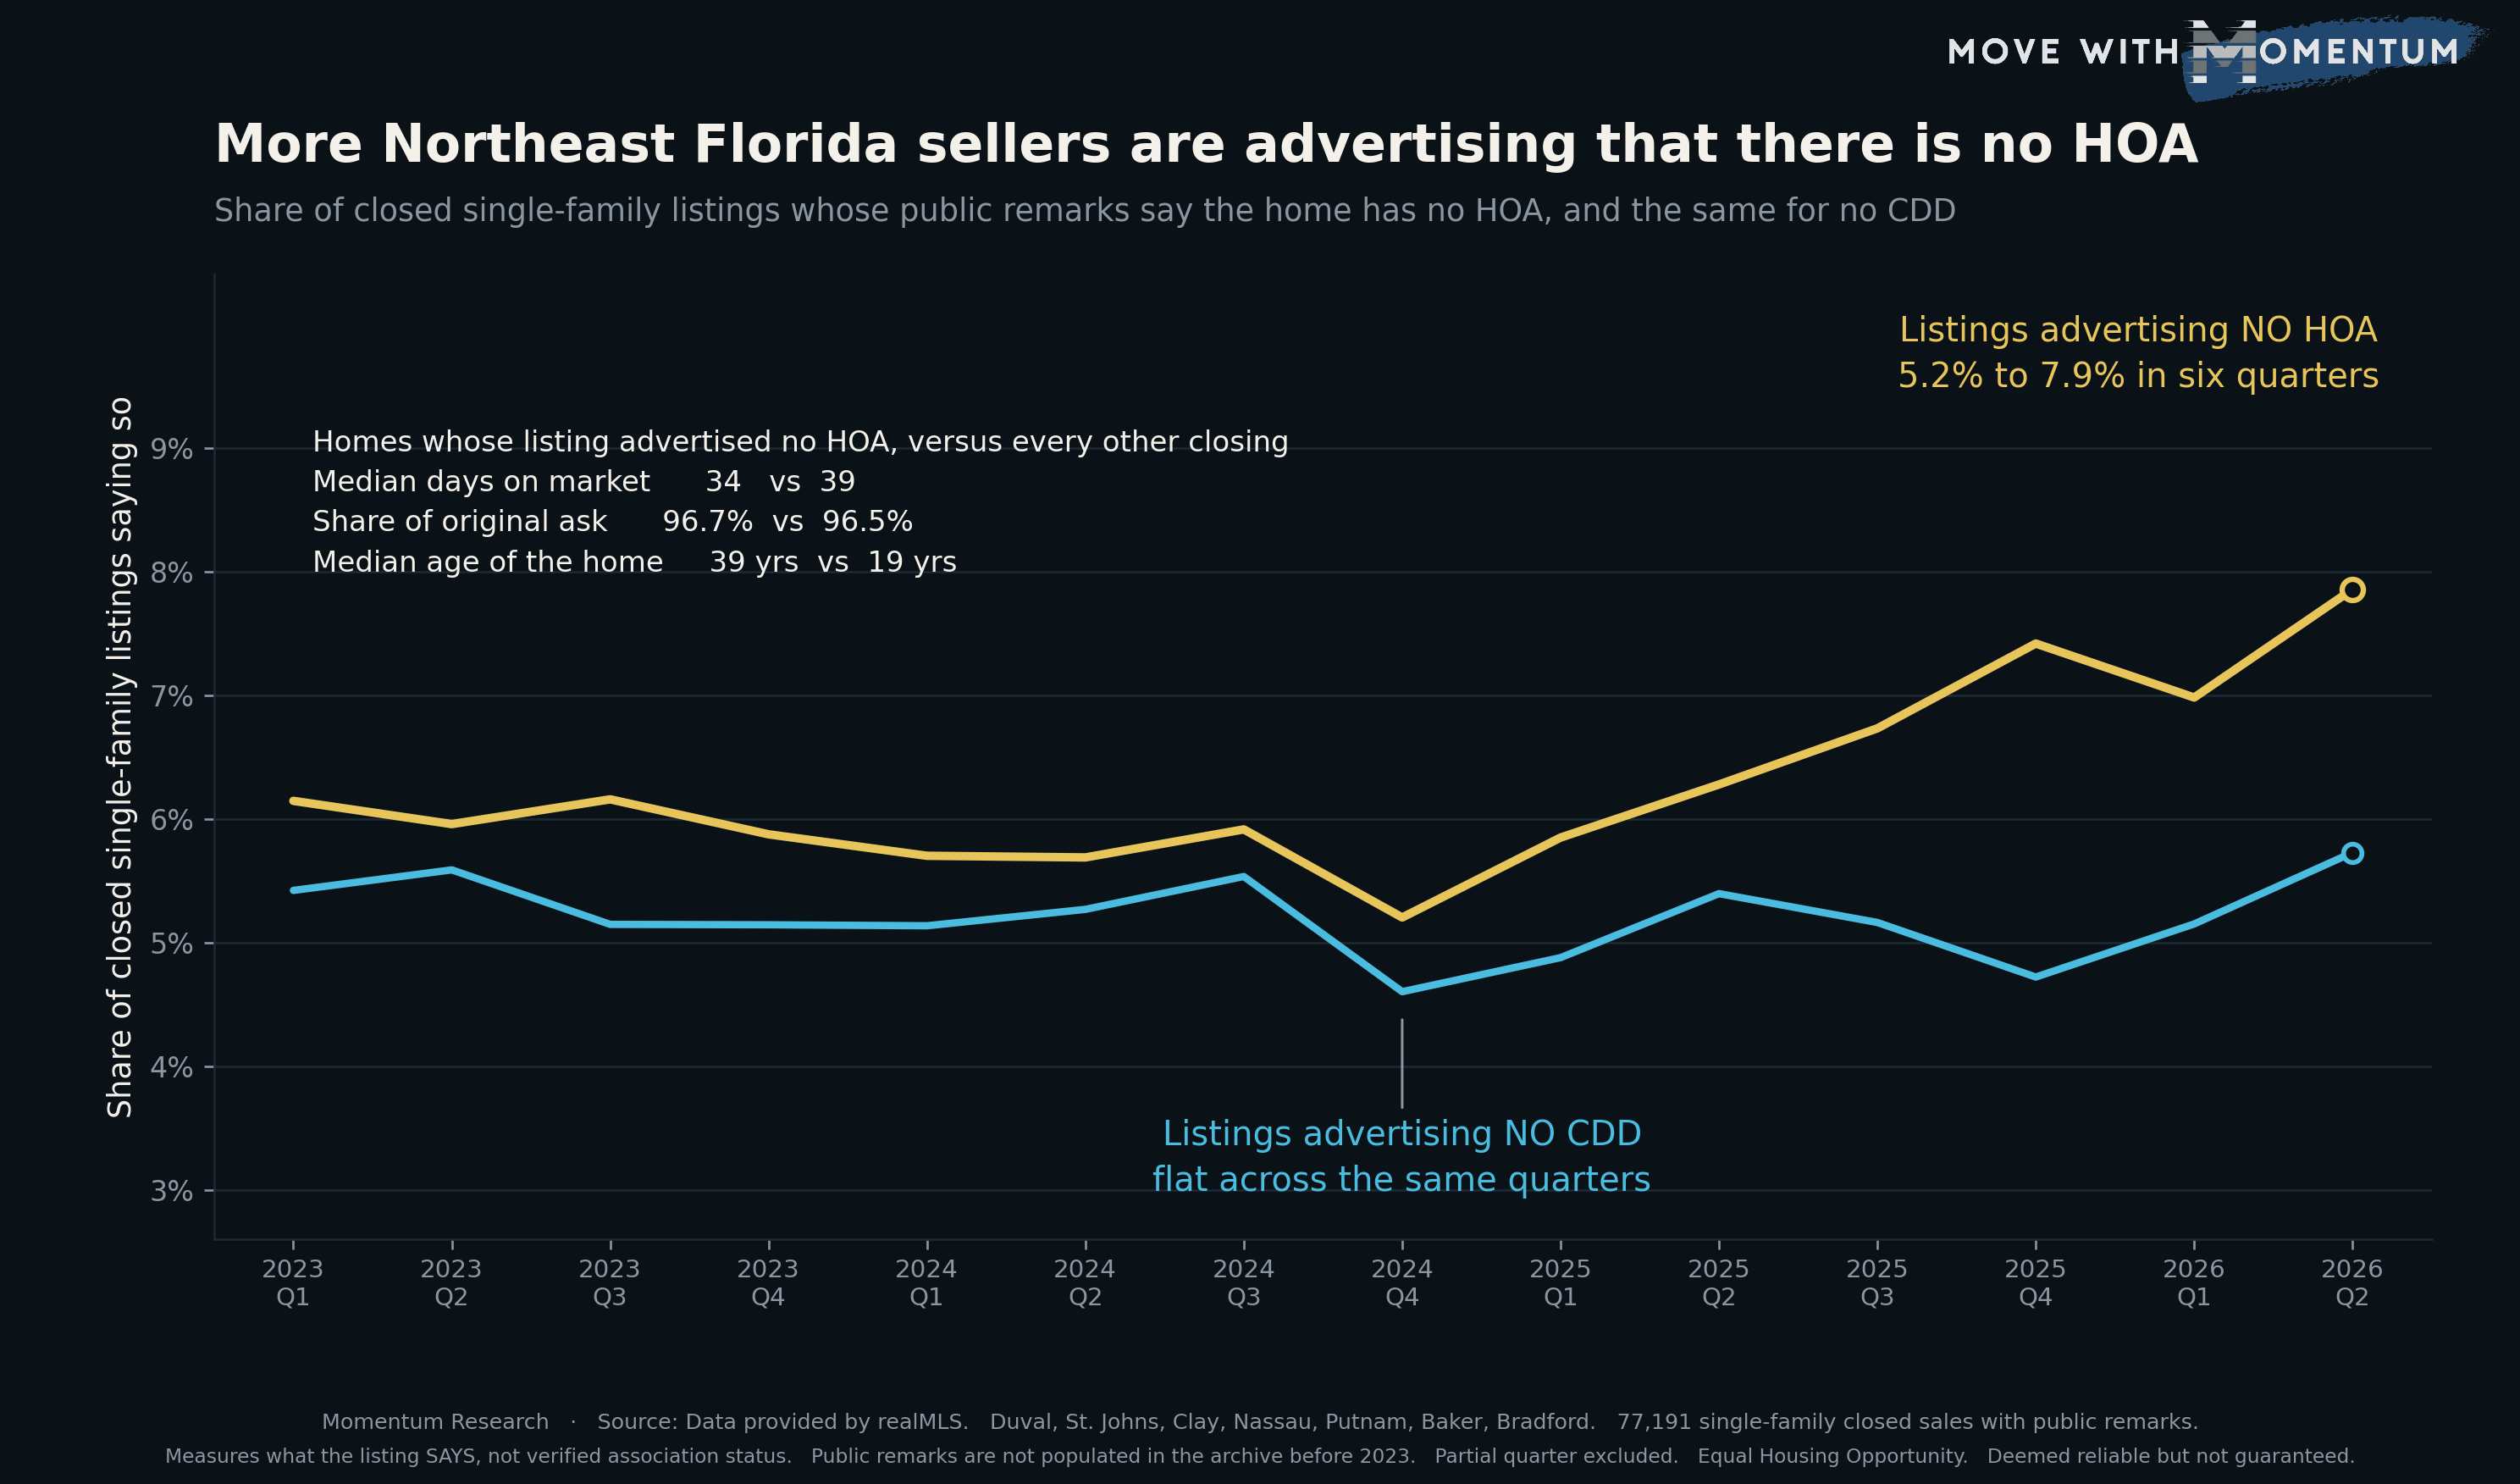
Two words have been showing up more and more often in Northeast Florida listing descriptions: no HOA. In the fourth quarter of 2024, 5.2% of single family homes that closed here had a listing that said so. By the second quarter of 2026 it was 7.9%. That is a rise of about half in six quarters, and it is the clearest trend in the text of our listings that we have measured.
This is not a count of how many homes have no association. It is a count of how many sellers decided that not having one was worth saying out loud. That distinction matters, and we come back to it below.
The share climbed in five of the last six quarters
The series runs 2023 Q1 to 2026 Q2 and covers 77,191 closed single family sales across seven counties. It starts flat, then drifts down: 6.1% in 2023 Q1, 5.7% through the middle of 2024, bottoming at 5.2% in 2024 Q4. From there it turns and climbs almost without interruption, 5.9%, 6.3%, 6.7%, 7.4%, a dip to 7.0% in 2026 Q1, then 7.9% in 2026 Q2, the highest reading in the record.
Roughly one in every thirteen single family homes that closed in Northeast Florida last quarter was marketed, in part, on the absence of a homeowners association.
The control line did not move
A rise like that has an obvious alternative explanation: listing descriptions could simply be getting longer or more detailed, so every phrase would appear more often. There is a clean way to test that, and it is on the chart in cyan.
Northeast Florida has a second recurring carrying cost that sellers advertise the absence of, the community development district assessment, and it is written the same way in the same field by the same agents. Across the identical fourteen quarters, mentions of no CDD went nowhere. They sat between 4.6% and 5.7% the entire time, with no trend, ending at 5.7% against 5.4% at the start.
One phrase moved by half and the other did not move at all. That is what makes this look like a change in what sellers believe a buyer will respond to, rather than a change in the housing stock or in how much agents write.
These homes are older and cheaper, and they still sold faster
Splitting the same 77,191 closings by whether the listing advertised no HOA produces a comparison worth sitting with:
- Median days on market: 34 for the no HOA group against 39 for everything else.
- Share of original asking price captured: 96.70% against 96.46%.
- Median close price: $335,000 against $390,000.
- Median price per square foot: $210.09 against $206.28.
- Median age of the home at sale: 39 years against 19 years.
- Share that were new construction: 15.9% against 24.7%.
Read the last three lines first. The no HOA group is two decades older and much less likely to be new construction. Age normally works against a home on both speed and price per foot. Here the older group sold five days quicker, held a slightly larger share of its original ask, and did it at a higher price per square foot than the newer, more expensive comparison group.
That is the finding. It is not a controlled experiment, and the next section says exactly why.
Where it happens, and where it does not
The share varies a great deal by county, and the pattern follows the housing stock rather than anything about the people in it. Clay County is highest at 8.4% of its single family closings, then Duval at 7.1%, Baker 6.7%, Nassau 6.6%, Bradford 6.5%, Putnam 4.7%. St. Johns County is lowest by a wide margin at 3.8%.
St. Johns is where Northeast Florida built its large master planned communities, and homes inside those communities have associations and often districts by design. A seller there mostly cannot make this claim because it is mostly not true of the inventory. Clay and Duval carry more older subdivision and unplatted rural stock that predates the master planned era, so there is simply more of it to advertise. The county spread is a fact about when and how each county was built, not a ranking.
What this does not prove
Four limits, stated plainly.
This measures the listing, not the deed. Every figure counts what the public remarks say. A home with no association whose agent never mentioned it lands in the comparison group. That makes the comparison group a mixture of homes with associations and homes without, which means any real gap between the two is probably larger than what is measured here, not smaller. It also means the rising line could partly reflect agents getting better at mentioning something that was always true.
The outcome comparison is not controlled. The two groups differ on age, price, construction type and county, and none of that is held constant. Older homes cluster in different places than new construction does, and location drives both speed and price per foot. The honest version of the finding is that homes advertised this way sold faster and closer to ask despite being much older, not that the absence of an association caused it.
The series is short. Public remarks are not populated in our archive before 2023, so there is no way to ask from here what this looked like in 2015 or during the 2021 frenzy. The blank years before 2023 are a gap in the field, not a reading of zero. We hit the same wall on concessions data, which also starts in 2023.
A regular expression is a blunt instrument. The count catches the common ways of writing it, including no HOA, no H.O.A., HOA: none and no association fee. It will miss unusual phrasings and it cannot read intent. Both series are built the same way, so the comparison between them is fair even where the absolute level is understated.
How agents can use this data
Four ways to put this in front of a client without overstating it.
For the buyer weighing two similar homes. The monthly cost of an association is a real number and it is knowable before an offer. Pull the association and district documents on both properties, put the dues and any assessment next to the mortgage payment, and let the buyer compare total monthly cost rather than list price. On a $335,000 home, a $150 monthly due is the payment on roughly $23,000 of additional mortgage at current rates. Some buyers will happily pay it for the amenities. The point is that they should see the number.
For the seller of a home with no association. This is the most concrete takeaway on the page. If the property has no HOA and the listing does not say so, the listing is leaving a differentiator on the table that a growing share of the market is now using. Confirm it in writing first, then put it in the remarks.
For the seller inside an association. The mirror image is not a weakness, but it does need to be answered rather than left blank. Buyers who have been reading no HOA in half a dozen other listings will ask what the dues buy. Have the amenity list, the current dues figure, the reserve position and any planned assessment ready on day one instead of discovering it during due diligence.
For a social or press one liner. The share of Northeast Florida single family listings advertising no HOA has gone from 5.2% to 7.9% in six quarters while mentions of no CDD stayed flat, per Momentum Research analysis of realMLS closed sales. Cite the source line whenever this travels, because the caveat about what is measured travels with it.
People also ask
Do homes without an HOA sell faster in Jacksonville?
Among closed single family sales in the realMLS footprint from 2023 Q1 through 2026 Q2, homes whose listing advertised no HOA sold in a median 34 days against 39 days for all other closings, and captured 96.70% of original asking price against 96.46%. That is measured on what the listing said rather than on verified association status, and the two groups are not otherwise comparable: the no HOA group was a median 39 years old against 19. So the finding is that these homes sold faster despite being older, not that the absence of an association is what made them sell faster. Figures are per Momentum Research analysis of realMLS closed sales and are deemed reliable but not guaranteed.
What percentage of Jacksonville homes have no HOA?
This data cannot answer that, and it is worth being clear about why. What can be measured is how many listings say so: 7.9% of Northeast Florida single family closings in 2026 Q2, up from 5.2% in 2024 Q4. The true share of homes without an association is higher than that, because a listing agent has no obligation to mention it and many do not. By county, the share of closings advertising no HOA ranged from 8.4% in Clay to 3.8% in St. Johns.
Why do Florida sellers advertise no HOA?
The listings themselves do not give a reason, so any explanation is inference rather than a finding. What can be said is that it is a monthly cost a buyer takes on with the address, and that Florida has been through several years of legislative change affecting association and condominium finances, including reserve and inspection requirements. Our roundup of Florida housing laws for 2026 covers what changed. Whether that is why the phrase is appearing more often is not something these figures can establish.
The takeaway
Sellers are telling us something in the one field where they get to write freely. A phrase that describes an absence of a recurring cost is appearing in half again as many listings as it was six quarters ago, while a comparable phrase about a comparable cost did not move at all. And the homes carrying that phrase, which are older and cheaper and less often new, sold faster and held more of their asking price than the rest of the market.
None of that proves an association depresses value. It does suggest that the monthly carrying cost outside the mortgage payment has become a live part of how homes here are marketed, which is the same force we found running through seller concessions and through the wider Jacksonville housing market this year.
Method and limits
Source: data provided by realMLS. Closed single family sales in Duval, St. Johns, Clay, Nassau, Putnam, Baker and Bradford counties, deduplicated on listing identifier and close date, restricted to records carrying public remarks and a valid original list price. 77,191 closings, 2023 Q1 through 2026 Q2. A quarter must carry 3,000 or more closings to be plotted, which excludes the in progress quarter; a complete quarter here runs roughly 4,500 to 6,200.
Both series are built by pattern matching the public remarks field. The no HOA series matches no HOA, no H.O.A., no homeowners association, HOA: none and no association fee. The no CDD series matches the equivalent forms for a community development district. Days on market values below zero or above 730 are excluded from the median. The share of original ask is close price divided by original list price.
Three limits carried from above: this counts what listings say rather than verified association status; the outcome comparison holds nothing constant and the two groups differ materially on age, price and construction type; and the record begins in 2023 because public remarks are not populated before then in this archive, which is a gap in the field rather than a reading.