
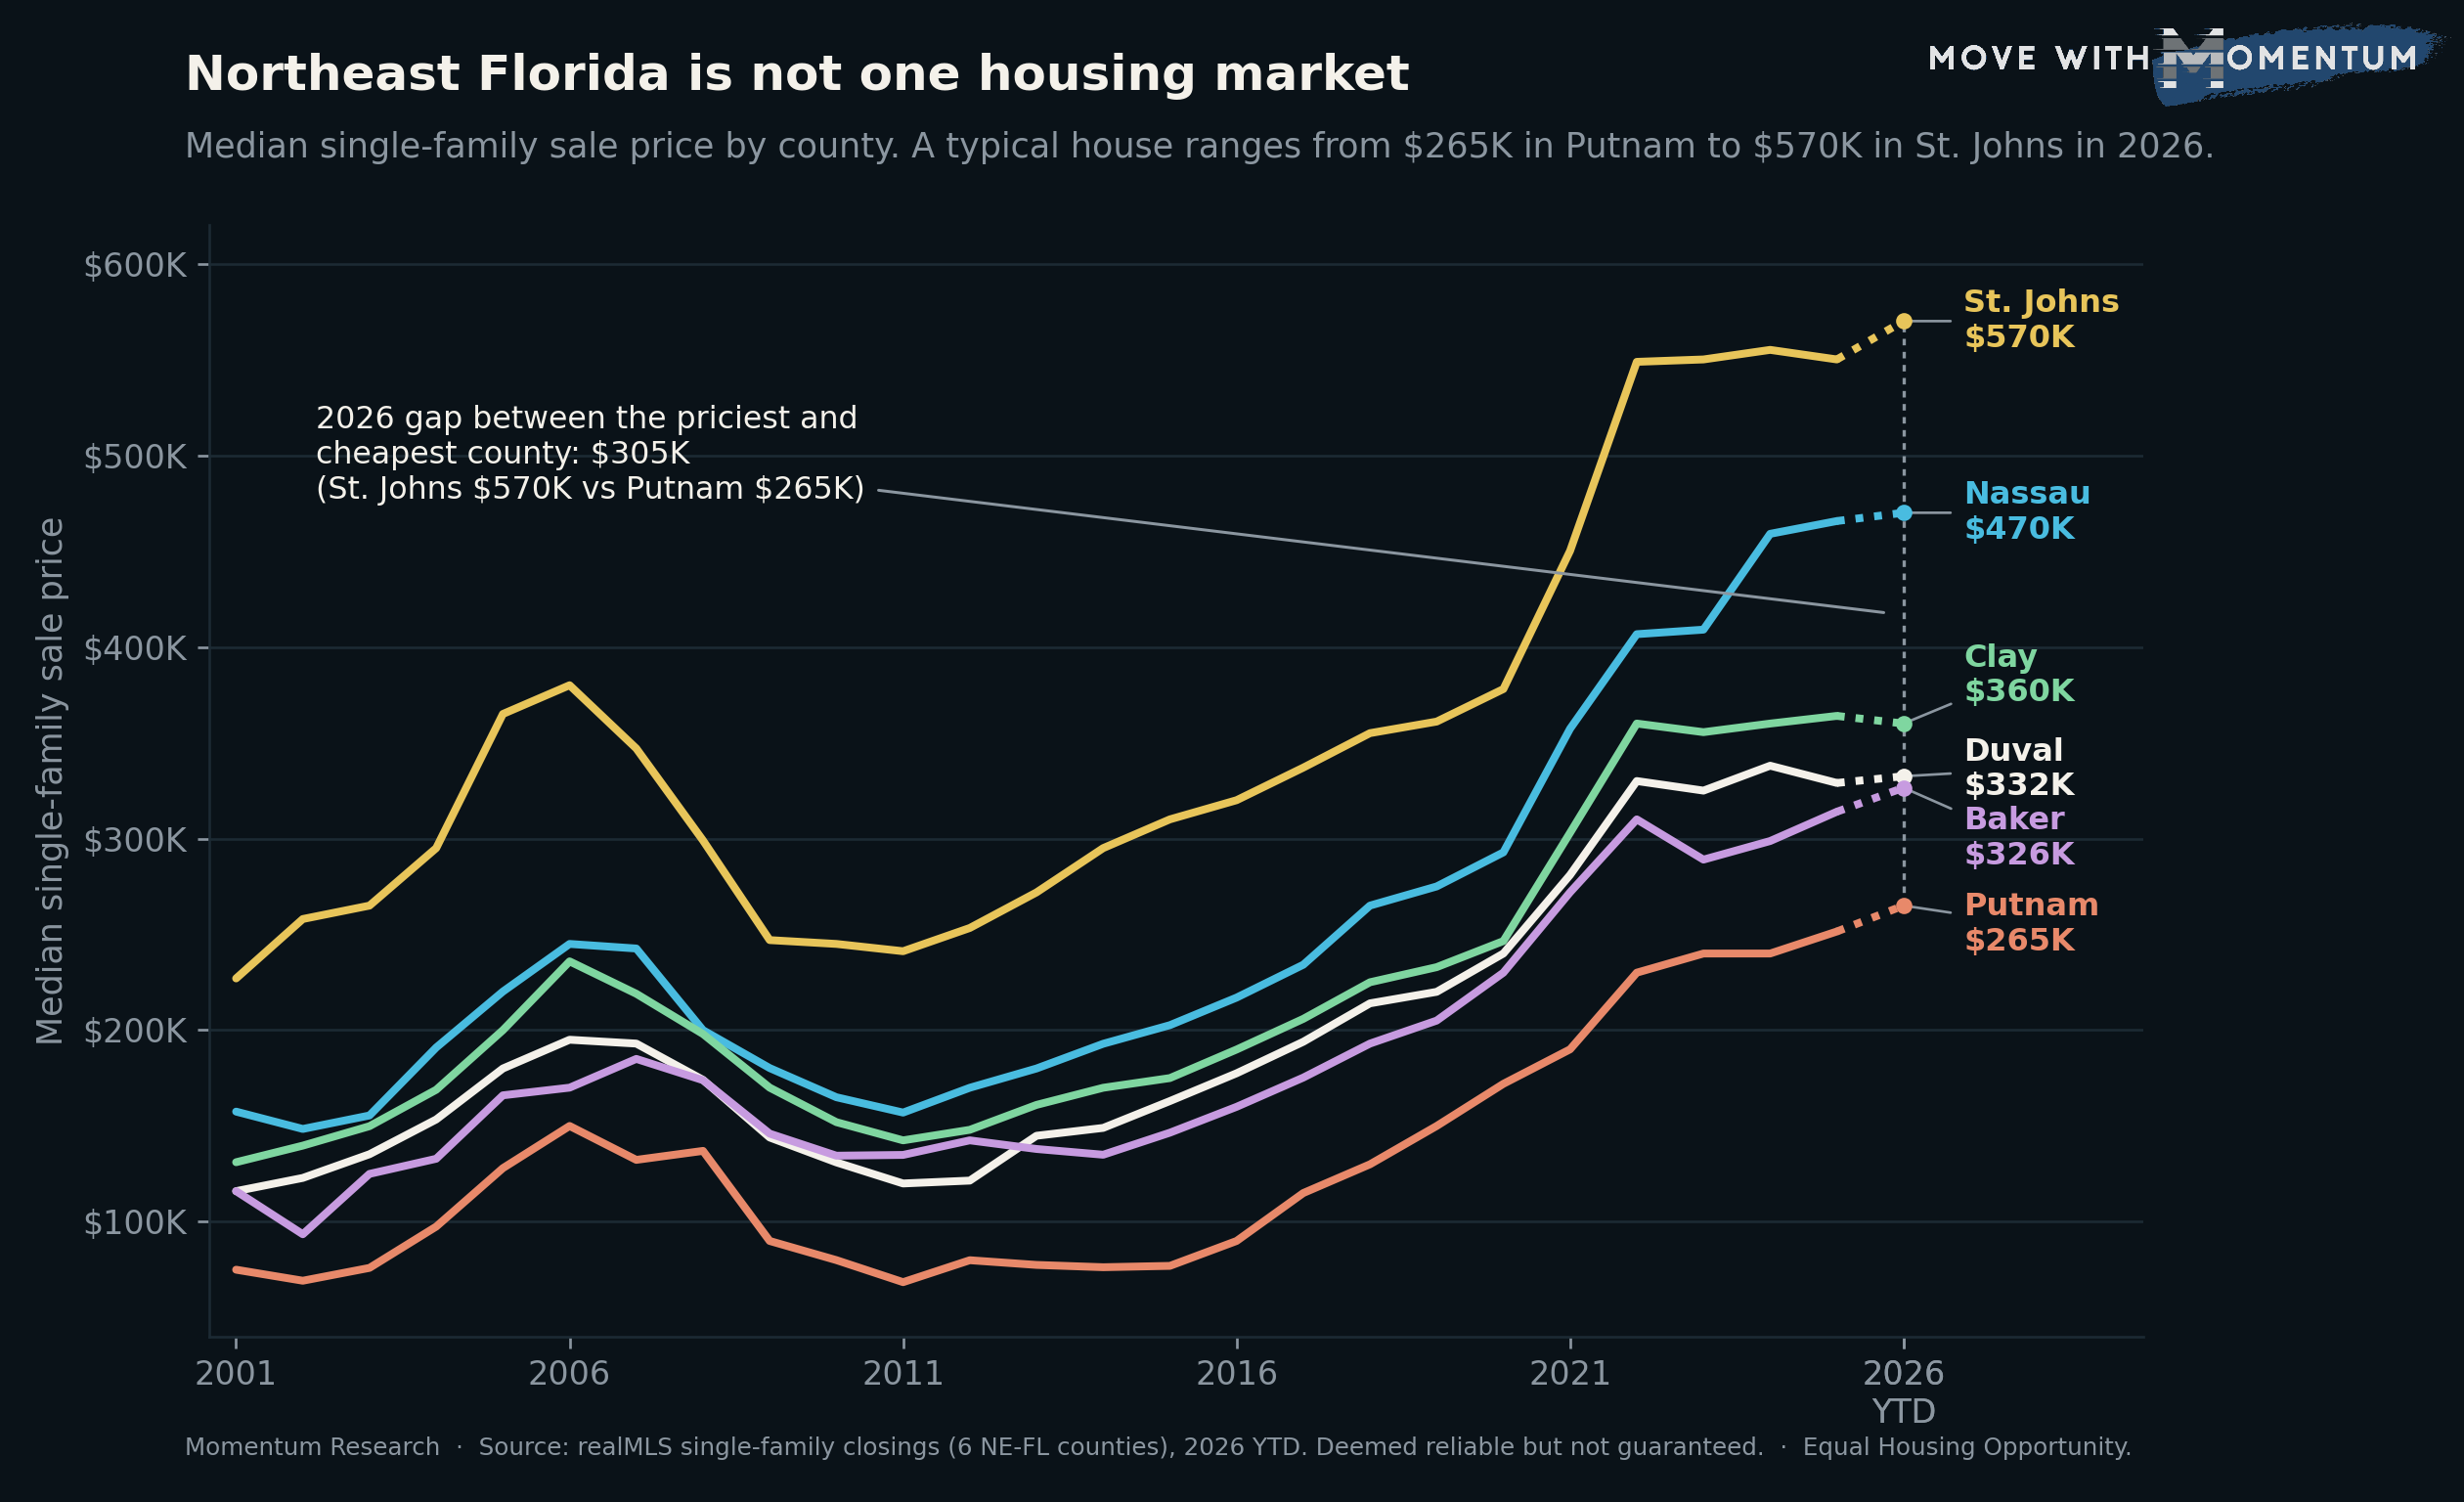
People talk about "the Jacksonville market" as if it were one thing. The closing records say otherwise. In 2026 the median single-family home sells for about $265,000 in Putnam County and about $570,000 in St. Johns County, and everything else sits in between. That is a $305,000 spread between the cheapest and priciest county in the same metro, and it changes what a buyer's budget can reach depending only on which county line they land on.
We took every closed single-family sale back to 2001 across the six realMLS counties, Baker, Clay, Duval, Nassau, Putnam, and St. Johns, and took the median sale price for each county, each year. Measuring it the same way every year makes the pecking order, and how it has shifted, easy to read.
The 2026 order, cheapest to priciest
Here is where the median single-family home lands this year: Putnam about $265,000, Baker about $326,000, Duval about $332,500, Clay about $360,000, Nassau about $470,000, and St. Johns about $570,000. Duval, the population center, sits almost exactly in the middle of the range, not at the top. A buyer priced out of St. Johns can find a median house in Clay for roughly $210,000 less, and in Putnam for more than $300,000 less.
St. Johns has always led, but the dollar gap exploded
St. Johns has been the most expensive county in the region for the entire 25-year record. What changed is the size of the gap in dollars. In 2001 the median St. Johns house cost about $152,000 more than the median Putnam house. By 2026 that same gap is about $305,000. Even though both counties roughly tripled in percentage terms, tripling a big number and tripling a small one pulls them further apart in dollars, which is exactly what a buyer feels when they compare two down payments.
The ratio actually narrowed. St. Johns was about three times Putnam's median in 2001 and is about 2.2 times today, because the 2020 to 2022 surge lifted the cheaper counties by a larger percentage. But almost nobody shops in ratios. They shop in dollars and monthly payments, and in those terms the counties have never been further apart. This is the same affordability squeeze we traced in what a square foot of Northeast Florida now costs, viewed through geography instead of price per foot.
Nassau is the mover
The other story in the chart is Nassau. In 2001 its median sat around $157,000, between Duval and Clay. In 2026 it is about $470,000, second only to St. Johns and roughly $110,000 above Clay. Nassau roughly tripled while adding a large share of newer and higher-priced construction along its growing corridors, and it has pulled clear of the Duval and Clay cluster it used to run with. Clay, Duval, and Baker, meanwhile, still move together in a tight band from about $326,000 to $360,000, which is why those three counties look like one line for most of the chart.
Why the counties differ
The gaps are a story about the homes and the supply, not about who lives where. St. Johns and Nassau carry a larger share of newer and larger new-construction homes and higher-priced coastal and master-planned submarkets, which lifts their medians. Putnam and Baker have older and smaller housing stock and less new construction at the top end, which holds their medians down. Duval and Clay, with the deepest and most varied inventory, land in the middle. None of that is a judgment about any community. It is what the closing prices measure: the mix of houses that actually traded. For the full regional picture, see our Jacksonville housing market data hub.
How agents can use this data
With a buyer comparing counties: put the six medians side by side. The same budget that buys the median house in Clay or Duval near $340,000 is well below the St. Johns median and well above the Putnam one. Framing the search by county median first saves weeks of looking in the wrong price band.
With a buyer anchored on St. Johns but stretched thin: show the neighbors. Nassau, Clay, and Duval offer a median house for $100,000 to $240,000 less, and a Putnam option sits more than $300,000 below. The point is not to steer anyone anywhere; it is to lay out the price map so the buyer can decide what tradeoffs fit their budget.
With a seller pricing a home: anchor to the county, not the metro headline. A seller in Duval who reads a St. Johns comp, or a Putnam seller who reads a Nassau one, will misprice by six figures. The county median is the right starting anchor before you adjust for the specific home.
On social or with press: the chart carries it. One line: a typical Northeast Florida house ranges from about $265,000 in Putnam to $570,000 in St. Johns in 2026, a $305,000 spread inside one metro.
Keep it about homes and prices, never about who lives where. Cite the source line below if you quote the numbers, and never present them as guaranteed.
People also ask
How much does a house cost in Northeast Florida in 2026?
It depends heavily on the county. In 2026 the median single-family sale price ranges from about $265,000 in Putnam County to about $570,000 in St. Johns County, with Baker about $326,000, Duval about $332,500, Clay about $360,000, and Nassau about $470,000, per Momentum Research analysis of realMLS closings.
Which Northeast Florida county has the most affordable homes?
Putnam County has the lowest median single-family sale price in the region at about $265,000 in 2026, followed by Baker at about $326,000 and Duval at about $332,500. St. Johns is the highest at about $570,000, per realMLS closing records.
Why is St. Johns County so much more expensive than Duval County?
St. Johns has carried a higher median price than Duval for the full 25-year record, running roughly 60 to 100 percent above it. The gap reflects the mix of housing sold there, including a larger share of newer and larger new-construction homes and higher-priced coastal submarkets, per realMLS closing data. It is a story about the homes and the supply, not about who lives where.
The takeaway
A single "Northeast Florida home price" hides more than it tells. The median house runs from about $265,000 in Putnam to $570,000 in St. Johns in 2026, the widest dollar spread in the 25-year record, and Duval sits in the middle rather than at the top. For buyers and sellers, the practical lesson is to start with the county median, then adjust, because the county line is worth six figures. For how the whole region has moved on price per foot, see our price-per-square-foot breakdown. Data reflects closed single-family sales in the realMLS footprint and is deemed reliable but not guaranteed. This is general information, not investment advice.
Momentum Research. Equal Housing Opportunity.
This article was compiled with the help of automated tools from realMLS closing records and may contain errors. Information is deemed reliable but not guaranteed. It is for general information only and is not financial, investment, legal, or tax advice. Verify all facts independently before relying on them. Source: Momentum Research analysis of realMLS closed single-family sales, Baker, Clay, Duval, Nassau, Putnam, and St. Johns counties, median close price by county and year, 2001 to 2026 YTD.