
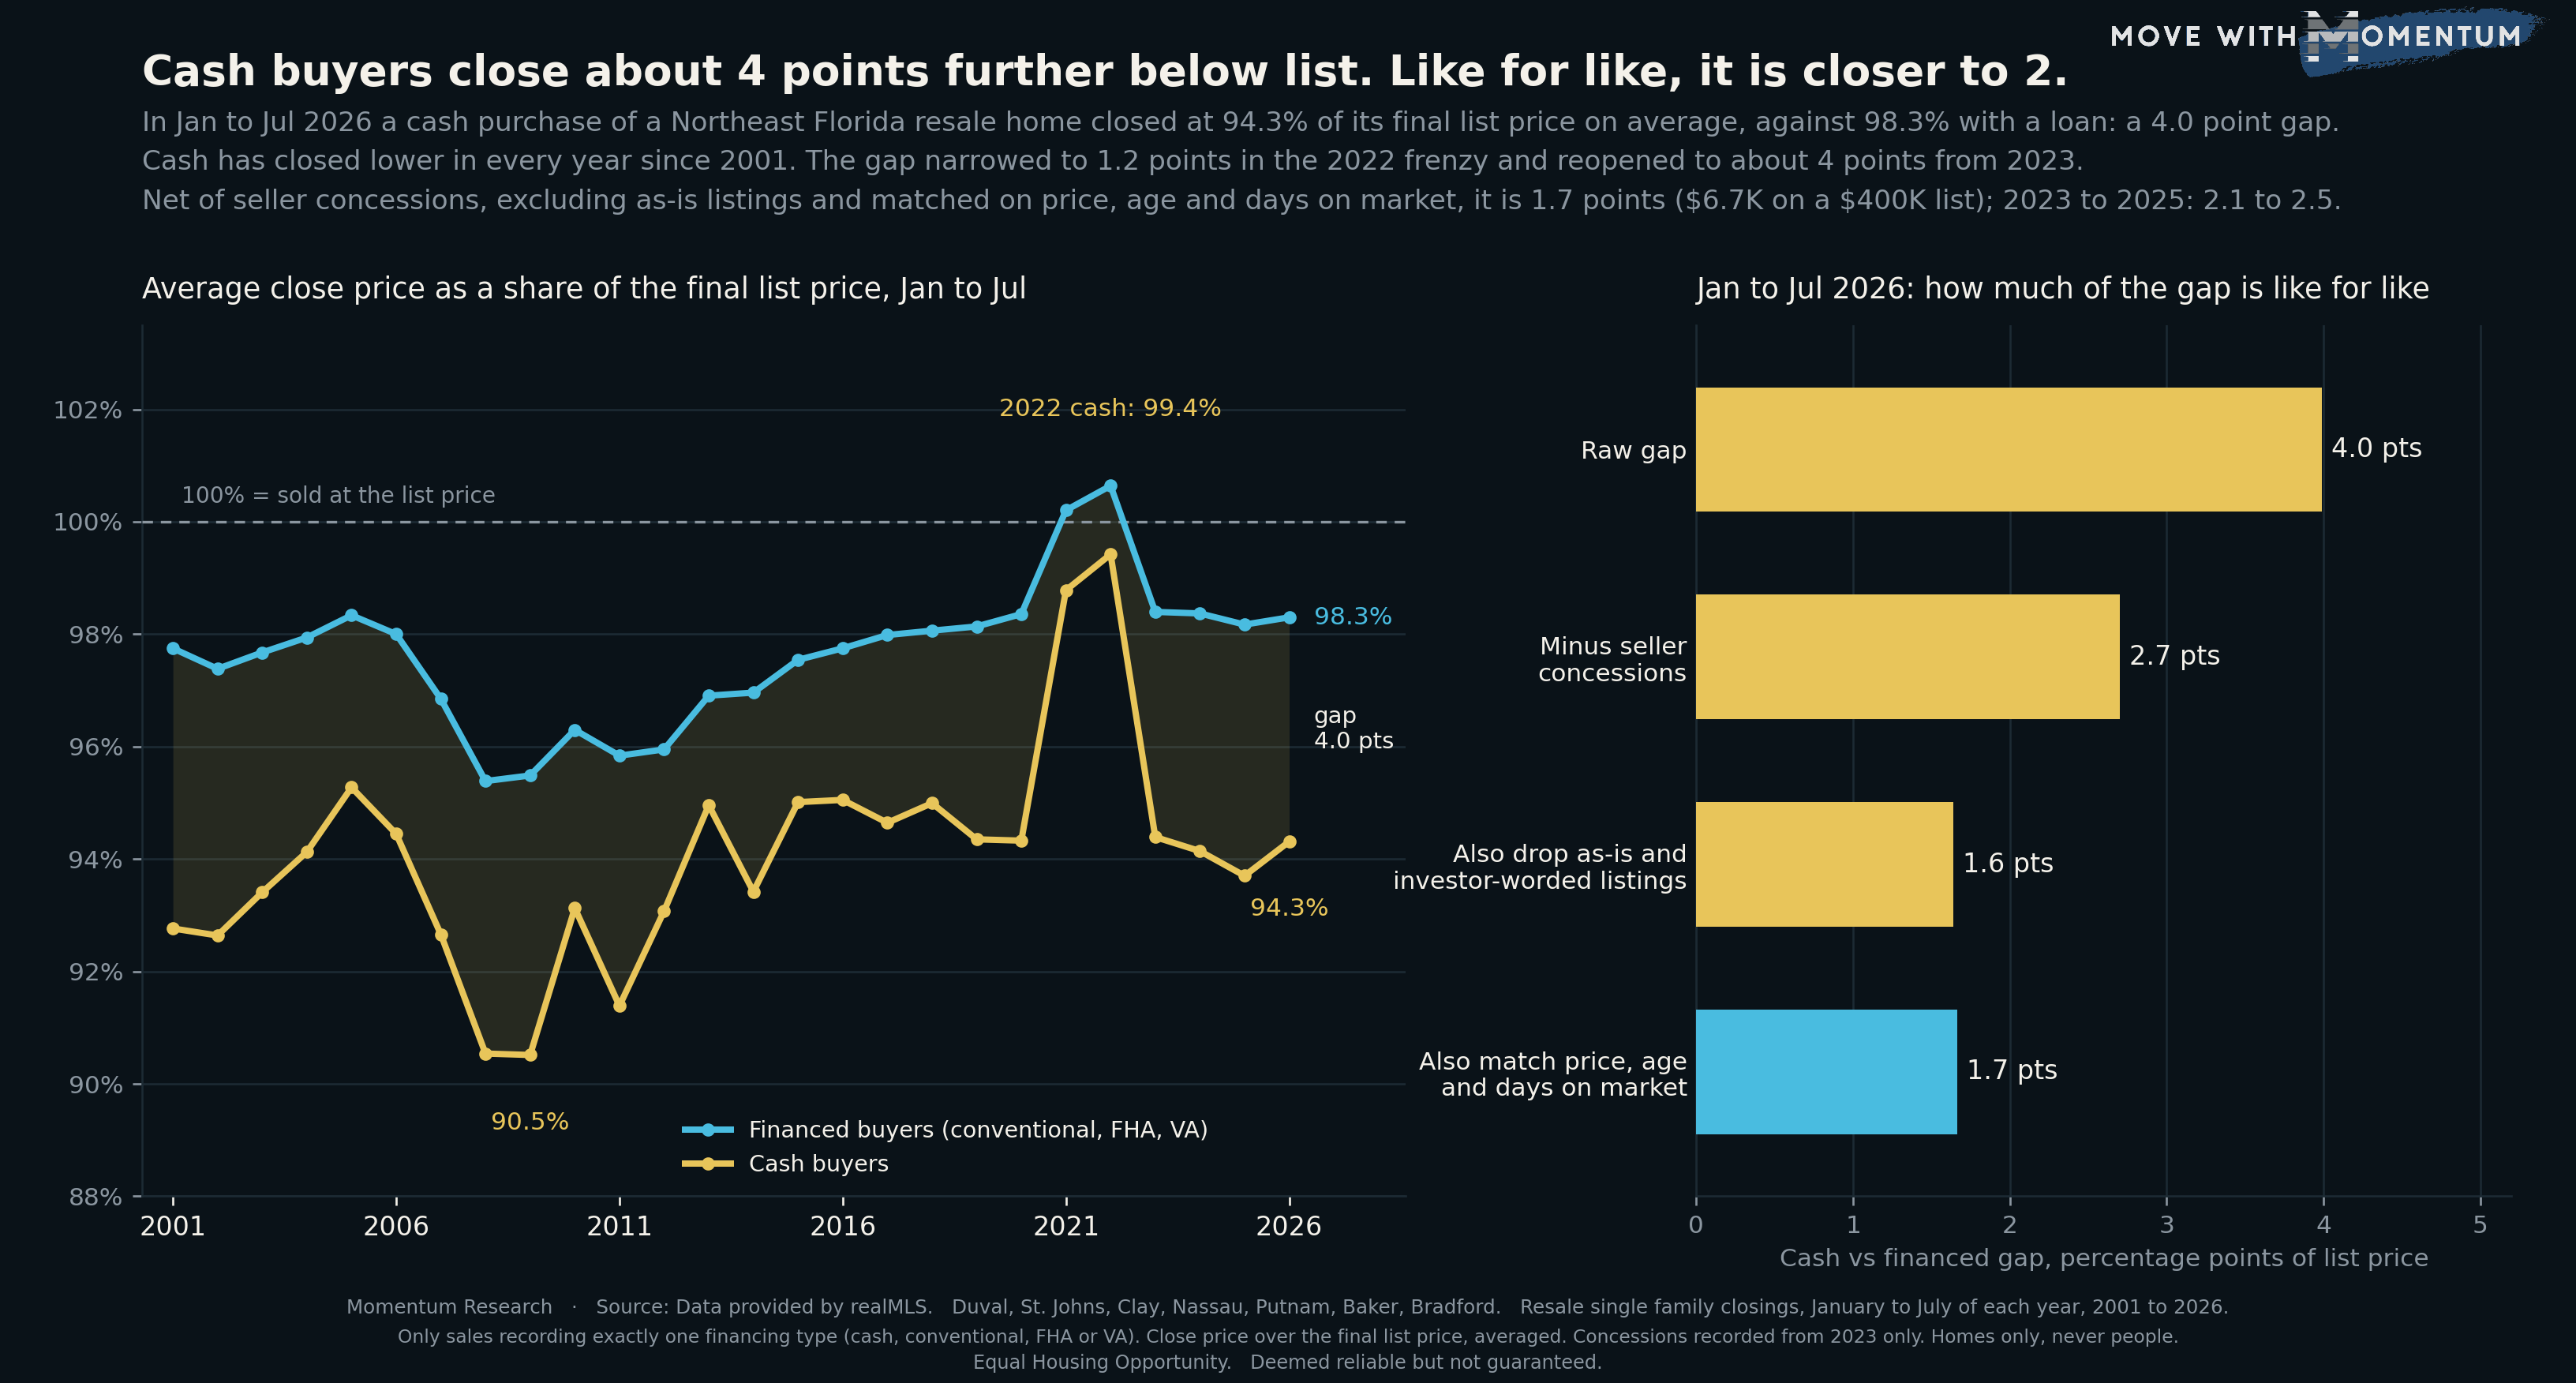
A cash offer is often pitched as worth a discount: no appraisal, no loan approval, a faster close. The closing records show cash buyers of Northeast Florida resale homes do finish further below the list price. In January to July 2026 a cash purchase closed at an average of 94.3% of the final list price, against 98.3% for a purchase with a conventional, FHA or VA loan. That is a 4.0 point gap, about $16,000 on a $400,000 list price.
Most of that gap is not the cash itself. Once the comparison is made like for like, it shrinks to about 1.7 points. This piece shows how the gap has moved over 25 years, what explains most of it, and what is left.
How the cash gap was measured
The method takes resale single family closings in the seven counties realMLS is authoritative for, January through July of every year from 2001 to 2026. The archive runs through August 13, 2026, so July is the last complete month, and every year is cut to the same seven months. Only sales that recorded exactly one financing type, cash, conventional, FHA or VA, are counted; 9,659 sales qualified in 2026, 2,486 of them cash. For each sale the close price is divided by the final list price, and the ratios are averaged. A handful of ratios below 50% or above 150% are dropped as entry errors.
Twenty-five years of the cash gap
Cash has closed further below list than financed purchases in every year of the archive. The gap was about 5 points in 2001 and again in 2009, when cash purchases averaged 90.5% of list. It narrowed in the 2021 and 2022 run-up, when nearly every home sold near or above its asking price: in 2022 cash averaged 99.4% and financed 100.6%, a gap of 1.2 points. It reopened to 4.0 points in 2023 and has stayed between 4.0 and 4.5 points since, 4.0 in 2026.
The gap also depends on price. Among 2026 listings under about $269,000, cash closed at 90.9% of list against 98.9% financed, a gap of 8.1 points. From about $460,000 up it was about 1.5 points. In that lowest price fifth, 39% of 2026 purchases were cash and 34% of the homes had remarks using as-is or investor wording, against 2% to 7% in the other price fifths. That points to the explanations below.
What explains most of the gap
Seller concessions. A financed buyer is far more likely to ask the seller to pay part of the closing costs, and that money is often added into the contract price. In January to July 2026, 74% of FHA purchases, 63% of VA purchases and 46% of conventional purchases recorded a concession, against 15% of cash purchases. Subtracting the recorded concession from each close price cuts the cash gap from 4.0 to 2.7 points. It also erases most of the apparent FHA premium: on the gross price FHA purchases averaged 99.2% of list and conventional 97.8%, but net of concessions they were 96.9% and 96.6%. The concession field exists only from 2023, so this adjustment cannot be made for earlier years.
Condition. 22% of cash purchases in 2026 were of homes whose public remarks used words like as-is, investor, fixer, handyman or needs work, against 3% to 9% for the loan types. Some of those homes may not qualify for a loan at all. Setting them aside as well brings the gap to 1.6 points. Remarks are available from 2023 only.
Which homes. Finally, comparing cash and financed purchases only within the same list price fifth, the same build era and the same days-on-market band gives 1.7 points, so the remaining gap is not explained by cash buying different price levels, older homes or homes that had been sitting. Run the same way, the like-for-like gap was 2.5 points in 2023, 2.1 in 2024 and 2.1 in 2025.
Rival explanations we tested
- Averages pulled by a few deep discounts. On the median instead of the mean, cash closed at 96.4% of list and financed purchases at 98.9% in 2026, a 2.5 point gap. The median narrows the raw gap but does not remove it.
- Final list price hides earlier cuts. Measured against the original list price, cash averaged 91.7% and financed 95.7% in 2026, a gap of 4.0 points, the same as against the final list price.
- Partial year. The full calendar 2025 gap was 4.4 points against 4.5 for January to July 2025, so the seven-month window is not creating the result.
- Matching alone. Matching on list price, build era and days on market without the concession and condition adjustments leaves 3.9 points in 2026. Matching on those three measures is not what closes the gap; concessions and condition are.
What this cannot capture: the remarks screen is a word search, not an inspection, so some homes in poor condition remain in the comparison and some well kept homes that mention investors were removed. Appraisal gaps, inspection repairs credited outside the contract and the timing of offers are not in the data.
How agents can use this data
- Compare cash and financed offers on net proceeds, not the headline price. A full-price financed offer that asks for a 3% seller concession nets the seller about what a cash offer 3% below list would, before other costs. In 2026, the average gross gap of 4.0 points was 2.7 net of concessions.
- Use the like-for-like figure when a cash buyer asks for a discount. For comparable homes, cash closed about 1.7 to 2.5 points further below list from 2023 to 2026, roughly $7,000 to $10,000 on a $400,000 list price. Larger discounts in the raw data mostly come from lower priced and as-is listings.
- Read price-band context before quoting a number. Under about $269,000 the 2026 gap was 8.1 points; from about $460,000 up it was about 1.5. A single regional figure overstates the gap for most homes above the entry level.
- Adjust comps by financing where the difference matters. A comparable sale that closed with a large concession, or a cash sale of an as-is listing, can sit a few points away from the market level for a home in ordinary condition.
Whichever way you use the numbers, cite the source: Momentum Research analysis of data provided by realMLS, resale single family closings January to July 2001 through 2026, deemed reliable but not guaranteed.
What this measurement does not do
It does not forecast, and it does not say what any one offer is worth or whether a particular seller should accept it. It measures closed sales only, not offers that were made and declined. It describes homes and transactions, the financing recorded on each closing, never the people who bought or sold them, and it should be read alongside a current comparable-sales analysis rather than in place of one.
People also ask
Do cash buyers get a discount on houses in Jacksonville?
On average they close further below the list price, but less than the raw number suggests. In January to July 2026, Northeast Florida resale homes bought with cash closed at 94.3% of the final list price, against 98.3% for homes bought with a conventional, FHA or VA loan, a gap of 4.0 points. After subtracting seller concessions, setting aside listings advertised as-is or to investors, and comparing homes of similar list price, age and days on market, the gap was 1.7 points, about $6,700 on a $400,000 list price. The same like-for-like gap was 2.1 to 2.5 points in 2023 to 2025.
Why do FHA and VA buyers seem to pay closer to the asking price?
Largely because of seller concessions. In January to July 2026, 74% of FHA purchases and 63% of VA purchases recorded a seller concession, against 46% of conventional and 15% of cash purchases. Concessions are often built into the contract price, so the close price looks higher. On the gross close price, FHA sales averaged 99.2% of list and conventional 97.8%; net of concessions the two were 96.9% and 96.6%, nearly the same.
How far below asking do cash offers close in Jacksonville?
It depends heavily on price. In January to July 2026, cash purchases of homes listed under about $269,000 closed at 90.9% of list on average, 8.1 points below financed purchases in the same price band, a band where about a third of the 2026 closings had remarks using as-is or investor wording. For homes listed from about $460,000 up, the cash gap was about 1.5 points. Those are averages of what closed, not a guide to what any single seller will accept.
Method and limits
Source: data provided by realMLS. Closed resale single family sales (NewConstructionYN false, PropertySubType Single Family Residence) in the authoritative counties of Duval, St. Johns, Clay, Nassau, Putnam, Baker and Bradford. Records are deduplicated on listing id plus close date. Only sales whose recorded buyer financing is exactly one of cash, conventional, FHA or VA are included; sales with more than one financing type or another type are excluded. Close prices under $10,000 and sale-to-list ratios below 0.5 or above 1.5 are excluded. The window is January through July of every year; the archive ends on August 13, 2026, so July is the last complete month.
The measure is close price divided by the final list price, averaged by financing type; "financed" pools conventional, FHA and VA. Seller concessions (recorded from 2023 only; absence before 2023 is an archive limit, not a zero) are subtracted from the close price for the net figures. The condition screen drops listings whose public remarks (2023 onward) match as-is, investor, fixer, TLC, handyman, flip, cash only or needs work. The matched gap compares cash with financed purchases within cells of list price fifth, build era (before 1970, 1970 to 1989, 1990 to 2004, 2005 on) and days on market (7 or fewer, 8 to 30, 31 to 90, over 90), with at least 5 of each in a cell, weighted by cash purchases.
Nothing is controlled for inspection results, lot, view or renovation beyond the listing remarks. Cause is not identified.
Related reading on the same archive: how seller concessions work as a hidden discount, how long a contract takes to close by loan type, how far below asking Jacksonville homes sell and the ongoing Jacksonville housing market tracker.
All figures on this page are per Momentum Research analysis of data provided by realMLS and are deemed reliable but not guaranteed. Equal Housing Opportunity.