
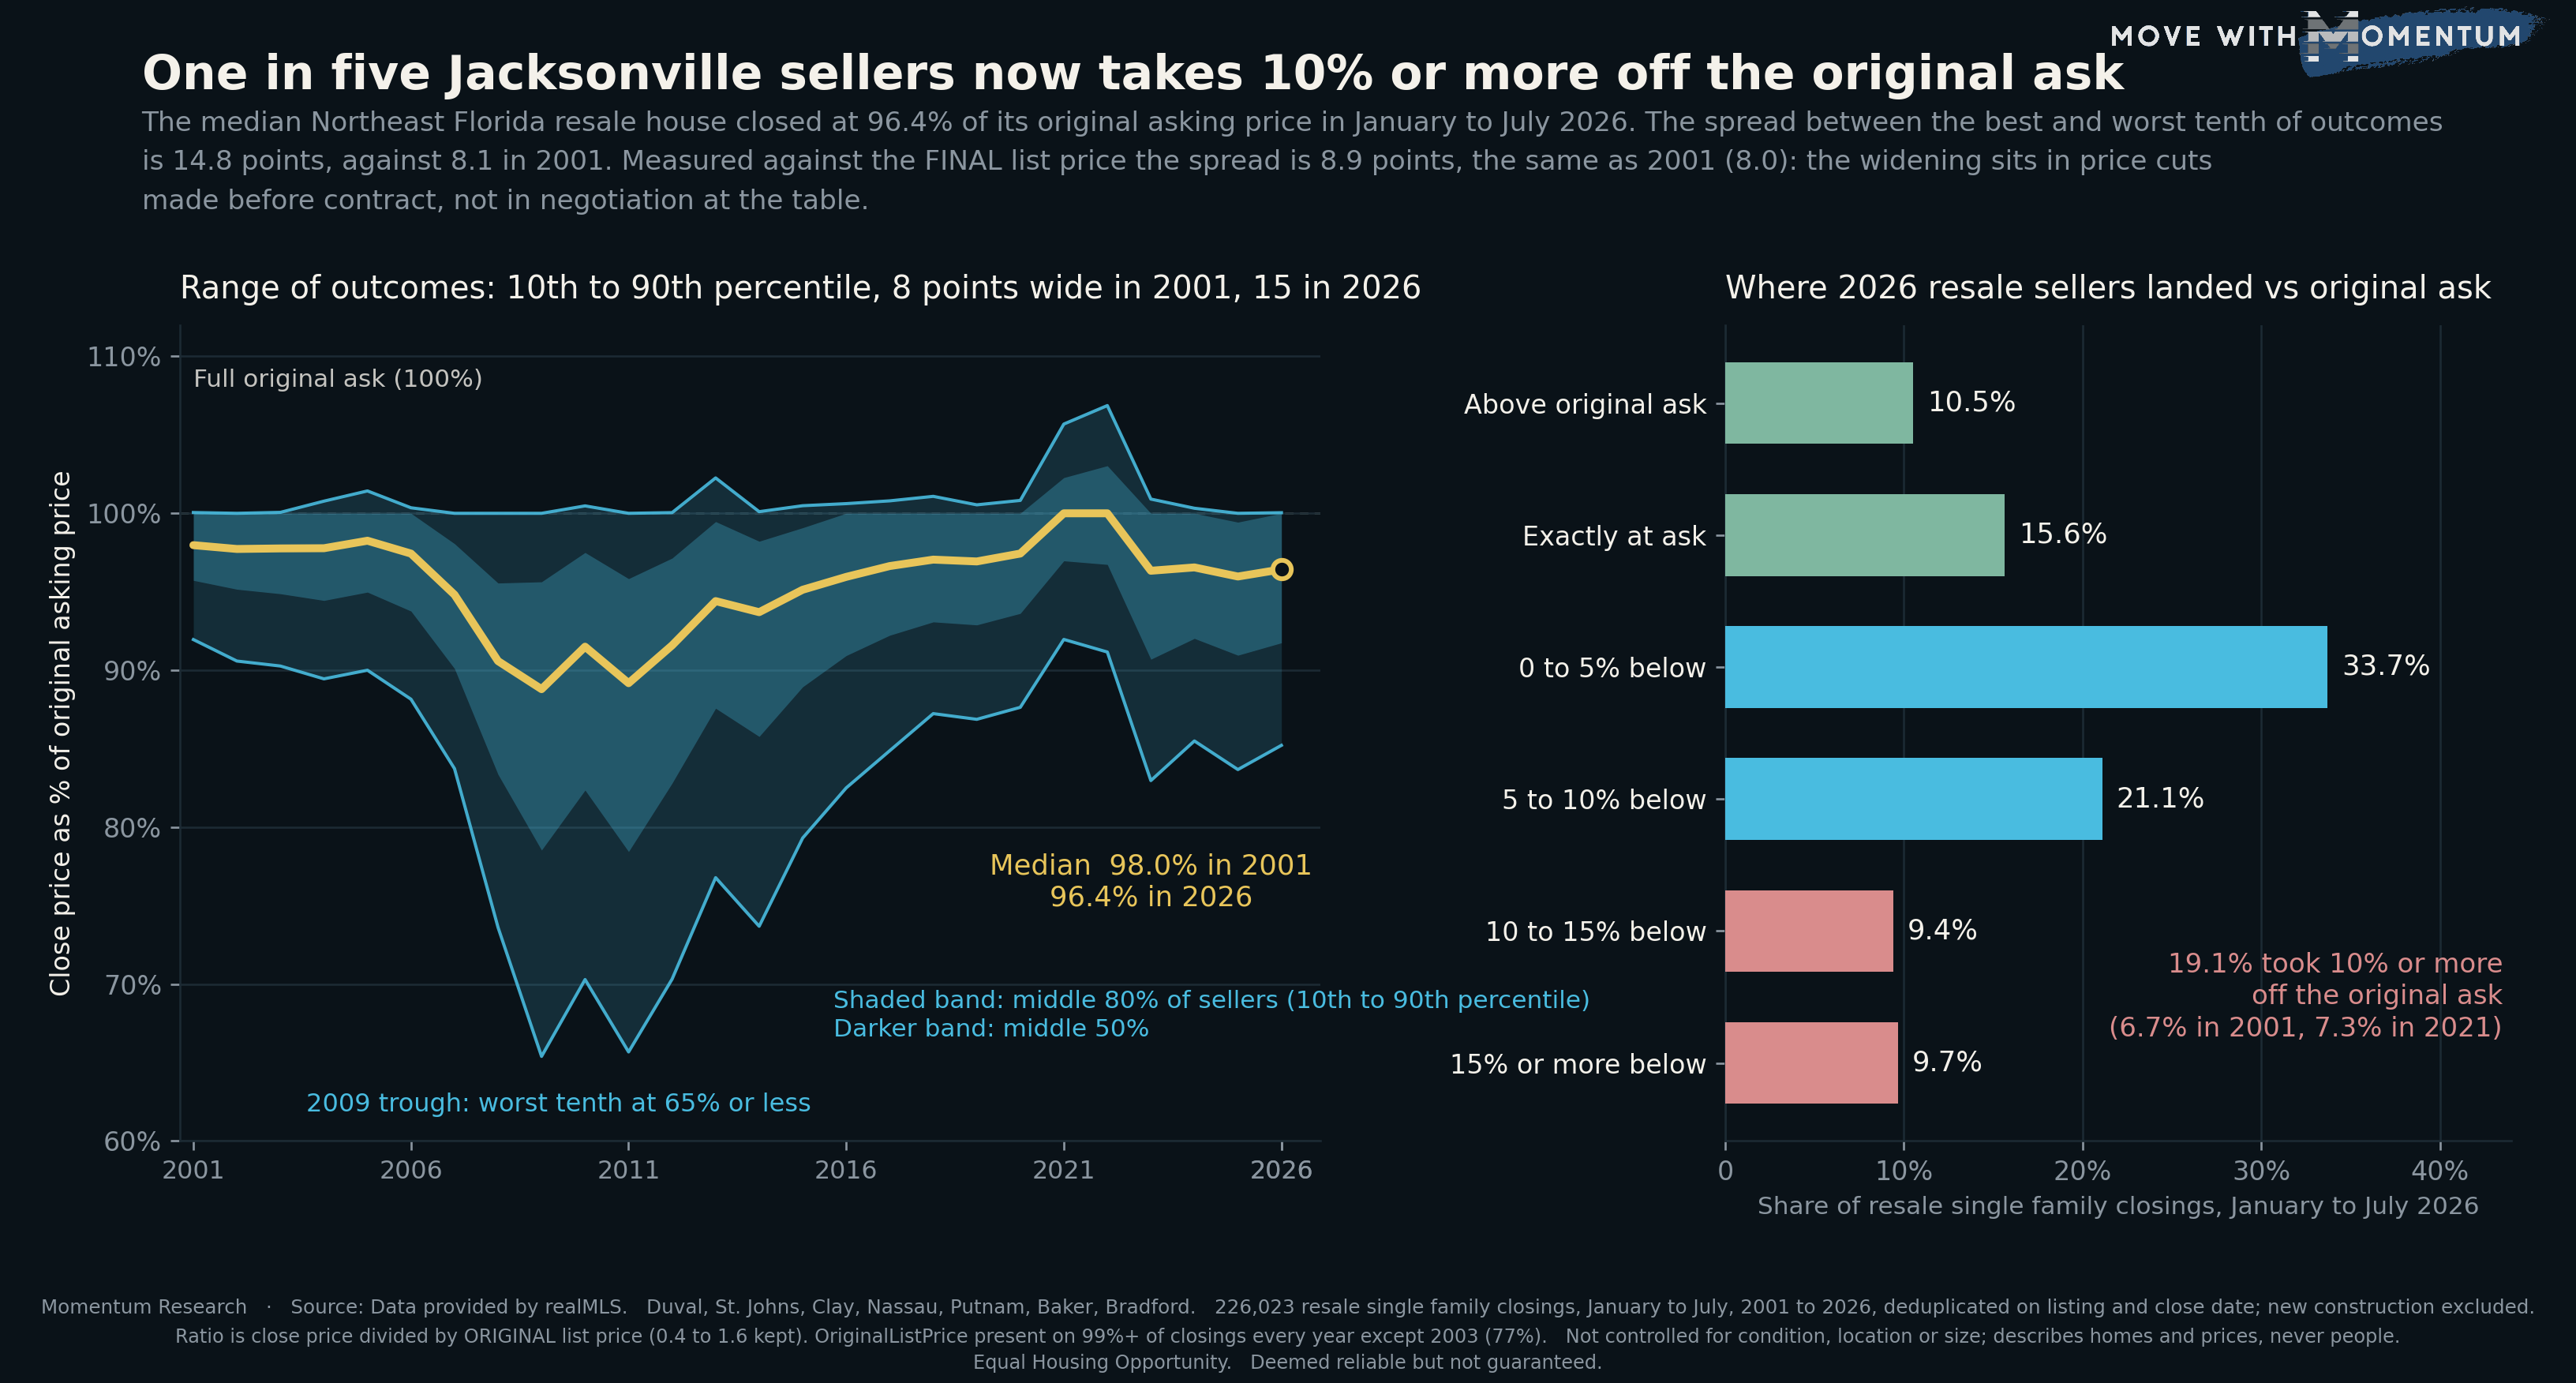
The usual answer to "how much below asking do Jacksonville homes sell for" is a single number, and in 2026 that number is about 3.6%. The median resale single family home in the seven realMLS counties closed at 96.4% of its original asking price in January to July 2026. That is a true figure and a nearly useless one, because almost nobody sells at the median. A quarter of sellers got their full original ask or more. A fifth took 10% or more off it. The distance between those two groups is the story, and it has roughly doubled since 2001.
We took every closed resale single family sale in the seven realMLS counties back to 2001, deduplicated on listing id plus close date, excluded new construction, and divided each close price by the ORIGINAL list price, the number the listing went live at, not the number it was cut to. Every year uses January through July so a partial 2026 is measured against the same seven months of every earlier year. That is 226,023 closings with a usable ratio.
The median says 96.4%. The range says 85% to 100%.
Line up the 2026 sellers from worst outcome to best. The seller at the 10th percentile closed at 85.2% of original ask. The seller at the 90th percentile closed at 100.0%. So the middle 80% of sellers span 14.8 points of the original asking price. In 2001 the same two markers were 92.0% and 100.1%, a span of 8.1 points. The best outcome has not moved. The worst outcome has fallen seven points.
Between those years the range blew out and came back. It was 12.2 points in 2006, 26.4 in 2008, a record 34.6 in 2009 (worst tenth at 65.4% or less), still 25.5 in 2013, back to 13.2 in 2020, and 13.7 even in 2021 when the median hit 100% and the range was all on the upside. It widened again to 17.9 in 2023 and has sat at 14.8 to 16.3 since. It has not been inside the 2001 to 2005 band of 8 to 11 points at any point in the last twenty years.
Where 2026 sellers actually landed
The right panel of the chart is the same 9,931 closings sorted into six bins by how the close price compared to the original ask:
- Above original ask: 10.5% (10.3% in 2001, 39.0% in 2021)
- Exactly at ask: 15.6% (20.9% in 2001, 21.4% in 2021)
- 0 to 5% below: 33.7% (48.8% in 2001)
- 5 to 10% below: 21.1% (13.5% in 2001)
- 10 to 15% below: 9.4% (3.1% in 2001)
- 15% or more below: 9.7% (3.5% in 2001)
Add the last two: 19.1% of resale sellers took 10% or more off the original asking price. That share was 6.7% in 2001, 7.3% in 2021, and 53.9% at the 2009 peak. Add the first two: 26.1% got the original ask or better, which is close to the 31.1% of 2001 and a long way from the 60.5% of 2021. The at-or-above group looks roughly normal by pre-2006 standards. The deep-discount group is nearly three times its pre-2006 size.
The widening is not happening at the negotiating table
This is the part that changed how we read the chart. Run the same calculation against the FINAL list price, the price the home was actually sitting at when the offer came in, instead of the original one. The 10th to 90th percentile range on that measure was 8.0 points in 2001 and is 8.9 points in 2026. It reached 17.7 in 2011 and has been under 10 in every year since 2017 except the two frenzy years.
So negotiation from the final list price is about as tight now as it was 25 years ago. The entire widening of the original-ask range sits between the original price and the final price, which is to say in reductions the seller made before any buyer wrote an offer. The deep-discount group confirms it: of the 1,894 sellers who closed 10% or more under original ask in 2026, 81.9% had already cut their list price before going under contract, against 34.5% of everyone else. They also took a median 105 days to go under contract versus 24, on a median original ask of $382,450 that closed at $320,000, on homes with a median year built of 1982 versus 1999.
A different way to say it: a 10%-plus discount in this market is rarely a buyer winning a negotiation. It is usually a seller who started high, cut, waited, cut again, and then negotiated a normal 2% to 3% off the number they finally landed on. We showed what that path costs in days and dollars last month; this piece shows how much of the whole market's spread it accounts for.
The price smile: both ends of the market miss most often
Split the 2026 closings by the original asking price band. The share that closed 10% or more below original ask reads:
- Under $300,000: 27.3% (2,627 closings, median close 96.2% of ask, range 23.5 points)
- $300,000 to $500,000: 13.0% (3,804 closings, median 97.0%, range 11.8 points)
- $500,000 to $750,000: 15.2% (1,933 closings, median 96.4%, range 12.0 points)
- $750,000 to $1 million: 18.7% (781 closings, median 96.1%, range 13.5 points)
- $1 million and up: 31.2% (786 closings, median 93.8%, range 17.9 points)
The $300,000 to $500,000 band, which is where the most closings are and where the most comparable sales exist to price against, is the tightest. The two ends, where comparable sales are thinnest and condition varies most, are where the original ask misses by 10% or more roughly one time in three or four. The shape is a smile, and the likely reason is that the middle of the market is the most standardized product, with the most recent comparable sales to price against.
The rivals we tested
County mix. If the widening were a shift in where homes sell, it would not appear inside a single county. Duval alone went from a range of 8.8 points in 2001 to 16.9 in 2026. St. Johns alone went from 6.6 to 12.9. Both roughly double, so the widening is inside each county rather than between them.
Home size. Holding living area at 1,600 to 2,600 square feet, the range went from 6.2 points to 12.6. Doubles again.
New construction. Excluded by construction. Builder sales are a different product with a different pricing method (we showed in August that builders almost never price on the round-number grid) and they run a narrower band, 89.2% to 100.5% of original ask in 2026. Including them would have narrowed the 2026 range and flattered the finding, so they are out.
Partial year. Every year uses the fixed January to July window. The full-calendar-year view of the 25 complete years reads the same: 8.4 points in 2001, 32.3 in 2009, 12.7 in 2020, 16.8 in 2025.
Field coverage. OriginalListPrice is present on 99.3% to 100% of qualifying closings in every year except 2003, where it is 77.2%. There is no ramp from zero of the kind that makes some MLS fields unusable before a certain year. The 2003 gap sits in the middle of a flat stretch and does not touch the finding; it is stated here so nobody has to discover it.
What the data cannot tell you
This is a ratio of two prices and nothing else. It is not controlled for condition, location within a county, lot, age or anything that determines whether an original asking price was reasonable. It cannot see the seller's reasons or the buyer's. It does not measure concessions paid at closing, which we covered separately and which run about 2.5% of price on resale, so the effective discount is somewhat larger than any figure on this page. The 2026 figures cover seven months. Nothing on this page describes any person or household; it describes homes and the prices attached to them.
How agents can use this data
Four uses, all about pricing property, none about anyone's choice of where to live:
- Replace "about 3% under asking" with the distribution. A seller who hears 96.4% plans for one outcome. A seller who hears "a quarter get full ask, a third land within 5%, a fifth give up 10% or more, and the fifth is almost entirely people who started too high" can see which group the pricing decision puts them in.
- Use the final-list finding to reframe a price cut. The negotiating range from the final list price is about 9 points and has been for years. If a listing is not drawing offers, the number is not being negotiated, it is being ignored. The cut is what puts the home back inside the range where buyers negotiate.
- Price the ends of the market with more humility than the middle. Under $300,000 and over $1 million, the original ask misses by 10% or more one time in three or four. Those are the listings where a second opinion on the comps, and a shorter interval before the first review, earn their keep.
- Read a buyer's "10% under" offer against the seller's history, not the median. On a home that has not cut its price and is inside 30 days, 10% under is outside the range 80% of sellers accept. On a home at day 100 with two cuts behind it, it is the median outcome for that group.
If you use any of these figures with a client, cite the source and the date: Momentum Research analysis of data provided by realMLS, January to July 2026. Market data moves, and a number without a date attached invites an argument you do not need to have.
What this measurement does not do
This is a distribution of close price over original list price for MLS-recorded resale single family closings. It is not a controlled test and it does not identify a cause. It only sees homes sold through the MLS. Related work on the same archive looks at the share of homes that sell above and below ask over the same 25 years and at how the days-on-market distribution splits the same way this one does.
People also ask
How much below asking price do homes sell for in Jacksonville?
In January to July 2026 the median resale single family home in the seven realMLS counties closed at 96.4% of its original asking price, about 3.6% below. The median hides a wide range: 26.1% of sellers got the original ask or more, 33.7% closed within 5% of it, 21.1% closed 5% to 10% below, and 19.1% closed 10% or more below. Measured against the final list price, after any cuts, the median was 98.4%.
Is it normal for a Jacksonville home to sell 10% under asking?
It is more common than at any point outside the 2007 to 2015 downturn. About 19.1% of resale closings in January to July 2026 were 10% or more below the original list price, against 6.7% in 2001 and 7.3% in 2021. The peak was 53.9% in 2009. Most of those deep discounts were not negotiated at the table: 81.9% of the 2026 deep-discount sellers had already cut their list price before going under contract, against 34.5% of everyone else. Deep-discount sales also took a median 105 days to go under contract versus 24.
Which price range sells furthest below asking in Jacksonville?
The two ends of the market. In January to July 2026 the share of resale closings that landed 10% or more below original ask was 27.3% for homes originally listed under $300,000, 13.0% at $300,000 to $500,000, 15.2% at $500,000 to $750,000, 18.7% at $750,000 to $1 million, and 31.2% at $1 million and up. The $300,000 to $500,000 band, the largest by count, had the tightest range of outcomes and a median close at 97.0% of original ask; the $1 million and up band had a median of 93.8%.
Method and limits
Source: data provided by realMLS. Closed resale single family sales in the authoritative counties of Duval, St. Johns, Clay, Nassau, Putnam, Baker and Bradford. Records are deduplicated on listing id plus close date. Closings under $10,000 and listings flagged NewConstructionYN are excluded. Each closing's ratio is close price divided by OriginalListPrice; ratios outside 0.4 to 1.6 are dropped as data errors. 226,023 closings carry a usable ratio across the fixed January to July window, 2001 through 2026.
Percentiles are linear-interpolated. "Range" on this page means the 90th percentile ratio minus the 10th, in points of original asking price. "Deep discount" means a ratio under 0.90. The final-list comparison uses the same closings with ListPrice as the denominator. The price bands use OriginalListPrice, not close price, so a home is banded by what it asked, not by what it got.
OriginalListPrice is present on 99.3% to 100% of qualifying closings in every year except 2003 (77.2%). The new construction flag is agent-entered. Nothing is controlled for condition, location, lot, size or age, and the deep-discount group differs from the rest on several of those, so the comparison between groups is descriptive, not causal.
Every year uses the same January to July window because 2026 is a partial year. The full-calendar-year view of the 25 complete years was also run and reaches the same result.
Related reading on the same archive: how Duval's share of the region's home sales fell from 71% to 53% and the ongoing Jacksonville housing market tracker.
All figures on this page are per Momentum Research analysis of data provided by realMLS and are deemed reliable but not guaranteed. Equal Housing Opportunity.