
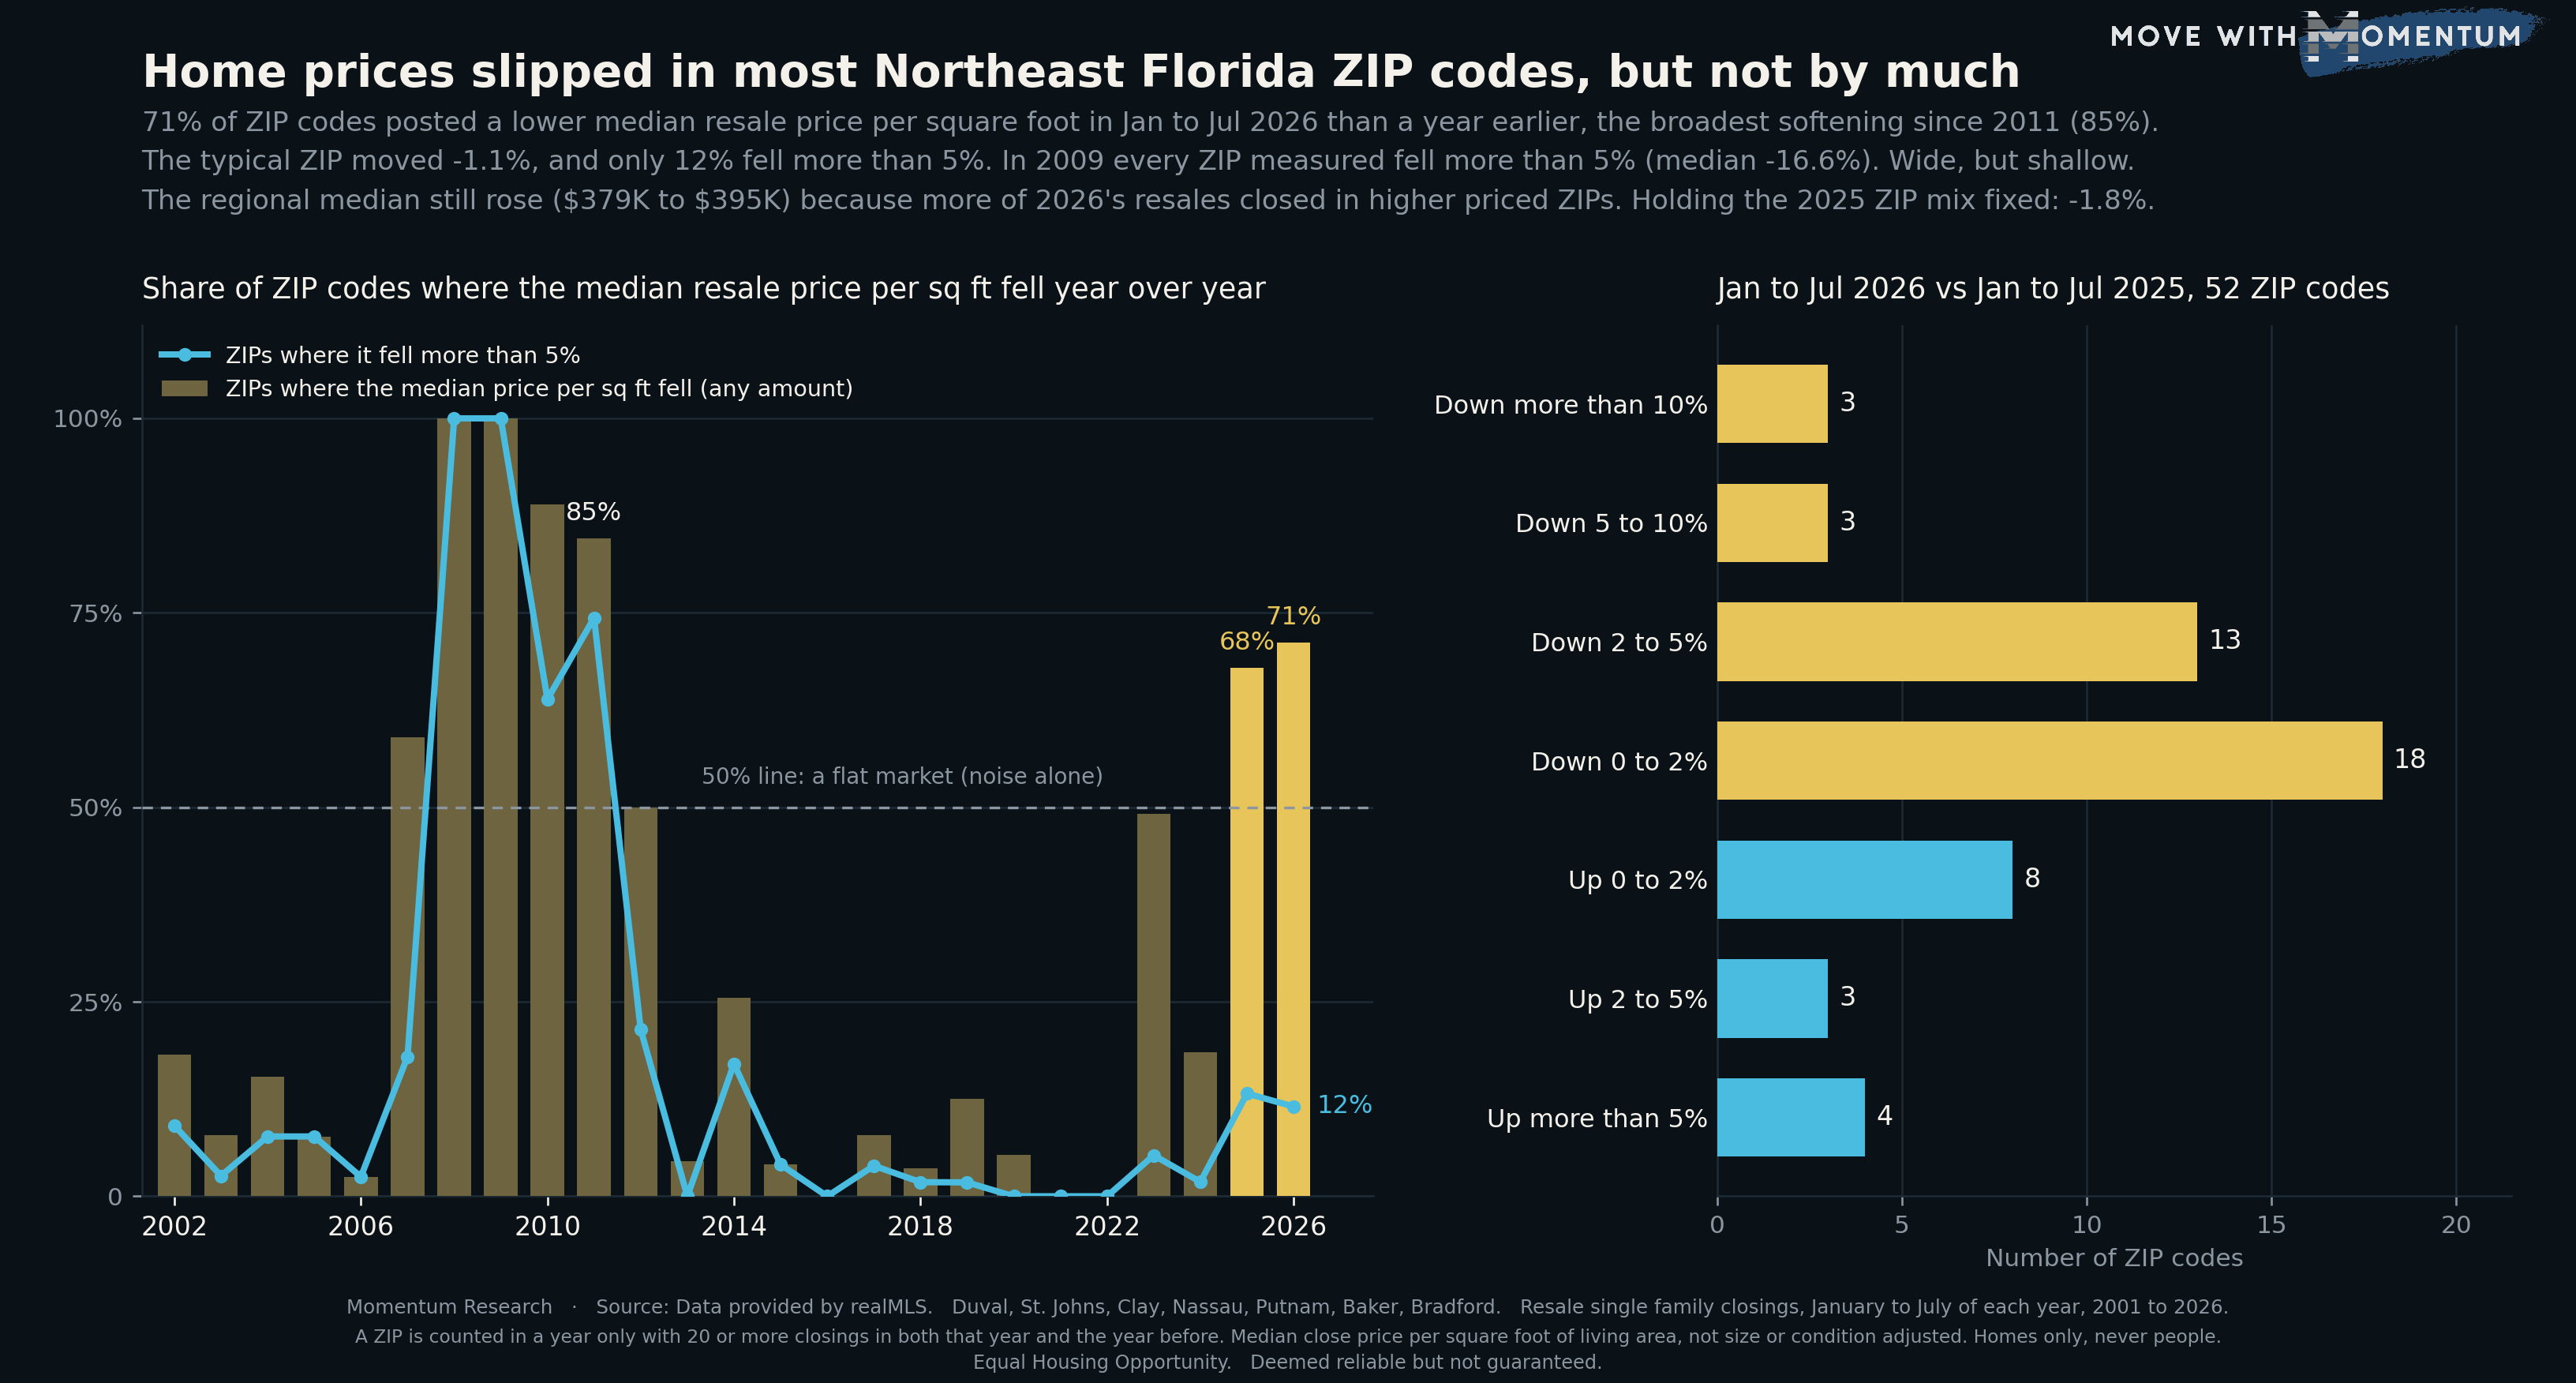
The headline number for Northeast Florida resale prices went up this year. The median resale single family home closed at $395,000 in January to July 2026, against $379,000 in the same months of 2025. Look one level down, at the ZIP code, and the picture reverses: in 37 of the 52 ZIP codes with enough sales to measure, the median price per square foot was lower than a year earlier.
That is 71% of ZIP codes, the broadest year-over-year softening in the realMLS archive since 2011. It is also shallow. The typical ZIP moved 1.1% lower, and only 6 of the 52 fell by more than 5%. This piece explains how both of those can be true and what they mean for pricing a home this fall.
How the ZIP code breadth was measured
For every year since 2001, the method takes resale single family closings in the seven counties realMLS is authoritative for, keeps January through July (the archive runs through mid August 2026, so July is the last complete month, and every year is cut to the same seven months), and computes the median close price per square foot of living area in each ZIP code. A ZIP is compared with the prior year only if it had at least 20 closings in both years. The count of qualifying ZIPs runs from the high 30s in the early years to 52 in 2026; 2004 and 2005 have only 13 because the postal code field is sparse in those years of the archive.
One reference point matters more than zero. In a market where prices truly did not move, sampling noise alone would put roughly half of the ZIP codes a little below the prior year and half a little above. So the question is not whether any ZIPs fell but how far the share sits from 50%. In 2023, after the 2022 run-up stopped, it was 49% with a median change of plus 0.1%: a flat year. In 2025 it was 68% and in 2026 it is 71%, with the median ZIP 1.1% lower in both years.
Wide, but shallow
The chart's left panel shows why the breadth number alone can mislead. In 2008 and 2009 every measured ZIP fell, and every one of them fell by more than 5%; the median ZIP was down 13.8% and then 16.6%. In 2011 it was 85% of ZIPs down with a median of minus 11.9%. In 2026, 71% are down but the cyan line, the share down more than 5%, sits at 12%. The right panel shows the distribution: 18 ZIPs slipped by less than 2%, 13 by 2 to 5%, and only 6 by more than 5%. Fifteen rose, 4 of them by more than 5%.
The closest past year by shape is 2007, when 59% of ZIPs slipped and the median change was minus 1.0%. The next year was 2008. That is worth saying plainly and then qualifying just as plainly: 2023 also had half of ZIPs down, and 2024 turned back up with only 19% of ZIPs lower. Breadth describes the present market; it has not, on its own, predicted the next one.
Why the regional median went up anyway
More of 2026's resales happened in higher priced places. St. Johns County accounted for 24.3% of resale single family closings in January to July 2026, up from 20.5% a year earlier, and the share of closings in ZIP codes priced above the 2025 regional median rose from about 52% to 55%. Those shifts lift the all-sales median even when prices within most ZIPs are flat or slightly lower.
Holding the location mix fixed removes that effect. Weighting each ZIP code's 2026 change by its 2025 closings gives a change of minus 1.8% in the median price per square foot, against plus 1.3% for the unweighted regional median per square foot and plus 4.2% for the regional median sale price. For anyone quoting "prices are up" from the regional median, that is the gap to keep in mind.
Rival explanations we tested
A breadth count built on ZIP medians can move for reasons other than price. Each check below recomputes the January to July 2026 against 2025 comparison.
- Thin samples. Raising the floor from 20 to 40 closings per ZIP per year leaves 48 ZIPs, and 71% of them are still down. Resampling the closings within each ZIP 400 times kept the share above one half in 95% of draws (fifth percentile 52%).
- Home size. Price per square foot falls as homes get bigger. Limiting both years to homes of 1,200 to 2,600 square feet leaves 49 ZIPs, 67% of them down.
- Newer resales. Homes built in 2020 or later are a growing share of resales. Excluding them, 58% of ZIPs are down with a median change of minus 0.6%. This is the check that weakens the finding most: part of the breadth comes from a larger share of nearly new homes reselling, not from the same homes selling for less.
- Seller concessions. Subtracting recorded concessions from the close price gives 67% of ZIPs down, median minus 1.1%. The concession field exists only from 2023, so this check is not possible for earlier years.
- Price instead of price per foot. On median close price, 56% of ZIPs are down, with 31% down by more than 5%, a noisier measure because it moves with the size of the homes that happened to sell.
- Partial year. The full calendar 2025 against 2024 comparison put 70% of 59 ZIPs down with a median of minus 1.7%, close to the January to July figure for the same years (68%), so the seven-month window is not manufacturing the result.
Over two years, January to July 2026 against 2024, 71% of 51 ZIPs are lower, the median ZIP is down 2.8%, and 24% are down more than 5%. By county, 25 of 30 Duval ZIPs, 5 of 8 in St. Johns and 4 of 6 in Clay were lower in 2026; 1 of 4 Nassau ZIPs was. Putnam, Baker and Bradford had too few qualifying ZIPs to report.
How agents can use this data
- Quote the ZIP, not the region. The regional median sale price rose 4.2% while the typical ZIP slipped about 1%. A seller who reads a rising regional headline and prices from it is pricing against a mix shift, not against the homes that compete with theirs.
- Check the direction of the last twelve months of comps before setting a list price. In 71% of ZIPs the median price per square foot is lower than last year. A comparable sale from mid 2025 is more likely to overstate today's value than understate it, usually by a small amount, so date-adjust older comps rather than taking them at face value.
- Keep the size of the move in proportion. Only 6 of 52 ZIPs fell more than 5%, and 15 rose. A buyer waiting for 2008-style declines is looking at a market whose typical ZIP moved about 1%; a seller told the market is falling should see how small the typical change is.
- Separate nearly new resales from older homes in a pricing analysis. Removing homes built since 2020 cut the share of falling ZIPs from 71% to 58%. Where a neighborhood has a large recent build-out, compare a home against resales of similar age before reading a price trend into the ZIP median.
Whichever way you use the numbers, cite the source: Momentum Research analysis of data provided by realMLS, resale single family closings January to July 2001 through 2026, deemed reliable but not guaranteed.
What this measurement does not do
It does not forecast. It does not say what any one home is worth; a ZIP median blends homes of every age, size, condition and lot. It is not size, age or condition adjusted beyond the checks listed above. It describes homes and closings only, never the people who live in them or the people who bought or sold them, and it should be read alongside a current comparable-sales analysis rather than in place of one.
People also ask
Are home prices dropping in Jacksonville in 2026?
In most ZIP codes, slightly. Comparing January to July 2026 with the same months of 2025, the median resale price per square foot fell in 37 of 52 Northeast Florida ZIP codes with enough sales to measure, or 71%. The typical ZIP moved 1.1% lower and only 6 of the 52 fell more than 5%. The region-wide median sale price still rose, from $379,000 to $395,000, because a larger share of 2026 resales closed in higher priced ZIP codes; holding the 2025 mix of ZIP codes fixed, prices were about 1.8% lower.
Is the 2026 Jacksonville market like 2008?
Not by the depth of the declines. In January to July of 2008 and 2009, every measured ZIP code posted a lower median price per square foot than the year before, and every one of them fell by more than 5%; the typical ZIP fell 13.8% and then 16.6%. In 2026 the breadth is high, 71% of ZIPs down, but 12% fell more than 5% and the typical change was minus 1.1%. The closest past match is 2007, when 59% of ZIPs slipped with a median change of minus 1.0%. Breadth alone did not predict what came next: 2023 also had about half of ZIPs down and prices rose again in 2024.
Why does the Jacksonville median home price look higher if most ZIP codes fell?
Because the median of all sales depends on where the sales happen. St. Johns County made up 24.3% of resale single family closings in January to July 2026, up from 20.5% a year earlier, and its homes sell at higher prices. More closings in higher priced ZIP codes lift the regional median even when prices inside most ZIP codes are flat to slightly down. Weighting each ZIP code by its 2025 sales, the same homes-by-location basket was about 1.8% cheaper per square foot in 2026.
Method and limits
Source: data provided by realMLS. Closed resale single family sales (NewConstructionYN false, PropertySubType Single Family Residence) in the authoritative counties of Duval, St. Johns, Clay, Nassau, Putnam, Baker and Bradford. Records are deduplicated on listing id plus close date. Closings with living area under 400 or over 10,000 square feet, a close price under $10,000, or no five-digit postal code are excluded. The window is January through July of every year; the archive ends on August 13, 2026, so July is the last complete month.
For each year, each ZIP code's median close price per square foot is compared with the prior year's, only where the ZIP had at least 20 closings in both years. Reported: the share of those ZIPs whose median fell by any amount, the share that fell more than 5%, and the median of the ZIP-level changes. The fixed-mix figure weights each ZIP's change by its January to July 2025 closing count. Rival checks (a 40-closing floor, a 1,200 to 2,600 square foot band, homes built before 2020, concessions subtracted, close price instead of price per foot, full calendar 2025 against 2024, a 400-draw bootstrap within ZIP) are described above. Counties are assigned to a ZIP by where most of its 2026 closings fell.
Nothing is controlled for condition, lot, view or renovation. Cause is not identified. ZIP codes are described by the closing prices of homes in them only.
Related reading on the same archive: what happens when a home is resold after one or two years, Jacksonville ZIP codes with a median under $300K, where the region's closings happen by county and the ongoing Jacksonville housing market tracker.
All figures on this page are per Momentum Research analysis of data provided by realMLS and are deemed reliable but not guaranteed. Equal Housing Opportunity.