
A listing that fails does not just cost you a price cut. It costs you most of a year.
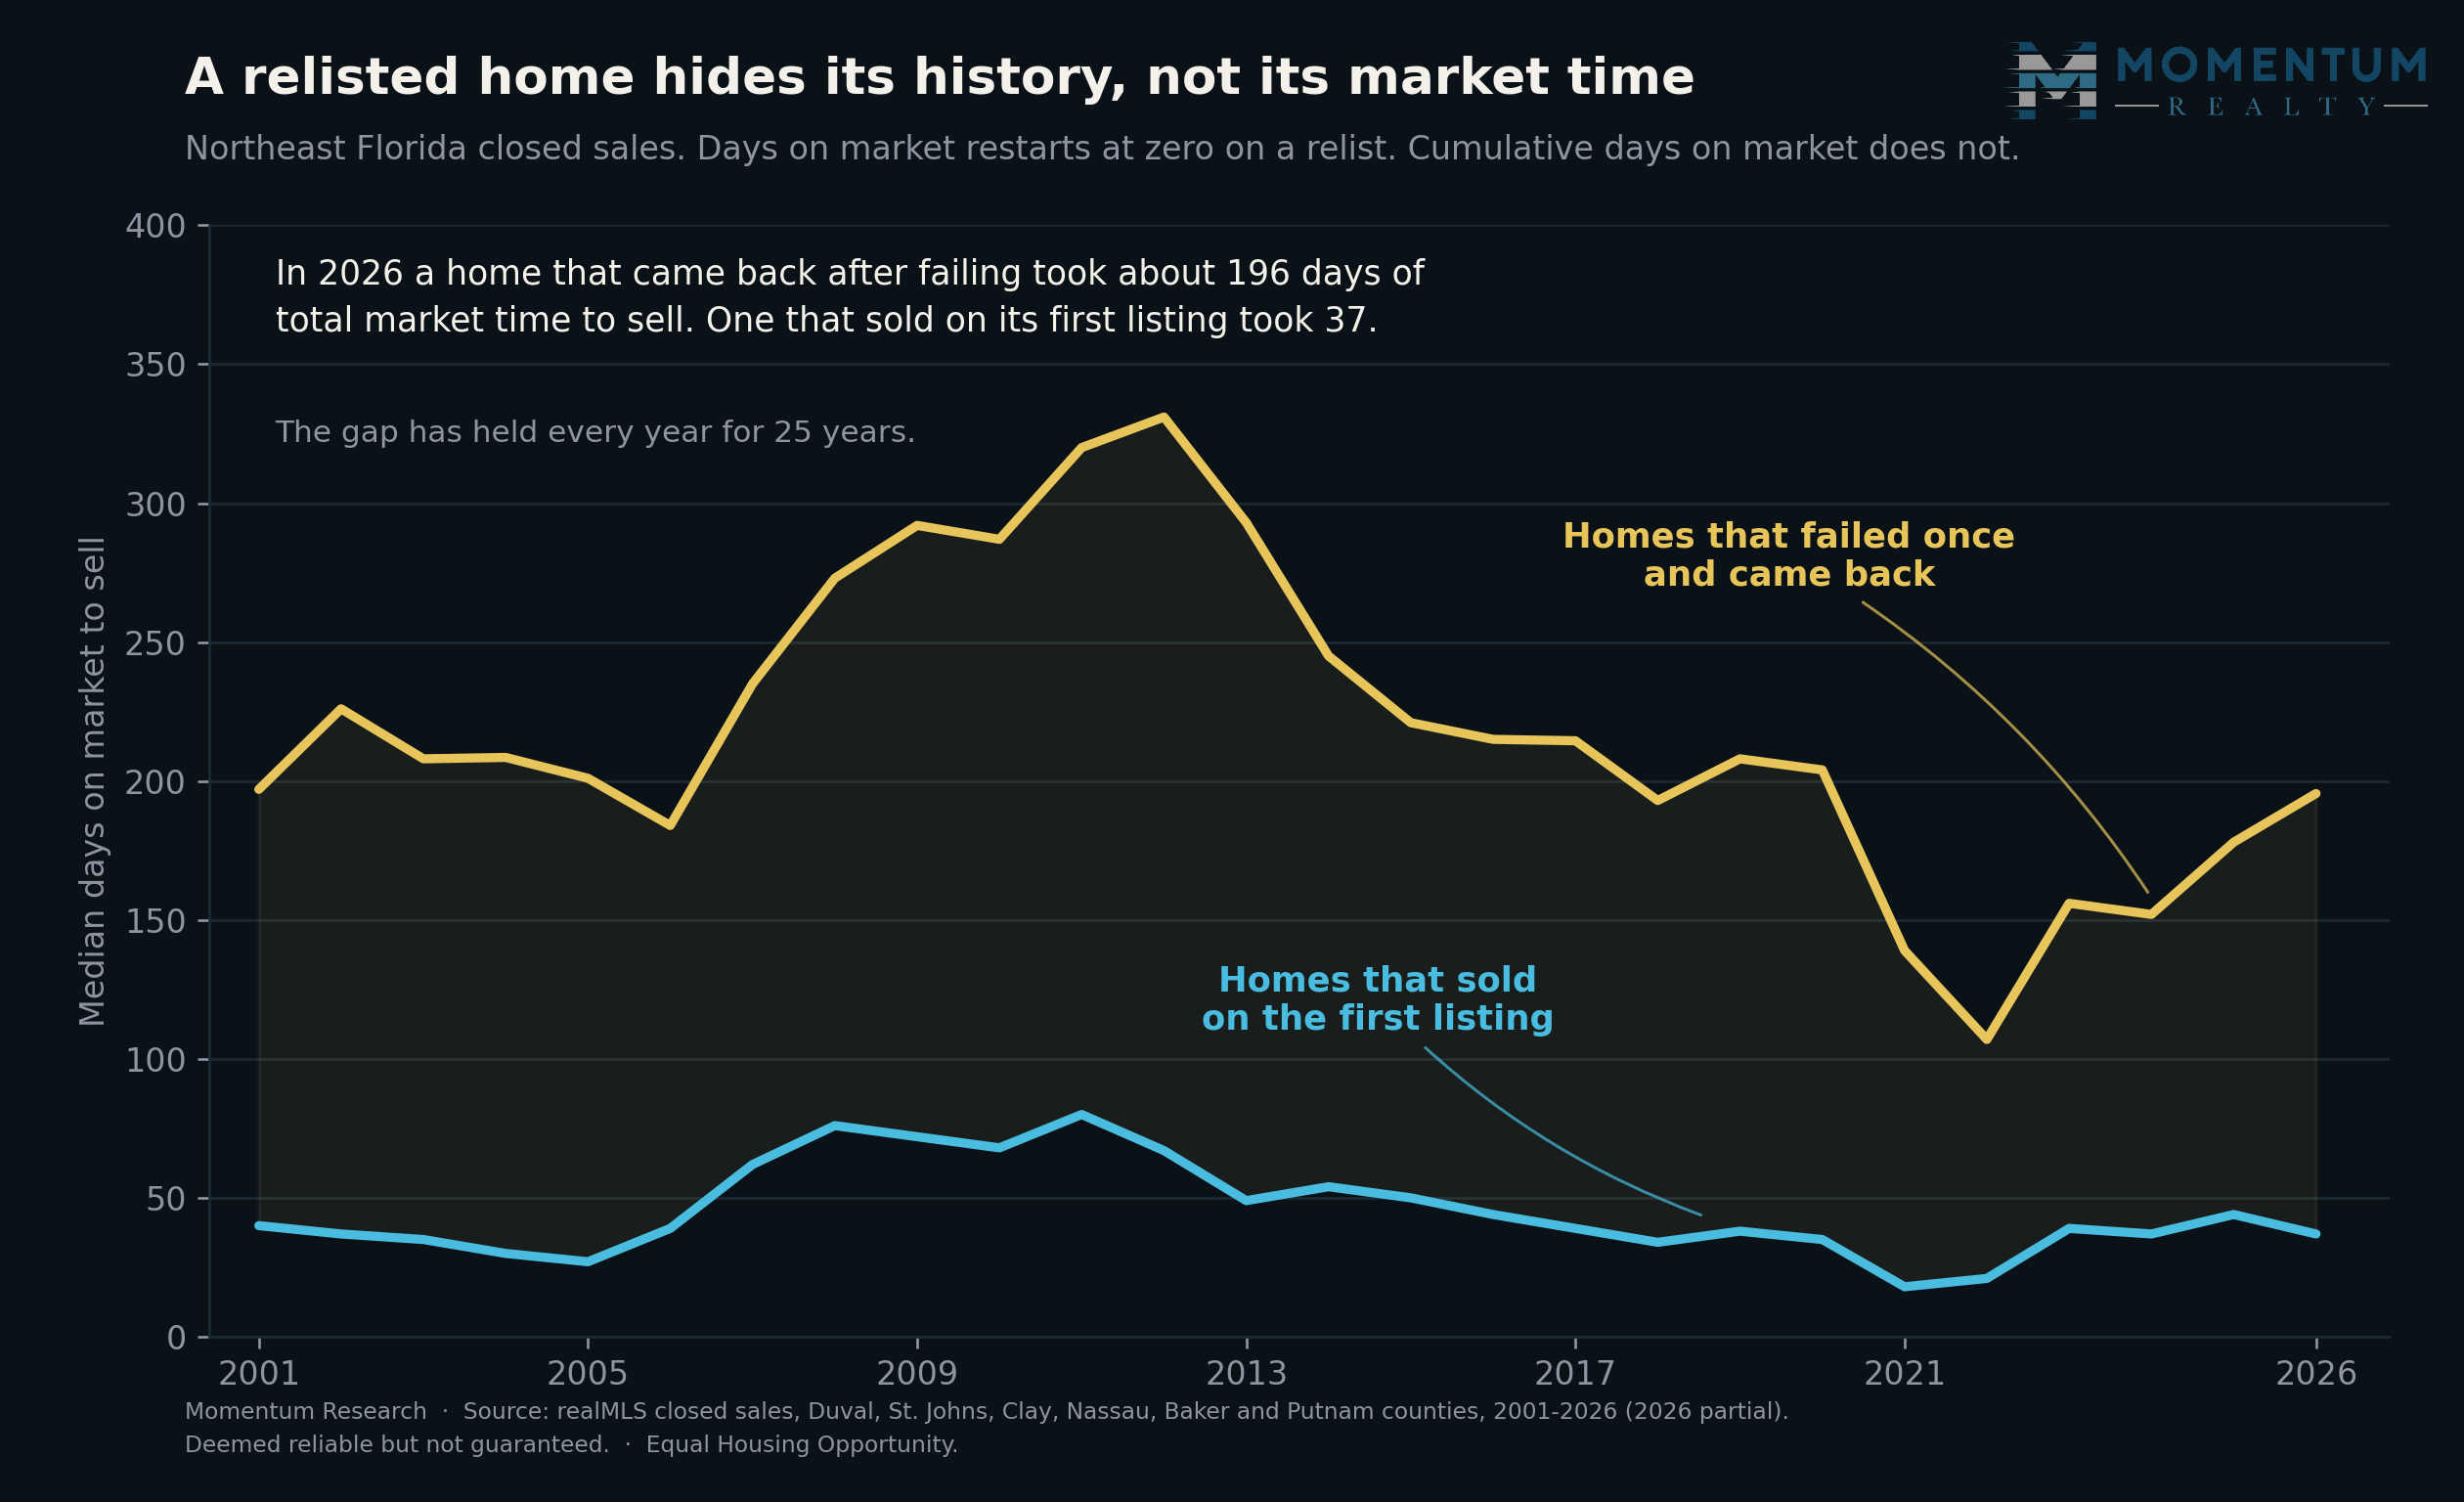
In Northeast Florida in 2026, a home that came off the market and had to be relisted took a median 196 days of total market time before it finally sold. A home that sold on its first listing took 37. That is about 6.4 months against 5 weeks.
Here is the part most sellers get backwards. They brace for the price hit, and the price hit is small. Relisted homes closed at 95.5 percent of their original asking price. First-listing homes closed at 96.5. One point. On a $360,000 home that is roughly $3,600.
The real bill is the five extra months of mortgage, insurance, taxes and showings on a house you were trying to leave. That is what a failed listing actually charges you.
The mechanism behind the number is worth knowing, because it is also how the history stays visible. Days on market belongs to the listing. Withdraw a listing, wait, put the home back on, and the counter restarts at zero. Cumulative days on market belongs to the house, and it carries every prior listing forward. It is why a home advertised as fresh can turn out to have been for sale, on and off, since last winter, and why the agent on the other side can see that.
We pulled 25 years of Northeast Florida closed sales to size the gap. It is not subtle, and it is not new.
A relisted home takes about five times as long to sell
In 2026, homes that were relisted before they finally sold carried a median 196 cumulative days on market. Homes that sold on their first listing took 37 days. That is roughly a five to one ratio, and it is not a quirk of this year: the gap appears in every one of the last 25 years, through the 2005 boom, the 2008 downturn, the 2021 frenzy and the market we have now.
The two clocks also move together in a useful way. When the market slowed after 2007, the relisted line climbed to a peak of 331 days in 2012 while the first-listing line peaked at 81. When the market ran hot in 2021, the relisted line fell to 139 days and the first-listing line fell to 18. Neither line is measuring a different market. They are measuring the same market from two starting points, and the second start is expensive.
Relisting is back to pre-pandemic levels
About 5.5 percent of Northeast Florida closings in 2026 had a relisting in their history, or 922 of the 16,734 sales in our sample so far this year. In 2025 it was 6.5 percent. In 2021, when almost nothing failed to sell, it bottomed at 2.1 percent.
Put those together and the trend is a return to normal rather than a warning: 5.5 percent sits close to the 5.3 percent of 2019 and well under the 9.8 percent of 2008. The share of listings that need a second attempt is behaving the way it did before the pandemic, which is consistent with what we found looking at how long homes take to sell in Northeast Florida.
The cost is time, not price
To put the two costs side by side properly: one percentage point of original ask, roughly $3,600 on a $360,000 home, against roughly five additional months of carrying it.
That is real money, but it is much smaller than the time gap. A seller who needs two listings is not usually giving away the house. They are giving away five months. For anyone carrying a mortgage, insurance and taxes on a property they are trying to leave, five extra months of holding cost will normally exceed one point of price.
It also lines up with the pattern in our work on what price cuts actually cost sellers: the penalty for starting too high shows up first in market time and only later, and more mildly, in the final number.
What this means if you are buying
A listing that reads as new can have a long history behind it. If a home shows a low days-on-market figure but the price has moved, the photos look like a different season, or the listing history is vague, cumulative days on market is the field to ask about. Your agent can pull it. It is not hidden, it is just not the number that gets displayed.
Knowing the real figure changes what an offer should look like. A home 196 days into its actual market life is in a different negotiating position from one that went live last week, whatever the headline number says.
How agents can use this data
Four ways to put this in front of a client this week, written about homes and market behavior rather than about the people who live in them.
1. For a buyer comparing two similar homes. Pull cumulative days on market on both before writing an offer. If one has been quietly on and off the market since spring and the other went live nine days ago, that is a concrete, verifiable difference in the seller's position, and it belongs in the conversation about price and terms.
2. For a seller who is anchored above the comps. This is the chart to show. The argument is not that they will have to slash the price, because the data says the price penalty is only about one point. The argument is that the realistic alternative to pricing it right is roughly five extra months of carrying costs, and five months of showings, before the same conversation happens anyway.
3. For a seller whose listing just expired with another brokerage. The honest framing is that the clock has not really restarted. Cumulative days on market travels with the property, buyer agents can see it, and the plan for the second listing has to account for that rather than pretend it away.
4. As a one-line social or press point. "In Northeast Florida, a home that fails once and comes back takes about 196 days of total market time to sell. One that sells on its first listing takes 37." Whenever you use it, cite the source line: Momentum Research analysis of realMLS closed residential sales, 2001 to 2026, deemed reliable but not guaranteed.
People also ask
What is cumulative days on market?
Cumulative days on market, often shortened to CDOM, counts every day a home has been actively for sale across all of its recent listings, including ones that were withdrawn or expired. Ordinary days on market counts only the current listing and restarts at zero each time a home is relisted. In Northeast Florida in 2026, homes that had been relisted carried a median 196 cumulative days against 37 days for homes that sold on their first listing.
Why does days on market reset to zero?
Days on market is a property of a listing, not of a house. When a listing is withdrawn or expires and the home is later listed again, the new listing is a new record and its day count begins at zero. Cumulative days on market exists specifically so the prior history is still visible. About 5.5 percent of Northeast Florida closings in 2026 showed this pattern, up from a low of 2.1 percent in 2021.
Does a relisted home sell for less?
Less than people assume. In 2026 relisted Northeast Florida homes closed at a median 95.5 percent of their original asking price against 96.5 percent for homes that sold on the first listing, a difference of about one percentage point. The larger cost is time rather than price: roughly 196 days of total market exposure against 37.
The takeaway
Days on market answers a narrow question: how long has this listing existed. Cumulative days on market answers the one that matters: how long has this house been trying to sell. In Northeast Florida in 2026 the difference between those two answers is about 159 days, and it has been there in every year we can measure. If you want the fuller picture of where local pricing sits right now, our Jacksonville housing market data page is updated alongside this research.
Method. Momentum Research analysis of realMLS closed residential sales in Duval, St. Johns, Clay, Nassau, Baker and Putnam counties, 2001 through 2026, deduplicated by listing ID and close date. A sale is counted as relisted when cumulative days on market exceeds days on market by 14 or more days. Records with negative or implausible values, and cumulative figures above 2,000 days, were dropped. Years with fewer than 300 qualifying sales are not plotted. 2026 is a partial year. Data deemed reliable but not guaranteed.