
People say new construction sells fast. In Northeast Florida that is true of about half of it.
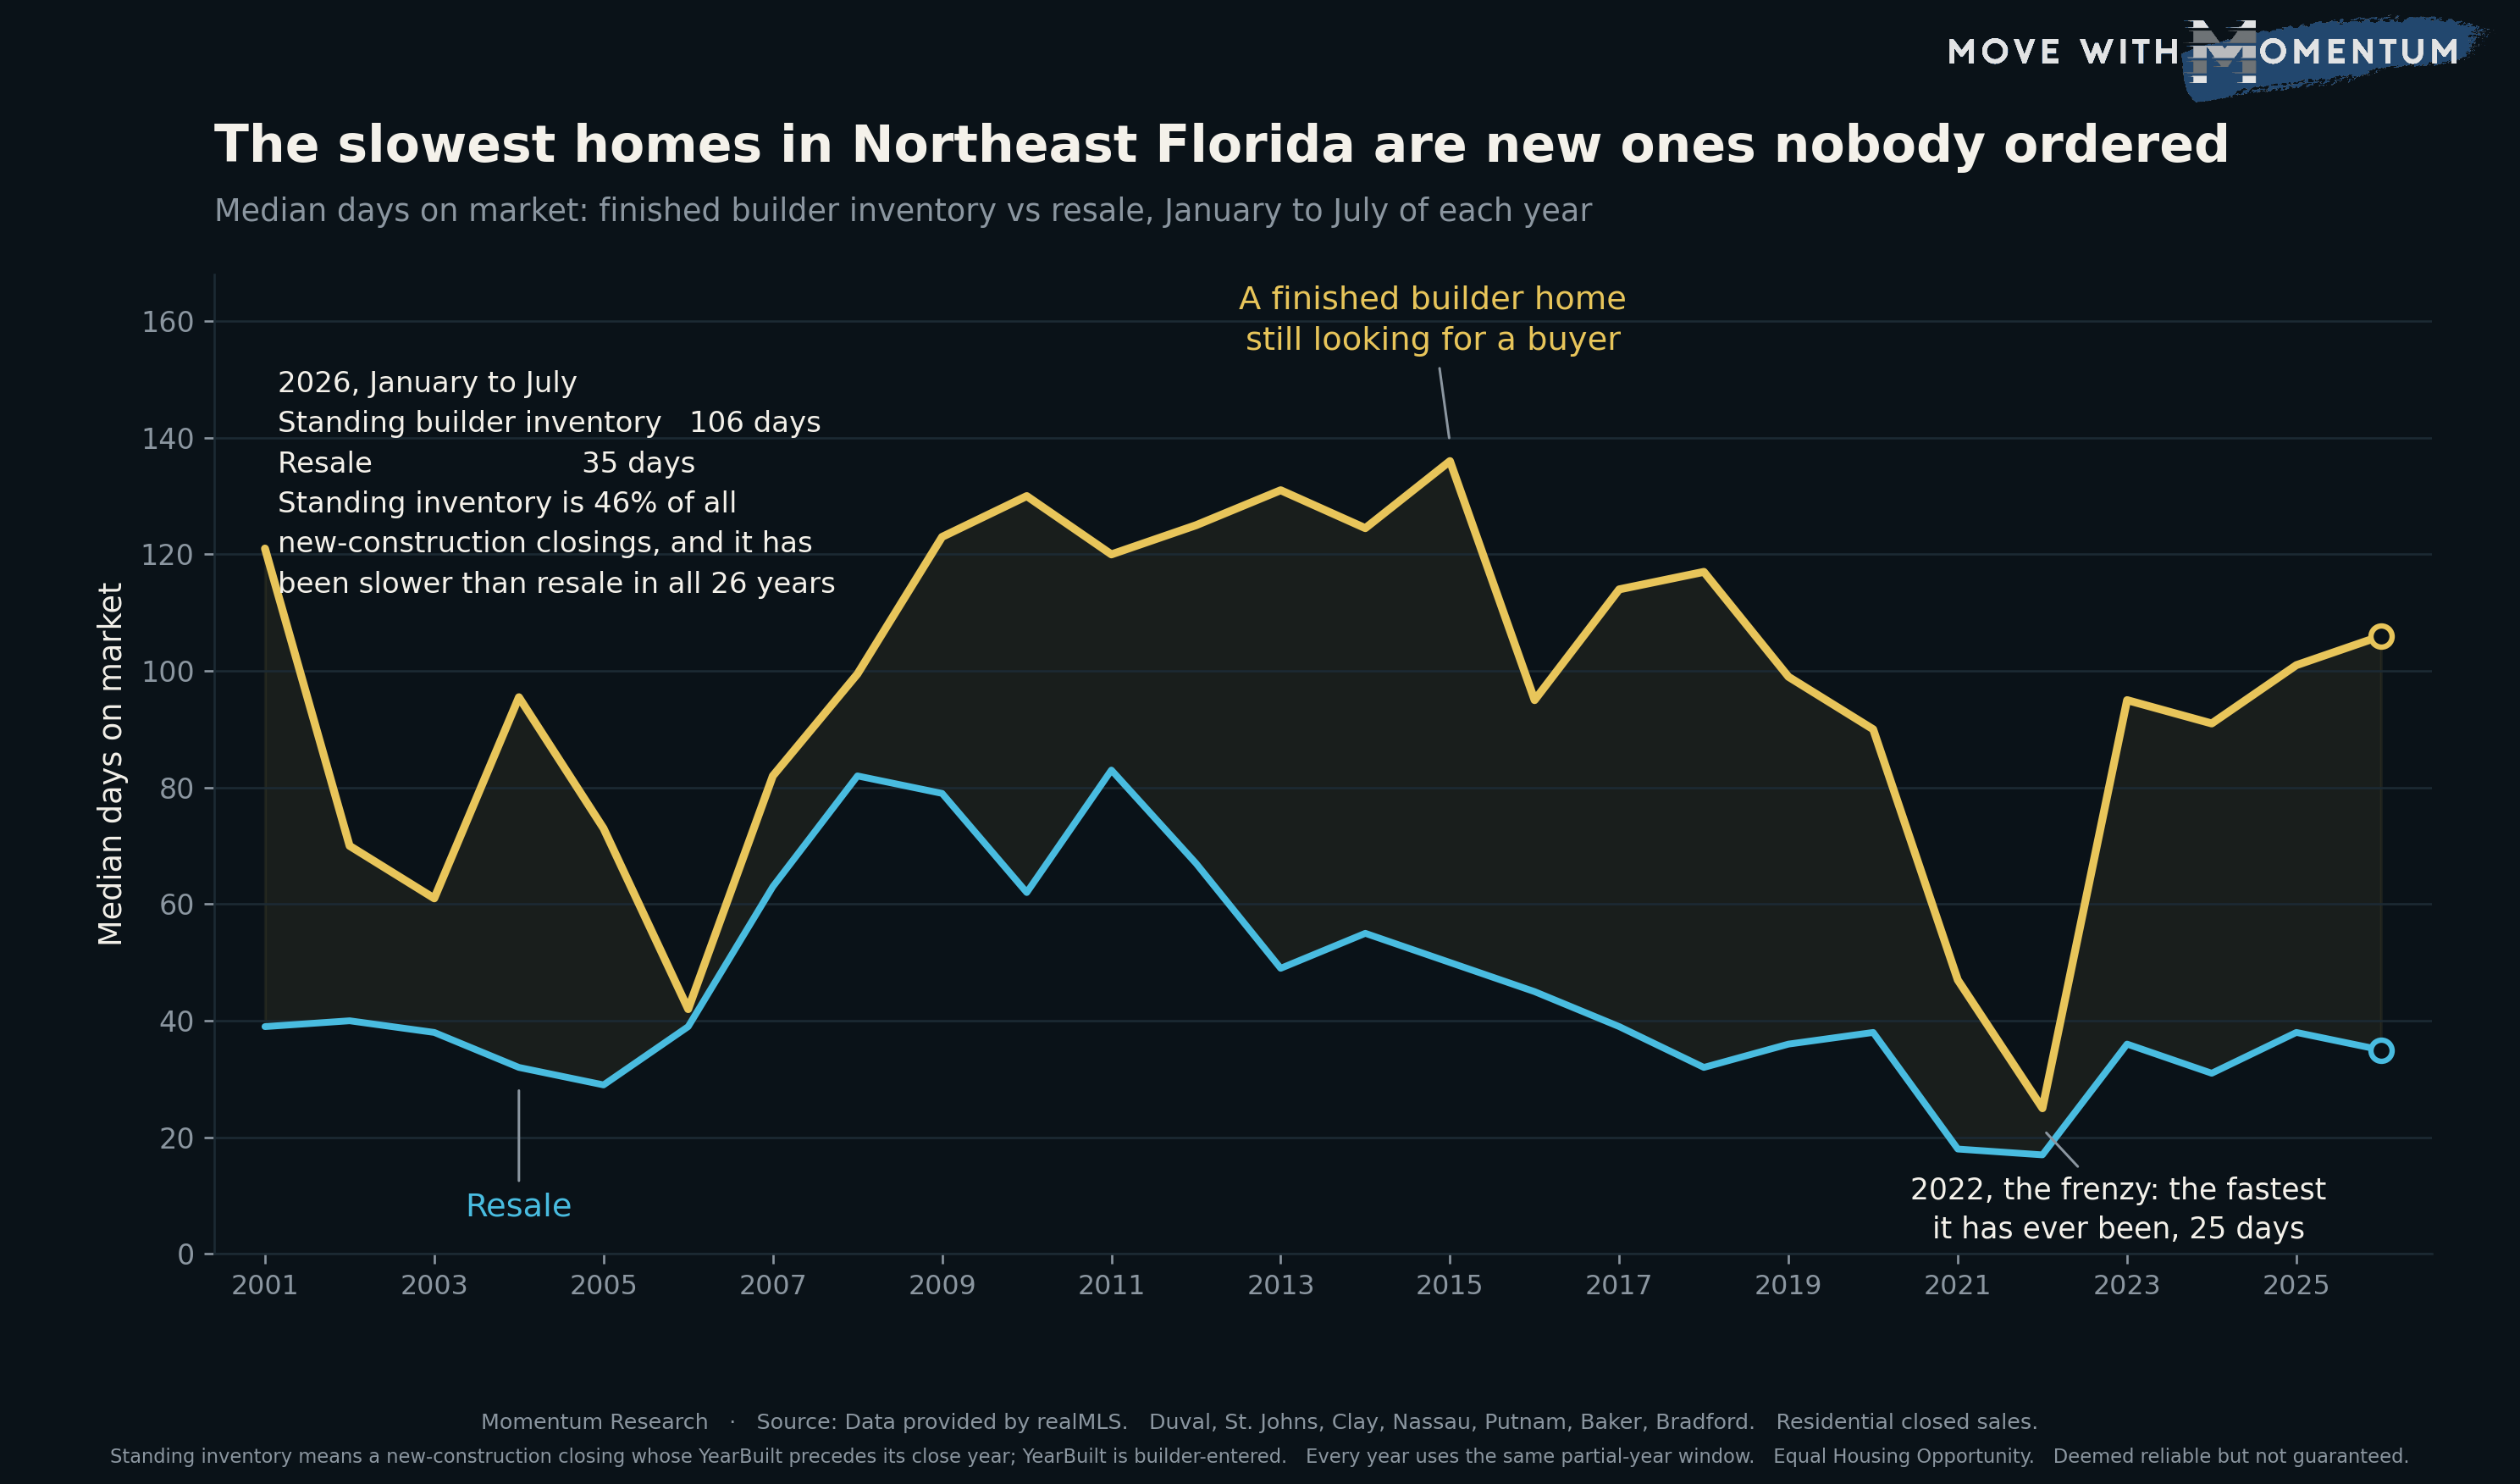
Split every new-construction closing into two groups. In the first, the home was finished in the same calendar year it closed: a build that had a buyer attached, or close to it. In the second, the home was finished in an earlier year and the builder was still holding it. Across January to July 2026 closings, the first group took a median 31 days on market. The second took 106. A resale over the same window took 35.
So the slowest homes on the board are new ones. They are just new homes nobody ordered.
Half of every new home sold here was already sitting
In January to July 2026, new construction was 22.5% of all Residential closings in the seven realMLS counties, 3,644 of 16,204. Of those 3,644, some 1,669 carried a year built earlier than their close year. That is 45.8%.
The important thing about that number is that it is not news. Across the 26 years in this record the same share has run between 42.3% and 72.2%, and 2026 sits near the bottom of that range, not the top. Builders have always closed a large block of finished, unsold homes. What the market calls new construction has always been roughly half order book and half shelf stock.
This is worth stating plainly because the full-year version of this figure tells a story that is not true. Measured over complete calendar years, the standing share reads 28.4% in 2023, 30.0% in 2024, 37.5% in 2025 and 45.1% in 2026, which looks like a clean three-year climb in unsold builder inventory. It is an artifact. Early-year closings are structurally more likely to carry a prior year built, because a home finished in December and closed in January counts as a prior year on a technicality, and 2026 is a partial year weighted toward those early months. Hold the window fixed at January to July for every year and the climb disappears: 44.4, 46.7, 53.3, 45.8. Every figure in this piece uses the fixed window.
The gap is three to one, and it has never closed
In 2026 finished builder inventory took 106 days against 35 for a resale, a ratio of 3.0. That ratio has been above 1.0 in every one of the 26 years measured. The narrowest it ever got was 1.1 in 2006, and the widest was 3.7 in 2018.
The gold line has its own shape worth reading. It sat between 90 and 136 days for the entire 2009 to 2020 stretch, peaking at 136 in 2015. It then collapsed to 47 days in 2021 and 25 in 2022, the only period in the record when finished builder stock cleared at anything like resale speed. It reopened immediately: 95 days in 2023, 91 in 2024, 101 in 2025, 106 in 2026.
Read the last four years together and the story is not deterioration. It is a return to the level that held for the previous decade. The frenzy was the exception.
The builder discounts the standing home, not the ordered one
The time gap shows up in price as well, and the split is clean. In January to July 2026, standing builder inventory closed at a median 95.6% of its original list price. A same-year build closed at 99.2%. That is roughly 3.6 points of the original ask, and it is a gap that barely existed in 2021 and 2022, when both lanes sat at about 100%.
That pattern is consistent with what shows up in the concession data as well. Our work on seller concessions found new construction moved from being the stingiest side of the market in 2023 to paying more often and in larger amounts than homeowners by 2026. Builders have been repricing without moving the sticker, and the finished home is where that repricing lands hardest.
What this does not prove
Three limits, and the second one is the one that matters most.
First, year built on a new-construction listing is entered by the builder or the listing agent, and it may reflect a permit year or a completion year. It is a good proxy for standing inventory, not a certified one.
Second, days on market for a built-to-order home is not measuring the same thing as days on market for a resale. A builder often enters the listing at or near contract, so the same-year lane's 31 days partly reflects when the listing was created rather than how long the home was genuinely available. That is precisely why the headline comparison here is standing inventory against resale, both of which are actually marketed on the MLS for the period being counted, and not the internal same-year against prior-year split. Treat the 31-day figure as the weakest number in this piece.
Third, none of this is a controlled comparison. Standing builder inventory and resale differ on age, plan, location within a community and price. The claim is that one group takes about three times as long to sell, which the data supports directly. The claim is not that being builder inventory causes the delay.
How agents can use this data
Four uses, all about homes and the market rather than about people.
Ask which kind of new construction you are looking at. Before quoting any market-time expectation on a new-construction listing, check the year built against the current year. Those are two different products with a 75-day difference in median market time, and treating them as one number will be wrong for both.
Price a standing home against standing homes. A finished builder home that has been on the market 60 days is not behind schedule; the median for that group is 106 days. Pulling the comparison set from resale market times will make a normal listing look like a failing one, and that misread drives premature price cuts. Our calendar work covers the seasonal layer on top of this.
Use the 95.6% figure in a negotiation on a completed home, and know its limits. Standing inventory as a group closed 3.6 points further below original ask than same-year builds. That is a group median, not a promise about any one home, and builder incentives are frequently structured through financing rather than price. Ask for the whole package in writing.
Watch the ratio, not the level. Days on market moves with the whole market, so 106 days on its own says little. The ratio against resale is the durable measure, and at 3.0 it is close to the top of its historical range without being outside it. If that ratio compresses, builder inventory is clearing; if it widens past 3.7, it is not.
Whenever you use any of this with a client, cite the source and the date: Momentum Research analysis of data provided by realMLS, January to July closings, 2001 to 2026, published August 21, 2026. Numbers without a source are just opinions with decimal points.
People also ask
How long do new construction homes take to sell in Jacksonville?
It depends entirely on whether the home was already finished. Across January to July 2026 closings in the realMLS footprint, a new-construction home whose year built precedes its close year took a median 106 days on market. A new-construction home completed in the same year it closed took 31 days, and a resale took 35. The single figure people usually quote for new construction averages two very different things. Figures are per Momentum Research analysis of realMLS closed sales and are deemed reliable but not guaranteed.
Why does finished builder inventory sit longer than resale?
This data shows the gap, not the reason, so what follows is context rather than a finding. A finished home the builder is still holding is inventory with a carrying cost, and it is competing against homes in the same community that a buyer can still personalise. It is also usually the plan, lot or colour package that was not chosen first. What the data does support is that the pattern is structural rather than recent: finished builder inventory has taken longer than resale in all 26 years of the record. Figures are per Momentum Research analysis of realMLS closed sales and are deemed reliable but not guaranteed.
Is a finished builder home a better deal than one built to order?
On price against the original asking price, the finished home gave up more. In January to July 2026 closings, standing builder inventory closed at a median 95.6% of its original list price while a same-year build closed at 99.2%. That is about 3.6 points of the original ask. Whether that is a better deal depends on what a buyer wants from the home, and any specific home should be evaluated on its own contract, incentives and inspection. Figures are per Momentum Research analysis of realMLS closed sales and are deemed reliable but not guaranteed.
The takeaway
New construction in Northeast Florida is not one market. It is an order book that moves at resale speed or better, and a shelf of finished homes that takes three times as long and closes further below its asking price. Roughly half of what closes comes off the shelf, and that has been true for 26 years. Anyone quoting a single days-on-market figure for new construction is averaging two markets that have never behaved alike.
For the wider picture on prices, inventory and market time across the region, see our Jacksonville housing market data.
Method and limits
Source: data provided by realMLS. Residential closed sales in the authoritative counties of Duval, St. Johns, Clay, Nassau, Putnam, Baker and Bradford. Records are deduplicated on listing id plus close date. 360,408 closings across the fixed January to July window, 2001 through 2026.
New construction is the feed's own new-construction flag. Standing inventory means a new-construction closing whose year built precedes its close year; a same-year build means year built equals close year. A lane must carry 200 or more closings in a year to be plotted, and resale 500 or more. Days on market values below zero or above 730 are excluded from the median. Share of original ask is close price divided by original list price.
Every year uses the same January to July window, chosen because July is the last complete close month in the current pull. This is what makes 2026 comparable to the other 25 years rather than a stub, and it is what removes the early-year bias described above.
Three limits carried from above: year built is builder-entered rather than verified; days on market for a built-to-order home partly reflects when the listing was entered; and no group here is controlled against another on age, price, plan or location.
All figures on this page are per Momentum Research analysis of data provided by realMLS and are deemed reliable but not guaranteed. Equal Housing Opportunity.