
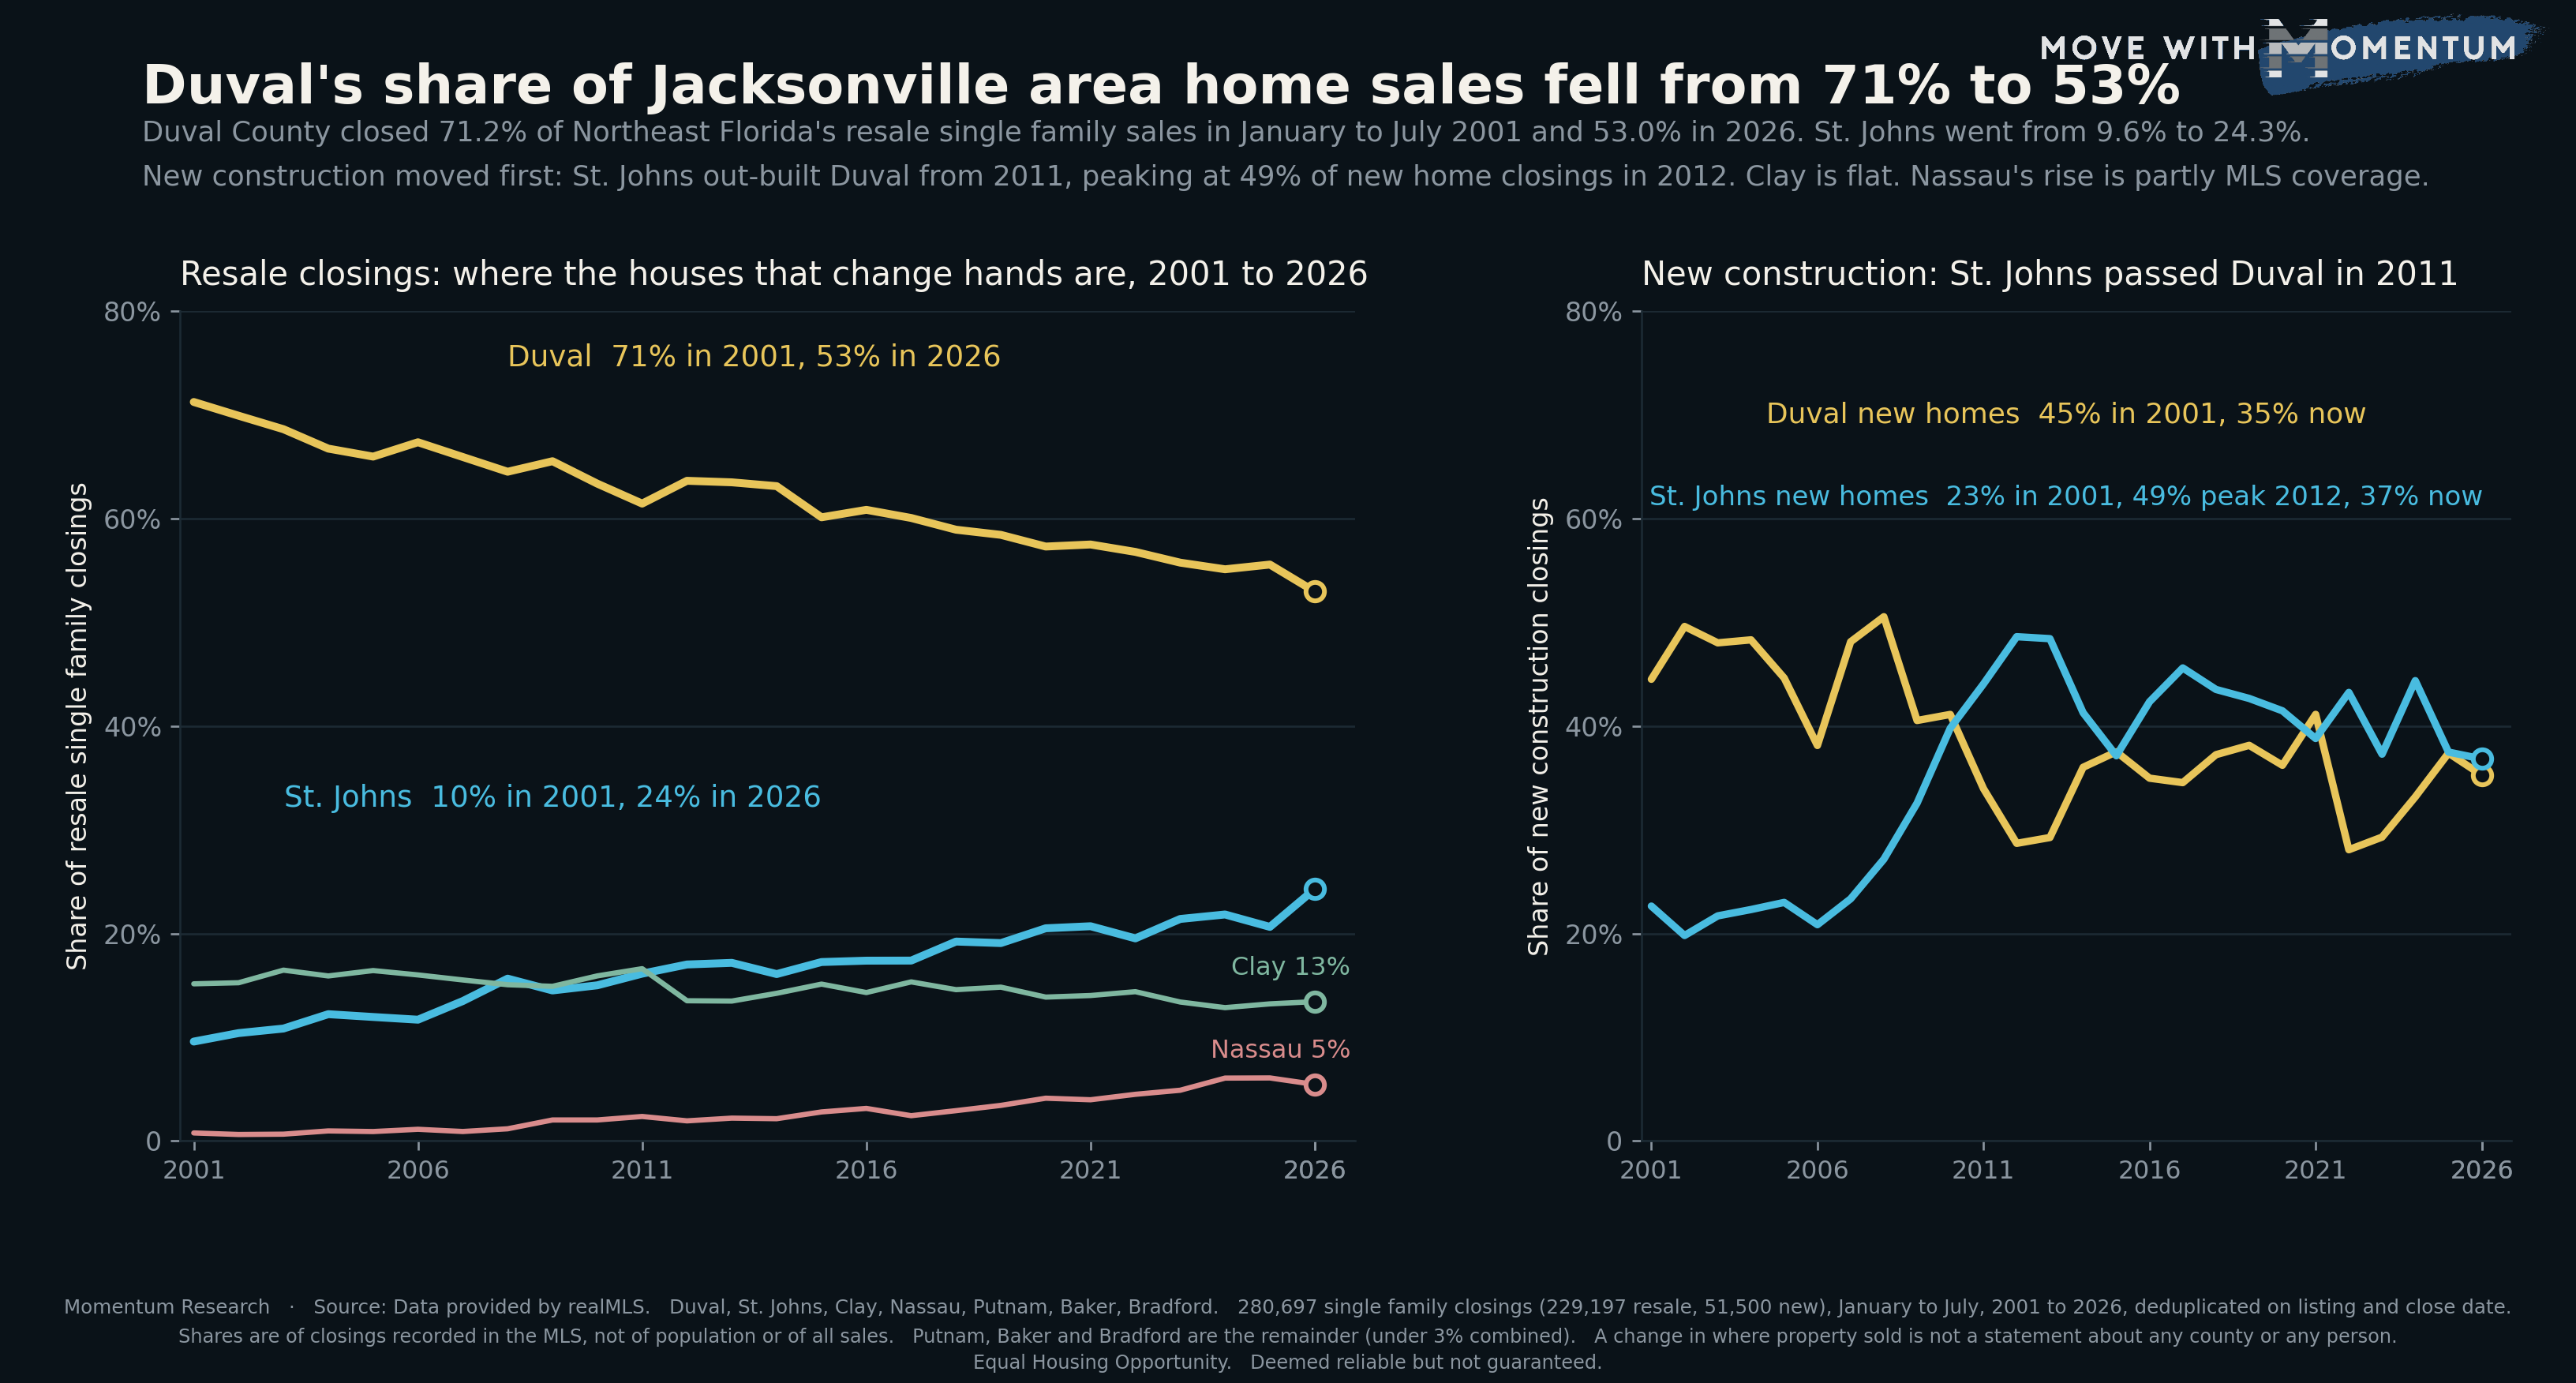
Ask where the Jacksonville housing market is and most people will say Duval County, because that is where Jacksonville is. Twenty-six years of closings say the answer has been moving the whole time, and the pace has not slowed. In January to July 2001, Duval County was where 71 out of every 100 resale houses in the seven realMLS counties changed hands. In January to July 2026 it was 53.
We took every closed single family sale in the seven realMLS counties back to 2001, deduplicated on listing id plus close date, split new construction from resale using the MLS flag, and counted where each closing was. Every year uses January through July, so a partial 2026 is measured against the same seven months of every earlier year. That is 280,697 closings, 229,197 of them resale and 51,500 new construction.
Duval went from 71% to 53% with almost no reversals
Duval's share of resale single family closings reads 71.2% in 2001, 66.0% in 2005, 63.6% in 2012, 58.4% in 2019, 55.6% in 2025 and 53.0% in 2026. Across 25 year-over-year steps it rose in only six, and none of those gains reached two points. Every other step was down. This is not a cycle. It is one direction for a quarter century.
The other side of the ledger is almost entirely St. Johns. Its resale share went from 9.6% to 24.3%, a gain of 14.7 points against Duval's loss of 18.2. Nassau gained 4.7 points (0.8% to 5.5%). Clay lost 1.8 points (15.2% to 13.4%). Putnam, Baker and Bradford together stayed under 5% throughout.
The 2026 reading is also the largest single-year move for St. Johns in the series: 20.6% in January to July 2025 to 24.3% in the same months of 2026, up 3.7 points. One year is one year and the next reading may give some of that back, but it lands on top of a line that has risen in 18 of 25 steps.
Counting new homes too, Duval is now under half
Resale is the cleaner measure because it reflects the whole housing stock rather than where builders happen to be active this year. But the combined figure matters for anyone who thinks of the market as one thing. Counting new construction and resale together, Duval's share of single family closings was 66.5% in 2001 and 49.1% in 2026. It first fell under half in 2023 (49.9%), stayed there in 2024 (49.5%), bounced to 51.2% in 2025, and is 49.1% now. Three of the last four years, fewer than half of the region's single family sales closed in Duval County.
New construction moved a decade earlier
The right panel of the chart is the part that explains the left panel. In 2001 Duval had 44.5% of new single family closings and St. Johns had 22.6%. The two lines crossed in 2011, when St. Johns reached 44.1% against Duval's 34.0%, and St. Johns peaked at 48.6% in 2012 while Duval sat at 28.7%. For most of the 2010s St. Johns closed more new houses than Duval did.
A house that closes as new construction in 2012 becomes a resale closing the first time its owner sells, typically somewhere between five and fifteen years later. So the new construction mix of 2009 to 2020, which leaned hard toward St. Johns, is the resale mix of the 2020s. The resale line is not tracking today's building. It is tracking the building of a decade ago, which is why it keeps moving after the new construction lines have converged.
And converged they have. In 2026 St. Johns holds 36.8% of new single family closings and Duval 35.3%. Clay, at 19.2%, has its largest new construction share since 2007. If the lag logic holds, the resale shift toward St. Johns should keep running for several more years on the strength of what was already built, then slow.
The rivals we tested
MLS coverage is a real caveat for one county and not for the others. Nassau's rise from 0.8% to 5.5% of resale closings almost certainly overstates the true shift, because realMLS coverage of Nassau listings widened over the period. We are reporting Nassau's line as partly a coverage effect. Duval, St. Johns and Clay have been core realMLS counties for the whole series, so the 18-point Duval decline and the 15-point St. Johns gain are not coverage artifacts. Even if every one of Nassau's 4.7 gained points were coverage, Duval's line would still have fallen 13 points.
The new construction flag did not ramp from zero. New construction was 17.9% of single family closings in 2001 and 21.8% in 2026, and stayed inside a 12% to 26% band in every year, with the low in 2011. So the resale and new construction lanes are defined the same way at both ends of the series.
The partial-year artifact was handled by construction. Every year uses the fixed January to July window. We also ran the full-calendar-year view for the 25 complete years and it reads the same: Duval's resale share 70.7% in 2001, 63.6% in 2012, 58.6% in 2019, 55.6% in 2025.
What the data cannot tell you
This is a count of where property that sold through the MLS was located. It is not a population measure, it is not a count of every home sale in the region (for-sale-by-owner and some builder direct sales never enter the MLS), and it does not say why the location of sales moved. Land availability, where builders held entitled lots, road and utility extensions, and the price of the land itself are all candidate explanations and none of them is in the record. Nothing on this page describes any person or household, and nothing on it is a statement about any county's desirability. It says where houses sold.
How agents can use this data
Four uses, all of them about the market for property, none of them about anybody's choice of where to live:
- Size a farm area by where the closings actually are. A quarter of the region's resale single family closings are now in St. Johns County, up from a tenth. Prospecting plans and marketing budgets built on the 2001 map are pointed at a market that is 18 points smaller than it was.
- Read a county market report against the regional denominator. When Duval closings are flat and St. Johns closings are up, the regional total can be up while the largest county reads soft. Knowing the shares (53% and 24%) tells you how much each county's move weighs in the regional number before you quote it.
- Use the new construction panel as a leading indicator for resale inventory. Where builders closed the most houses in 2012 to 2020 is where the resale listings of the next several years come from. Clay's 2026 new construction share, 19.2%, is its highest since 2007, and that is a resale pipeline for the early 2030s.
- Anchor the conversation on closings, not on population or on headlines. The chart counts recorded sales of houses. It is a defensible number in a listing presentation precisely because it makes no claim about people.
If you use any of these figures with a client, cite the source and the date: Momentum Research analysis of data provided by realMLS, January to July 2026. Market data moves, and a number without a date attached invites an argument you do not need to have.
What this measurement does not do
This is a share of MLS-recorded closings by county. It is not a controlled test and it does not identify a cause. It only sees homes sold through the MLS. And it is a measurement of where property sold and nothing else: it says nothing about any person or household. Related work on the same archive looks at how prices differ across the same seven counties and at how much finished new construction is standing unsold.
People also ask
What share of Jacksonville area home sales are in Duval County?
In January to July 2026, Duval County accounted for 53.0% of resale single family closings recorded in realMLS across its seven Northeast Florida counties, down from 71.2% in the same months of 2001. Counting new construction as well, Duval's share was 49.1%, and it has been under half in three of the last four years (2023, 2024 and 2026). These are shares of closings recorded in the MLS, not of population and not of every sale in the region.
Which Northeast Florida county has gained the most home sales share?
St. Johns County. Its share of resale single family closings rose from 9.6% in January to July 2001 to 24.3% in January to July 2026, a gain of 14.7 points, so about one resale house in four now closes in St. Johns against one in ten at the start of the series. Nassau rose from 0.8% to 5.5%, but part of that move is wider MLS coverage of Nassau listings over the period. Clay was flat, 15.2% to 13.4%.
Why did the shift to St. Johns show up in new construction first?
Because a new house becomes resale stock once its first owner sells. St. Johns took a larger share of new single family closings than Duval from 2011 and peaked at 48.6% in 2012, when Duval was 28.7%. The houses built in those St. Johns-heavy years are the ones changing hands now, which is why the resale line kept moving for a decade after the new construction line did. The two new construction shares are close again in 2026, 36.8% St. Johns and 35.3% Duval.
Method and limits
Source: data provided by realMLS. Closed single family sales in the authoritative counties of Duval, St. Johns, Clay, Nassau, Putnam, Baker and Bradford. Records are deduplicated on listing id plus close date. 280,697 single family closings across the fixed January to July window, 2001 through 2026, with closings under $10,000 excluded. Of those, 229,197 are resale and 51,500 are flagged new construction.
Resale and new construction are separated by the MLS NewConstructionYN flag, which is agent-entered. Shares are each county's closings divided by the seven-county total for the same lane and window. Putnam, Baker and Bradford are reported as a combined remainder because each is under 3% of the total in every year.
realMLS coverage of Nassau County listings widened over the series, so Nassau's line is reported as partly a coverage effect. Duval, St. Johns and Clay have been core realMLS counties throughout. The new construction flag is present on 12% to 26% of single family closings in every year, so neither lane ramps from zero.
Every year uses the same January to July window, because 2026 is a partial year and an unfixed window would compare a stub against 25 complete years. The full-calendar-year view of the 25 complete years was also run and reaches the same result.
Related reading on the same archive: why the boom-era house is Jacksonville's cheapest per square foot and the ongoing Jacksonville housing market tracker.
All figures on this page are per Momentum Research analysis of data provided by realMLS and are deemed reliable but not guaranteed. Equal Housing Opportunity.