
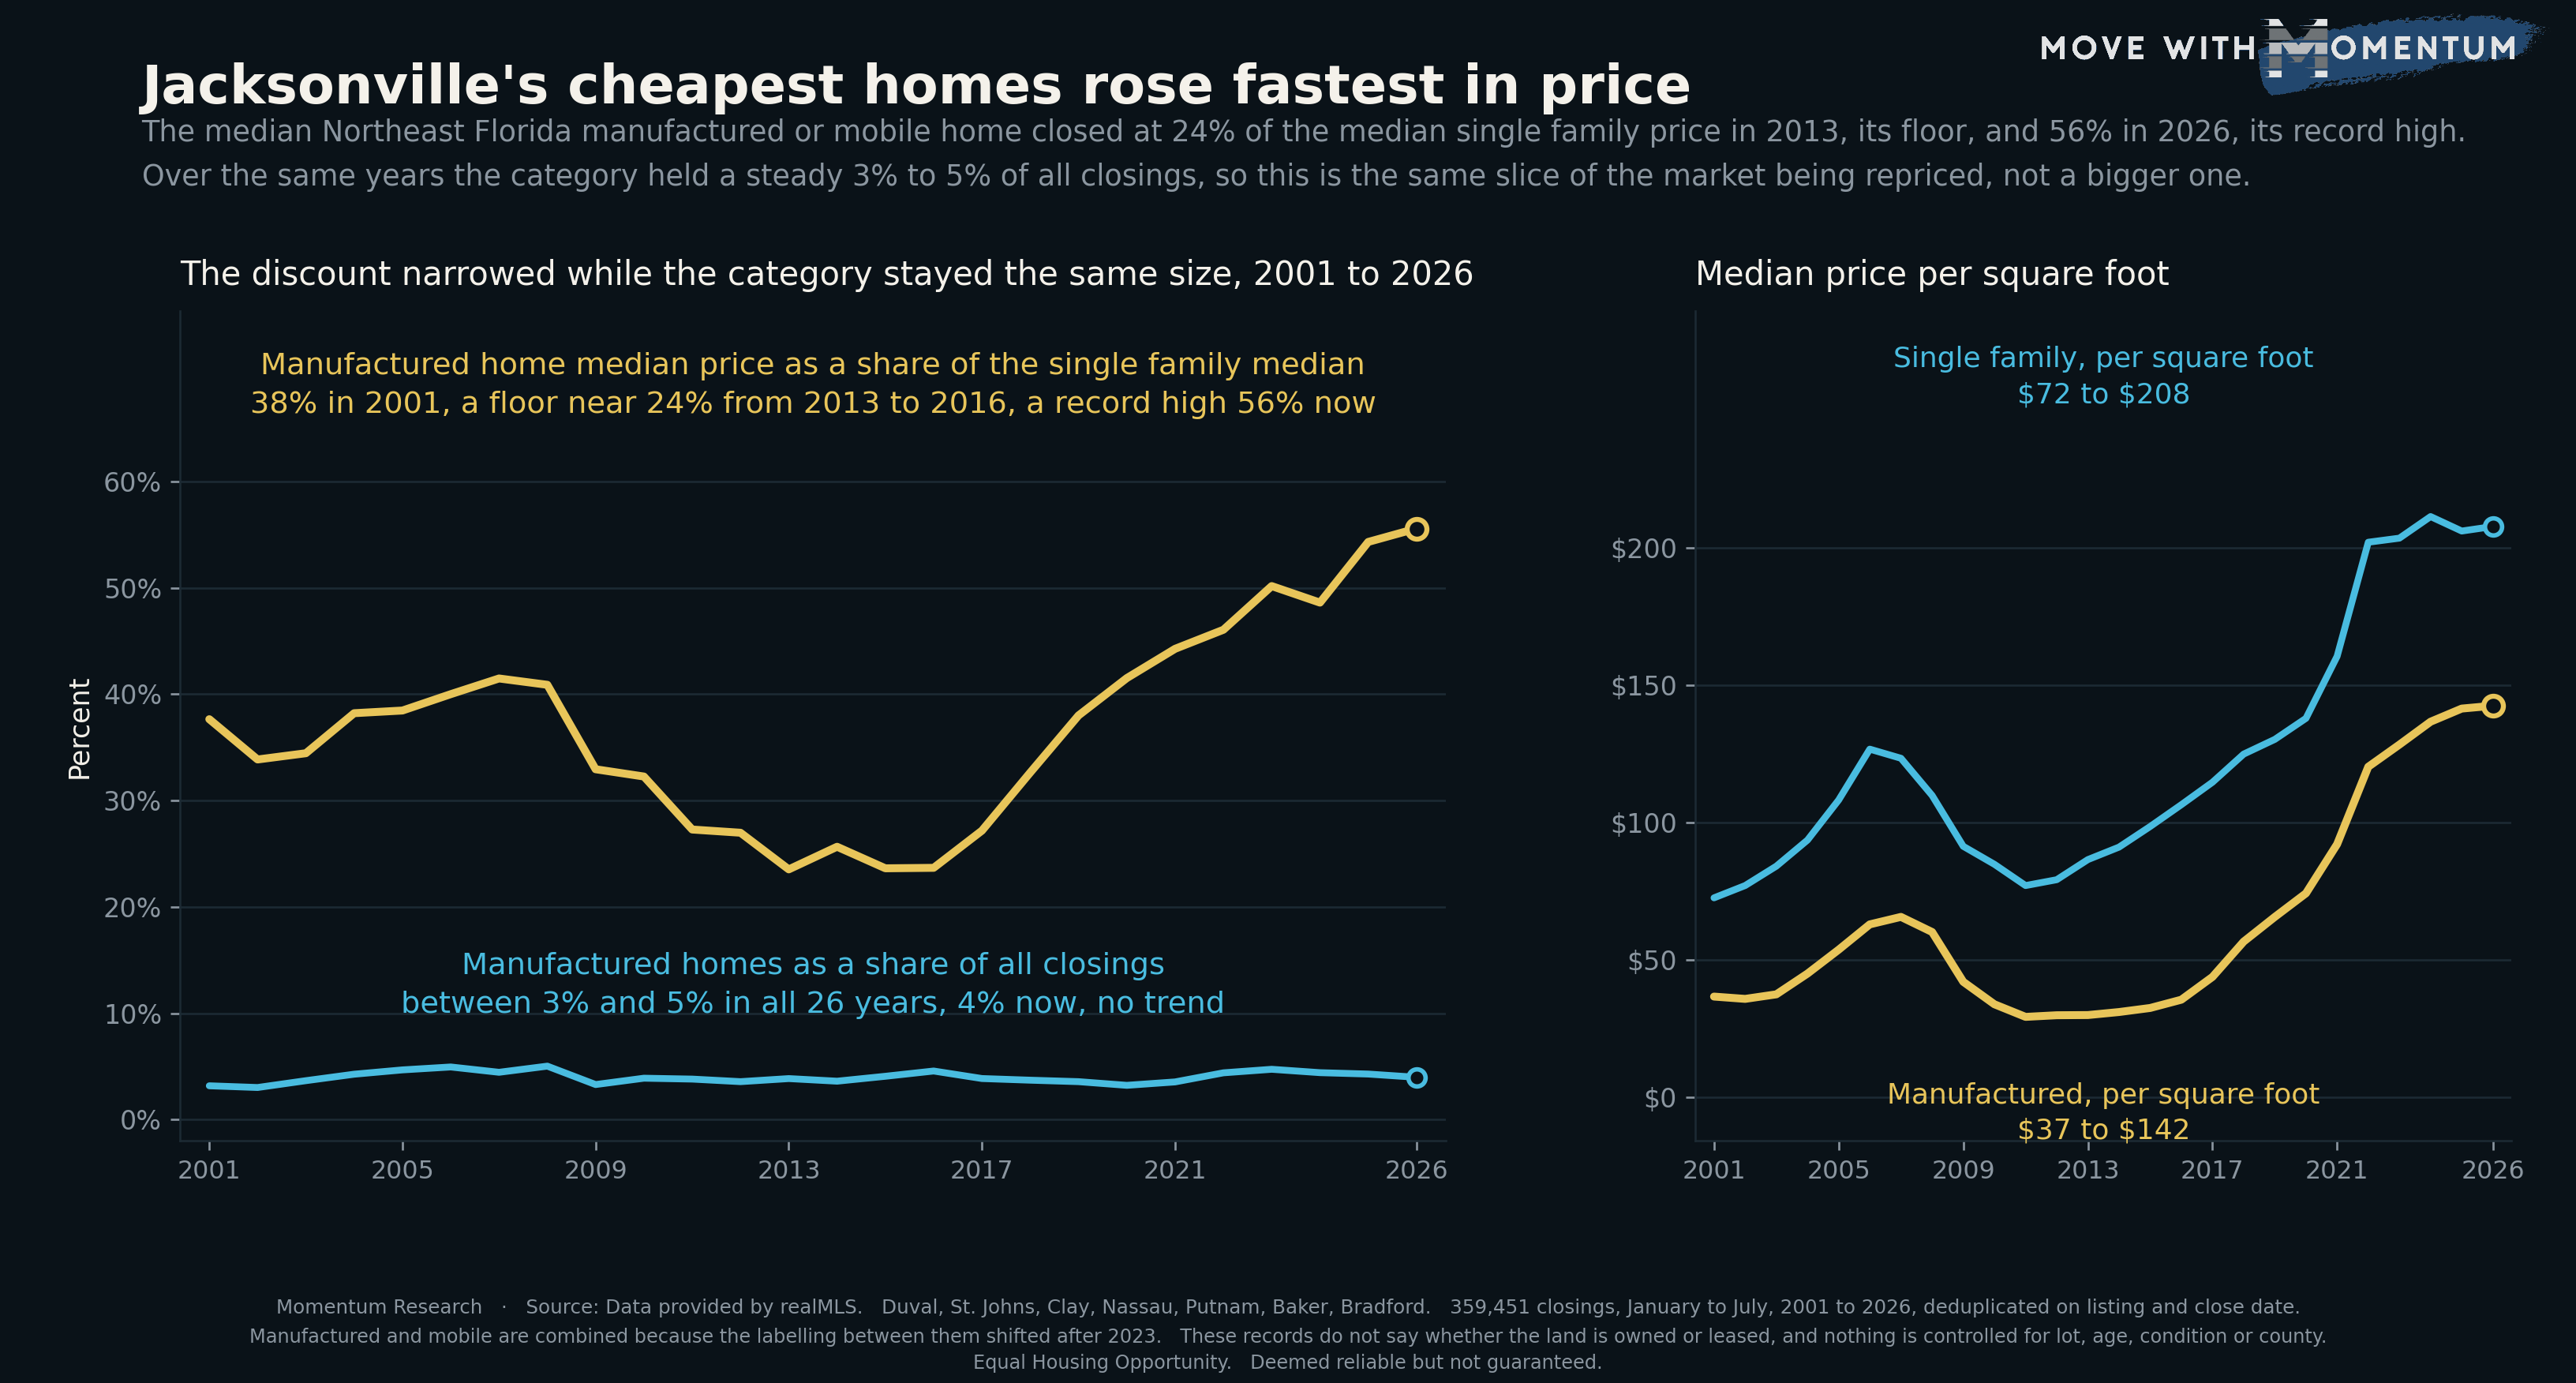
The cheapest way to buy a home in Northeast Florida is not as cheap as it used to be, and the size of the change is larger than almost any other price movement in our archive.
We took every closed residential sale in the seven realMLS counties back to 2001, deduplicated on listing id plus close date, and split it on one field: whether the record was classified as a manufactured or mobile home, or as a single family residence. Then we compared the two medians, year by year, using January through July in every year so that a partial 2026 is measured against the same seven months of every earlier year rather than against twelve. That is 359,451 closings.
The discount was 76% off. Now it is 44% off.
In 2013 the median manufactured or mobile home closed at $40,000 while the median single family house closed at $169,993. The manufactured figure was 23.5% of the single family figure, the lowest reading in the record, and it stayed near that floor through 2016.
In January to July 2026 the two medians are $220,000 and $395,895. The ratio is 55.6%, the highest in 26 years. Put in the terms a buyer would use, the discount went from roughly 76% off to roughly 44% off.
The move is almost entirely on one side. From 2013 to 2026 the manufactured median rose 5.50 times. The single family median over the identical years rose 2.33 times. The larger, more expensive category is not what moved.
The category did not get any bigger
The obvious first suspicion is that the mix changed, that this is a category growing into the market and dragging its own median up with it. It is not.
Manufactured and mobile homes have made up between 3.03% and 5.03% of all closings in every one of the 26 years, and the January to July 2026 figure is 3.99%. There is no trend in that series in either direction. It sits almost perfectly flat across a boom, a crash, a frenzy and a slowdown.
That flat line is the reason the gold line is worth reading. When one series in a dataset moves 32 percentage points and the series that would explain it away does not move at all, the movement is more likely to be real than to be composition.
Per square foot, the same result
Manufactured homes did get bigger over the period, from a median 1,248 square feet in 2001 to 1,488 in 2026, about 19%. Single family homes grew too, 1,770 to 1,940, about 10%. Some of the closing gap is simply more floor area, so the per-foot series is the honest check.
It survives. Measured from the 2011 low, the manufactured median went from $29.20 to $142.40 per square foot, about 4.9 times, while single family went from $77.00 to $207.60, about 2.7 times. The gap narrows on a per-foot basis for the same reason it narrows on price.
They also stopped being slow to sell
A second corroboration comes from a field the price series never touches. In 2001 a manufactured home took a median 79.5 days on market against 41 days for a single family house, close to twice as long. In January to July 2026 the two figures are 34 and 36 days, and the manufactured lane is now marginally the faster of the pair.
Two independent measurements, price and time, moved the same way over the same period. That is a stronger reading than either one alone.
The rivals we tested, including one that partly held
Three alternative explanations were run and reported here whether or not they were convenient.
Age drift failed. If the manufactured homes selling today were much newer stock than the ones selling in 2001, that alone could lift the median. The median year built of manufactured homes sold moved from 1987 to 1999 across 25 calendar years, while single family moved from 1989 to 2005. The comparison group got newer faster, which works against the finding rather than for it.
County mix partly held, so we checked it directly. Putnam County accounted for 43% of manufactured closings in 2001 and 31% in 2026. Putnam carries the lowest median prices of the seven counties, so a shift away from it would push the manufactured median up on its own. Restricting to Putnam alone, the ratio still rises, from 45.0% to 58.8%. But that single-county series is noisy and one earlier year, 2012, already reached a similar level, so it supports the reading rather than settling it. County mix is a genuine partial contributor here and we are not going to pretend otherwise.
The partial-year artifact was handled by construction. Every year uses the fixed January to July window.
A labelling trap worth knowing about
One methodological note that changed how this was built. The archive carries two labels inside this category, "Manufactured Home" and "Mobile Home", and the split between them moved sharply. In 2015 the Manufactured label was 576 of 635 records, about 90%. In 2026 it is 354 of 646, about 55%.
A series built on the Manufactured label alone would therefore show a dramatic collapse starting in 2024 that is nothing but records moving from one label to the other. The combined category is stable; its internal labelling is not. Everything on this page combines the two.
How agents can use this data
Four uses, all of them about pricing property and setting expectations, none of them about anybody's decision to buy or sell:
- Stop using an old rule of thumb for the discount. If a valuation habit is anchored on a manufactured home being worth a quarter of a comparable house, that habit is calibrated to 2013 to 2016 and is roughly 30 percentage points out of date against the current median relationship.
- Price the per-foot number, not the category. The 2026 medians are $142.40 and $207.60 per square foot. That is a defensible starting point in a listing conversation and it is far more specific than a category-level rule.
- Reset the marketing-time expectation. A median 34 days against 36 for single family is a different conversation than the 2001 figures of 79.5 against 41. Time on market is no longer a reason to price defensively in this category.
- Establish the land question first. This record cannot tell a home on owned land from one in a land-lease community, and neither can a median. Whether the land conveys is the first fact to establish on any file in this category, because it changes the comparable set entirely.
If you use any of these figures with a client, cite the source and the date: Momentum Research analysis of data provided by realMLS, January to July 2026. Market data moves, and a number without a date attached invites an argument you do not need to have.
What this measurement does not do
The single largest limitation is the one named above. These fields do not record whether the land under a manufactured home is owned or leased, and those are two different products at two different prices. A shift in the mix between them over 26 years would move this series and we cannot see it.
Nothing here is controlled for lot size, condition, age, county or park status, and the two groups differ on all of them, so this is a comparison of two raw medians rather than a controlled test. It also only sees homes sold through the MLS, which is not every transaction in this category.
Finally, this is a measurement of property prices and nothing else. It says nothing about any person, household or place, only about what two classes of property sold for. Related work on the same archive looks at how price per square foot varies by home size.
People also ask
How much does a manufactured home cost in Jacksonville?
The median manufactured or mobile home closing recorded in the seven realMLS counties from January through July 2026 was $220,000, against a median single family close price of $395,895 over the same months. That is 55.6% of the single family figure. Ten years earlier, in 2016, the same two medians were $48,780 and $206,041, or 23.7%. These are medians of recorded closings and not appraisals, and the record does not say whether the land under any given home was owned or leased.
Are manufactured homes still cheaper than houses in Northeast Florida?
Yes, but by much less than they were. The gap between the two medians was widest from 2013 through 2016, when a manufactured home closed at roughly 24% of the single family median, or about 76% below it. In January to July 2026 that figure is 55.6%, or about 44% below, which is the narrowest reading in the 26 years on record. On a per square foot basis the two are $142.40 and $207.60.
Did manufactured homes become a bigger part of the Jacksonville market?
No, and that is what makes the price move interesting. Manufactured and mobile homes have accounted for between 3.03% and 5.03% of Northeast Florida closings in every one of the 26 years measured, with no trend in either direction, and the January to July 2026 figure is 3.99%. The category did not grow or shrink. The same small, stable share of the market was repriced against everything around it.
Method and limits
Source: data provided by realMLS. Closed residential sales in the authoritative counties of Duval, St. Johns, Clay, Nassau, Putnam, Baker and Bradford. Records are deduplicated on listing id plus close date. 359,451 closings across the fixed January to July window, 2001 through 2026, with closings under $10,000 excluded.
The category is defined as PropertySubType of "Manufactured Home" or "Mobile Home", combined, and the comparison group is PropertySubType of "Single Family Residence". Per square foot figures use living area between 300 and 15,000 square feet. Days on market are clipped to a 0 to 730 day range. A year needs at least 30 manufactured closings and 500 single family closings to be plotted.
PropertySubType is populated on 100.0% of records in all 26 years, so this series carries none of the ramp-from-zero field artifact that affects several other fields in the same archive. The labelling split inside the category did move, which is why the two labels are combined rather than charted separately.
Every year uses the same January to July window, because 2026 is a partial year and an unfixed window would compare a stub against 25 complete years.
Related reading on the same archive: what day Northeast Florida homes actually close on and the ongoing Jacksonville housing market tracker.
All figures on this page are per Momentum Research analysis of data provided by realMLS and are deemed reliable but not guaranteed. Equal Housing Opportunity.