
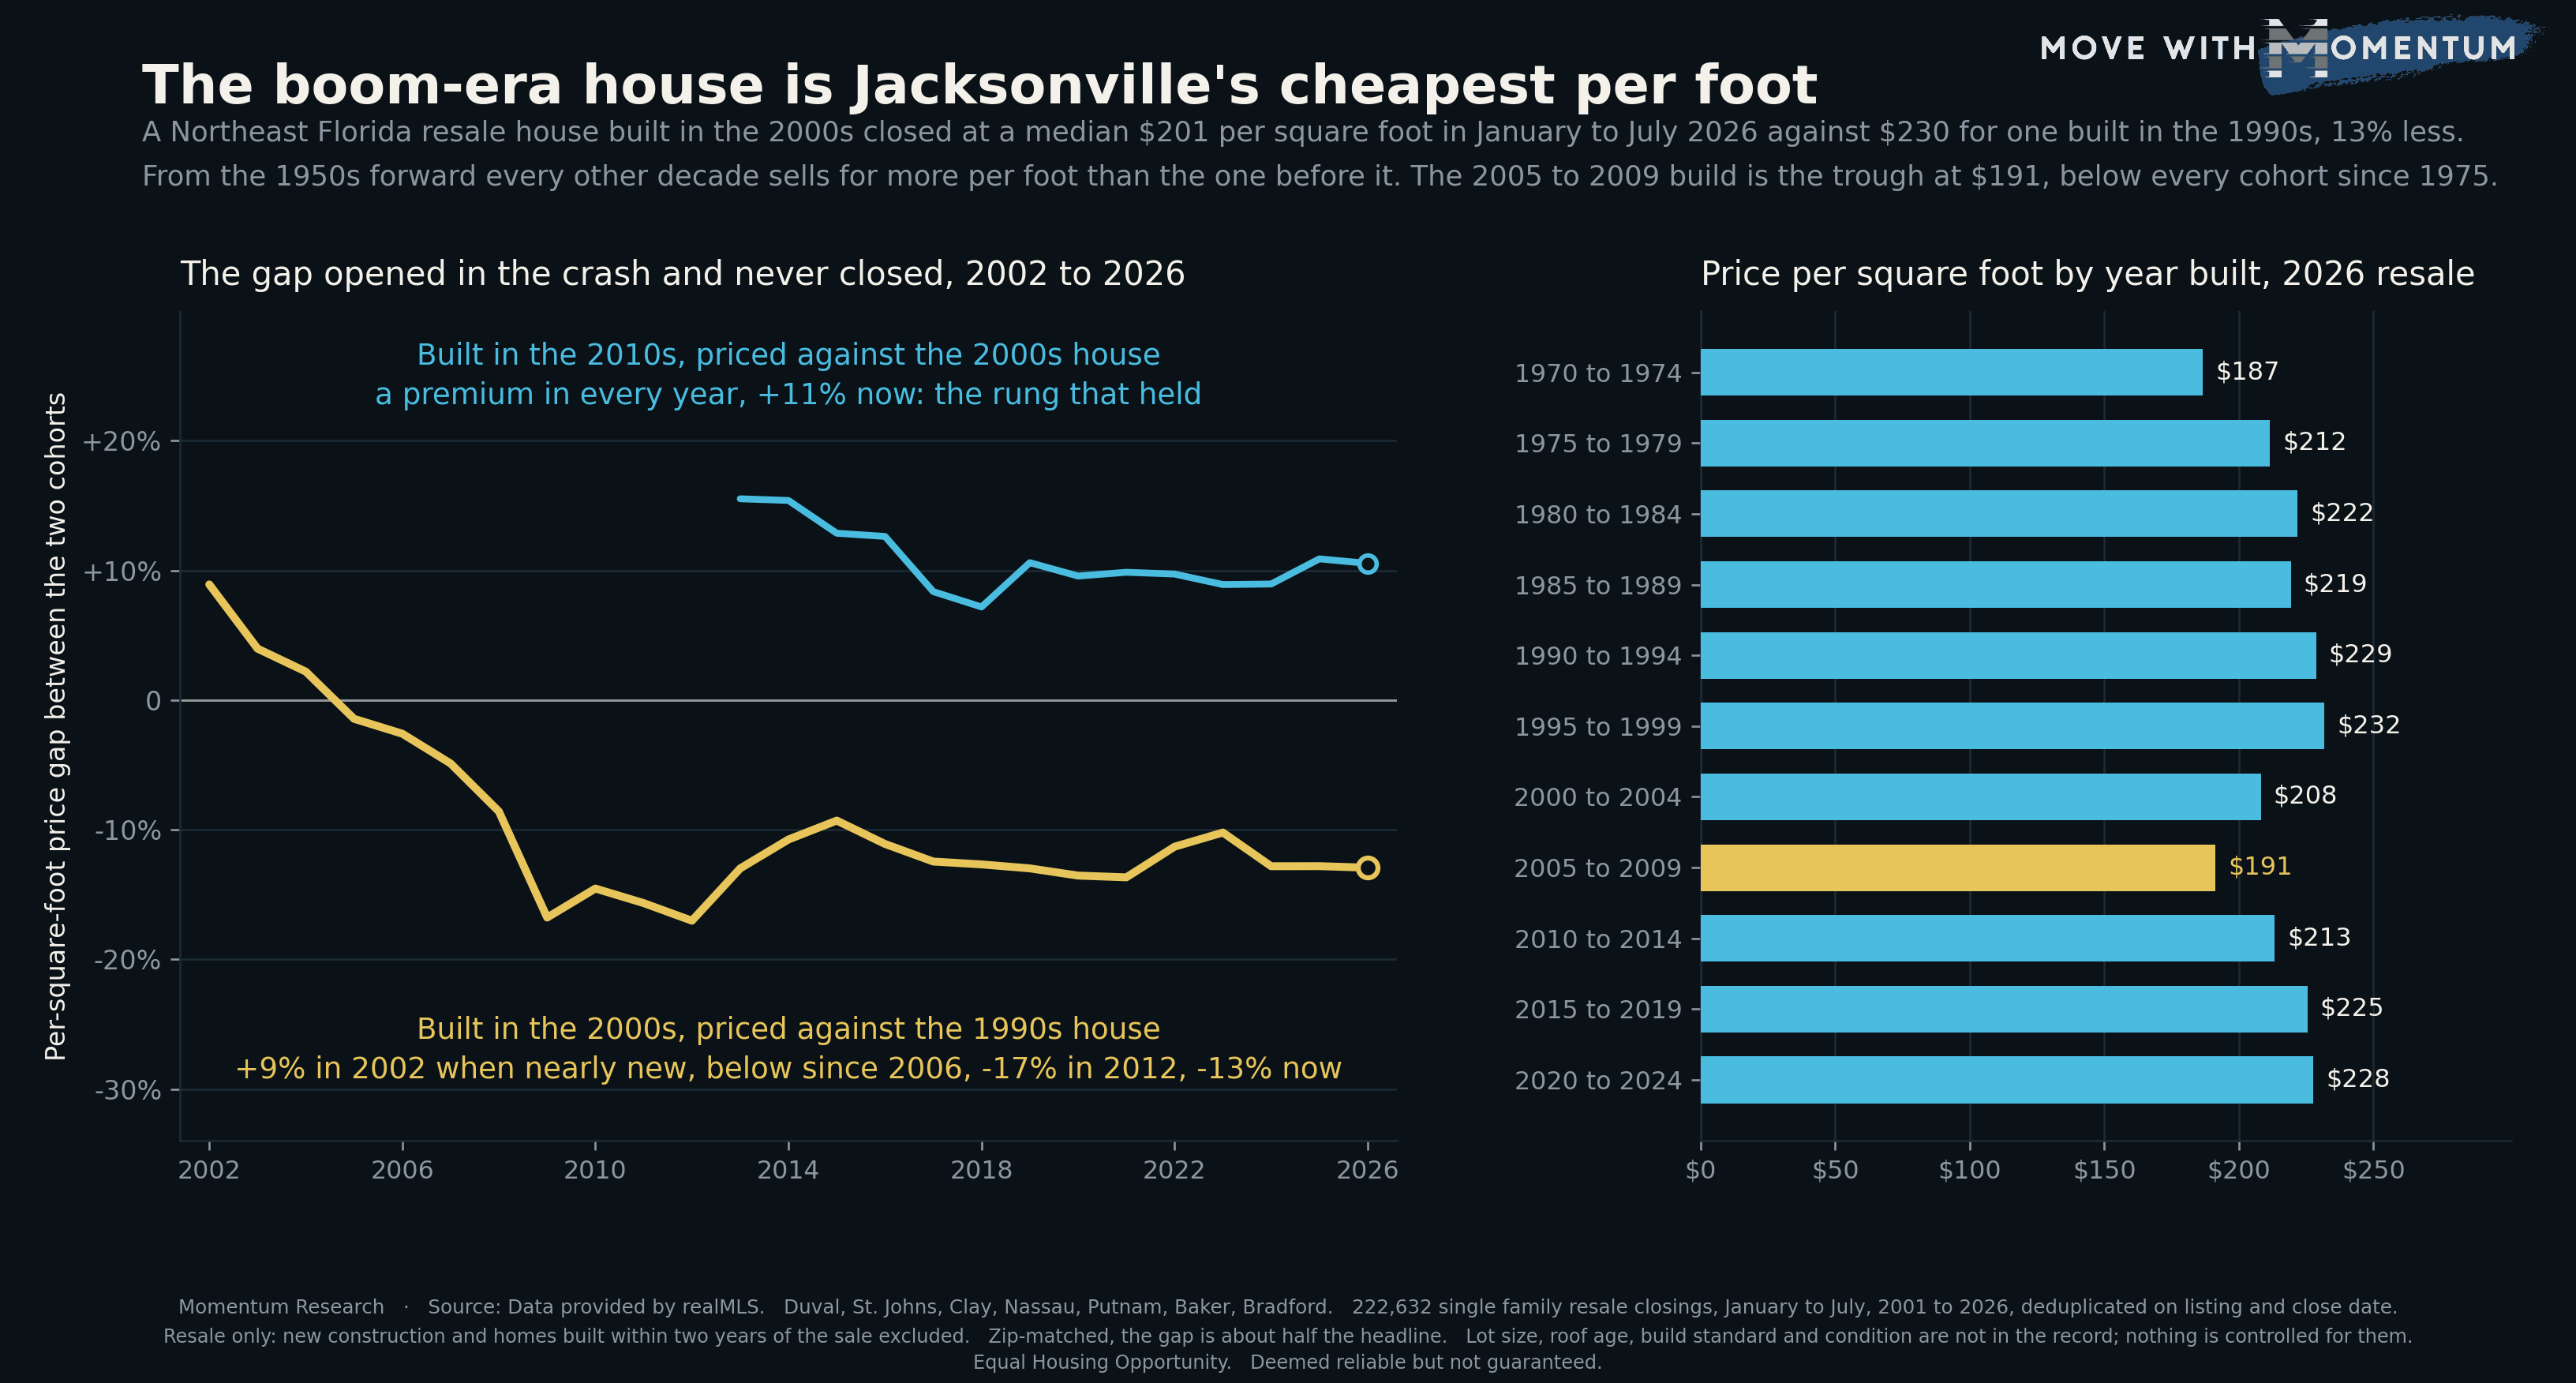
There is a ladder in Northeast Florida home prices that almost everyone assumes and almost nobody checks: the newer the house, the more it costs per square foot. Checked against 26 years of closings, the ladder holds from the 1950s forward with one exception, and the exception is the decade that built more of the region's housing stock than any other.
We took every closed single family sale in the seven realMLS counties back to 2001, kept only resales (no new construction, and nothing built within two years of the sale), deduplicated on listing id plus close date, and split the result by the decade the house was built. Every year uses January through July, so a partial 2026 is measured against the same seven months of every earlier year. That is 222,632 closings.
The 2000s house sells for 13% less per foot than the 1990s house
In January to July 2026 the median resale house built in the 1990s closed at $230 per square foot. The median house built in the 2000s closed at $201. That is 12.9% less for the newer house.
The full ladder reads: 1950s $172, 1960s $173, 1970s $198, 1980s $220, 1990s $230, 2000s $201, 2010s $222, 2020s (resale only) $228. Every rung rises on the one before it except the 2000s, which drops below the 1980s and lands within three dollars of the 1970s. Houses built before 1950 close at $180 and sit above the 1950s stock, which is a separate story about historic districts that this piece does not try to tell.
Narrowed to five-year cohorts, the trough is sharper. Houses built in 2005 to 2009 closed at $191 per square foot, below every cohort built since 1975. The 1975 to 1979 house closed at $212. The 2000 to 2004 house closed at $208. The only cohort priced lower is 1970 to 1974, at $187.
The gap opened in the crash and never closed
This was not always true. When the 2000s house was nearly new it carried a premium over the 1990s house: +9% in 2002, +4% in 2003, +2% in 2004. It crossed below in 2005, was 9% below by 2008 and 17% below by 2009. The bottom was -17% in 2012. Since 2013 the gap has sat between -9% and -14% in every single year, and it reads -13% now.
A premium that fades as a cohort ages is normal. What is not normal is the cohort falling below the one before it and staying there for 17 years. The 1990s house, for comparison, still holds a 4.5% premium over the 1980s house.
The rung that held is the control
The obvious rival reading is that this is just what happens to every cohort once it stops being new, and the 2000s house is simply the one that stopped being new most recently. The 2010s cohort answers that.
Houses built in the 2010s have carried a premium over houses built in the 2000s in every year they have had enough sales to measure: +16% in 2013, a low of +7% in 2018, and +11% in 2026. The 2010s house is now well past nearly new, and it has not fallen below its predecessor. The inversion is specific to the 2000s build.
The rivals we tested, including one that partly held
County mix works against the finding. If 2000s houses were concentrated in cheaper counties, that alone would explain the gap. They are not. 29% of 2000s-built closings are in St. Johns, the priciest county, against 21% of 1990s-built. The 2000s lane leans toward expensive ground and is still cheaper. Inside Duval alone the gap is wider, $184 against $225, about 18%. St. Johns alone reads $235 against $313. Clay alone reads $180 against $202. It holds in all three.
Size does not explain it. The 2000s house is bigger, a median 2,231 square feet against 1,952 for the 1990s house, and bigger houses carry lower per-foot prices. Fixing the band at 1,800 to 2,400 square feet, so both cohorts are the same size, leaves $192 against $226, about 15%. The gap survives the size control at full strength.
Location partly holds, and we are reporting it that way. County is a coarse control. Matching at the zip code level for 2024 to 2026 resales, in the 20 zip codes with at least 30 closings from each cohort, the 2000s house is cheaper per foot in 17 of 20, with a median gap of -5.8%. That is about half the headline figure. So location within a county is a genuine partial contributor: roughly half the gap is where the houses are, and the other half sits inside the same zip code and is about the houses themselves.
The partial-year artifact was handled by construction. Every year uses the fixed January to July window. We also ran the unfixed full-calendar-year view and the gap reads the same, -12.5% for 2026 and between -10% and -17% in every year since 2009.
What the data cannot tell you
Nothing on this page identifies a cause. The record carries a year built, a living area, a price and a location. It does not carry lot size, roof age, construction standard, whether the house sits in a community development district, or condition. The cohorts differ on all of those and none of them is controlled.
Three explanations are worth testing and are named here as hypotheses only. Subdivisions platted in the 2000s were often denser than 1990s subdivisions, so the same house may sit on less land. A roof or air handler installed in 2005 is at or past the age where Florida insurers start asking questions, and a 1990s house has often had its first replacement already. And the 2000s cohort is where the crash's distressed inventory concentrated, though 2026 is a long way from 2012 and the gap did not close as the distress cleared, which argues against that one.
Days on market is only mild corroboration. The 2000s house took a median 29 days in 2026 against 24 for the 1990s house and 26 for the 1980s house. Same direction, small difference.
How agents can use this data
Four uses, all of them about pricing property, none of them about anybody's choice of house:
- Do not let year built stand in for value on a comp sheet. A 2006 house and a 1996 house of the same size in the same zip code are not interchangeable comps. The per-foot medians say the older one has been pricing higher for 17 years, and roughly half of that gap survives inside the same zip.
- Price the 2005 to 2009 house on its own cohort. If a listing was built in those years, the relevant per-foot benchmark is $191, not the $201 decade figure and not the $230 a 1990s comp two streets over would suggest. Pulling comps from the same five-year build window removes an argument before it starts.
- Use the size control in the conversation. The 1,800 to 2,400 square foot band gives a like-for-like number, $192 against $226. That is more persuasive to a seller anchored on the neighbor's price than a decade-wide median.
- Treat roof and system age as the first question on a boom-era file. The data cannot see it, but a replacement date is the single fact most likely to move a 2005 to 2009 house off the cohort median in either direction, and it is a fact the seller can produce.
If you use any of these figures with a client, cite the source and the date: Momentum Research analysis of data provided by realMLS, January to July 2026. Market data moves, and a number without a date attached invites an argument you do not need to have.
What this measurement does not do
This is a comparison of raw medians between groups of houses that differ on lot, age, condition, location and build standard. It is not a controlled test and it does not say what any individual house is worth. It only sees homes sold through the MLS. And it is a measurement of property prices and nothing else: it says nothing about any person or household, only about what houses of different build eras sold for. Related work on the same archive looks at how price per square foot varies by home size and at how old the typical home that sells in Northeast Florida is.
People also ask
Which decade of construction is cheapest per square foot in Jacksonville?
Among houses built since 1970, the 2005 to 2009 cohort. In the seven realMLS counties, resale houses built in those years closed at a median $191 per square foot in January to July 2026, below every five-year cohort built since 1975 and above only the 1970 to 1974 cohort at $187. By full decade, the 2000s house closed at $201 against $230 for the 1990s house, $220 for the 1980s and $222 for the 2010s. These are medians of recorded closings, not appraisals.
Do newer homes always cost more per square foot than older ones?
Not in Northeast Florida. From the 1950s forward, each decade of construction sells for more per square foot than the decade before it, with one exception: the 2000s. A house built in the 2000s sold for about 13% less per foot than a house built in the 1990s in January to July 2026, and it has sold for 9% to 17% less in every year since 2009. The 2010s house recovers the pattern and sells for about 11% more per foot than the 2000s house.
Why do 2000s-built homes sell for less per square foot in Jacksonville?
The record does not say, and this analysis does not claim to. Roughly half of the gap survives inside the same zip code, so location is a partial explanation and not the whole one. Lot size, roof age, construction standard and condition are not in the data, and the cohorts differ on all of them. Candidate explanations worth testing include denser subdivision layouts in the 2000s and roofs and mechanical systems from 2005 reaching replacement age, but those are hypotheses, not measurements.
Method and limits
Source: data provided by realMLS. Closed single family sales in the authoritative counties of Duval, St. Johns, Clay, Nassau, Putnam, Baker and Bradford. Records are deduplicated on listing id plus close date. 280,697 single family closings across the fixed January to July window, 2001 through 2026, with closings under $10,000 excluded, of which 222,632 are resales with a valid year built and a living area between 300 and 15,000 square feet.
Resale is defined as a record not flagged as new construction and built at least two calendar years before the sale. Build decade and five-year cohort come from the YearBuilt field. Price per square foot is close price divided by living area. A decade needs at least 60 closings in a year to be reported; the zip code test needs at least 30 closings from each cohort in a zip across 2024 to 2026. Days on market are clipped to a 0 to 730 day range.
YearBuilt is valid on 90.7% to 100% of single family closings in every year, 90.7% to 92.5% in 2001 to 2003 and 98% or better from 2004, so this series carries none of the ramp-from-zero field artifact that affects several other fields in the same archive. YearBuilt is agent-entered and can reflect a permit year rather than a completion year.
Every year uses the same January to July window, because 2026 is a partial year and an unfixed window would compare a stub against 25 complete years. The unfixed view was also run and reaches the same result.
Related reading on the same archive: what happened to manufactured home prices in Northeast Florida and the ongoing Jacksonville housing market tracker.
All figures on this page are per Momentum Research analysis of data provided by realMLS and are deemed reliable but not guaranteed. Equal Housing Opportunity.