
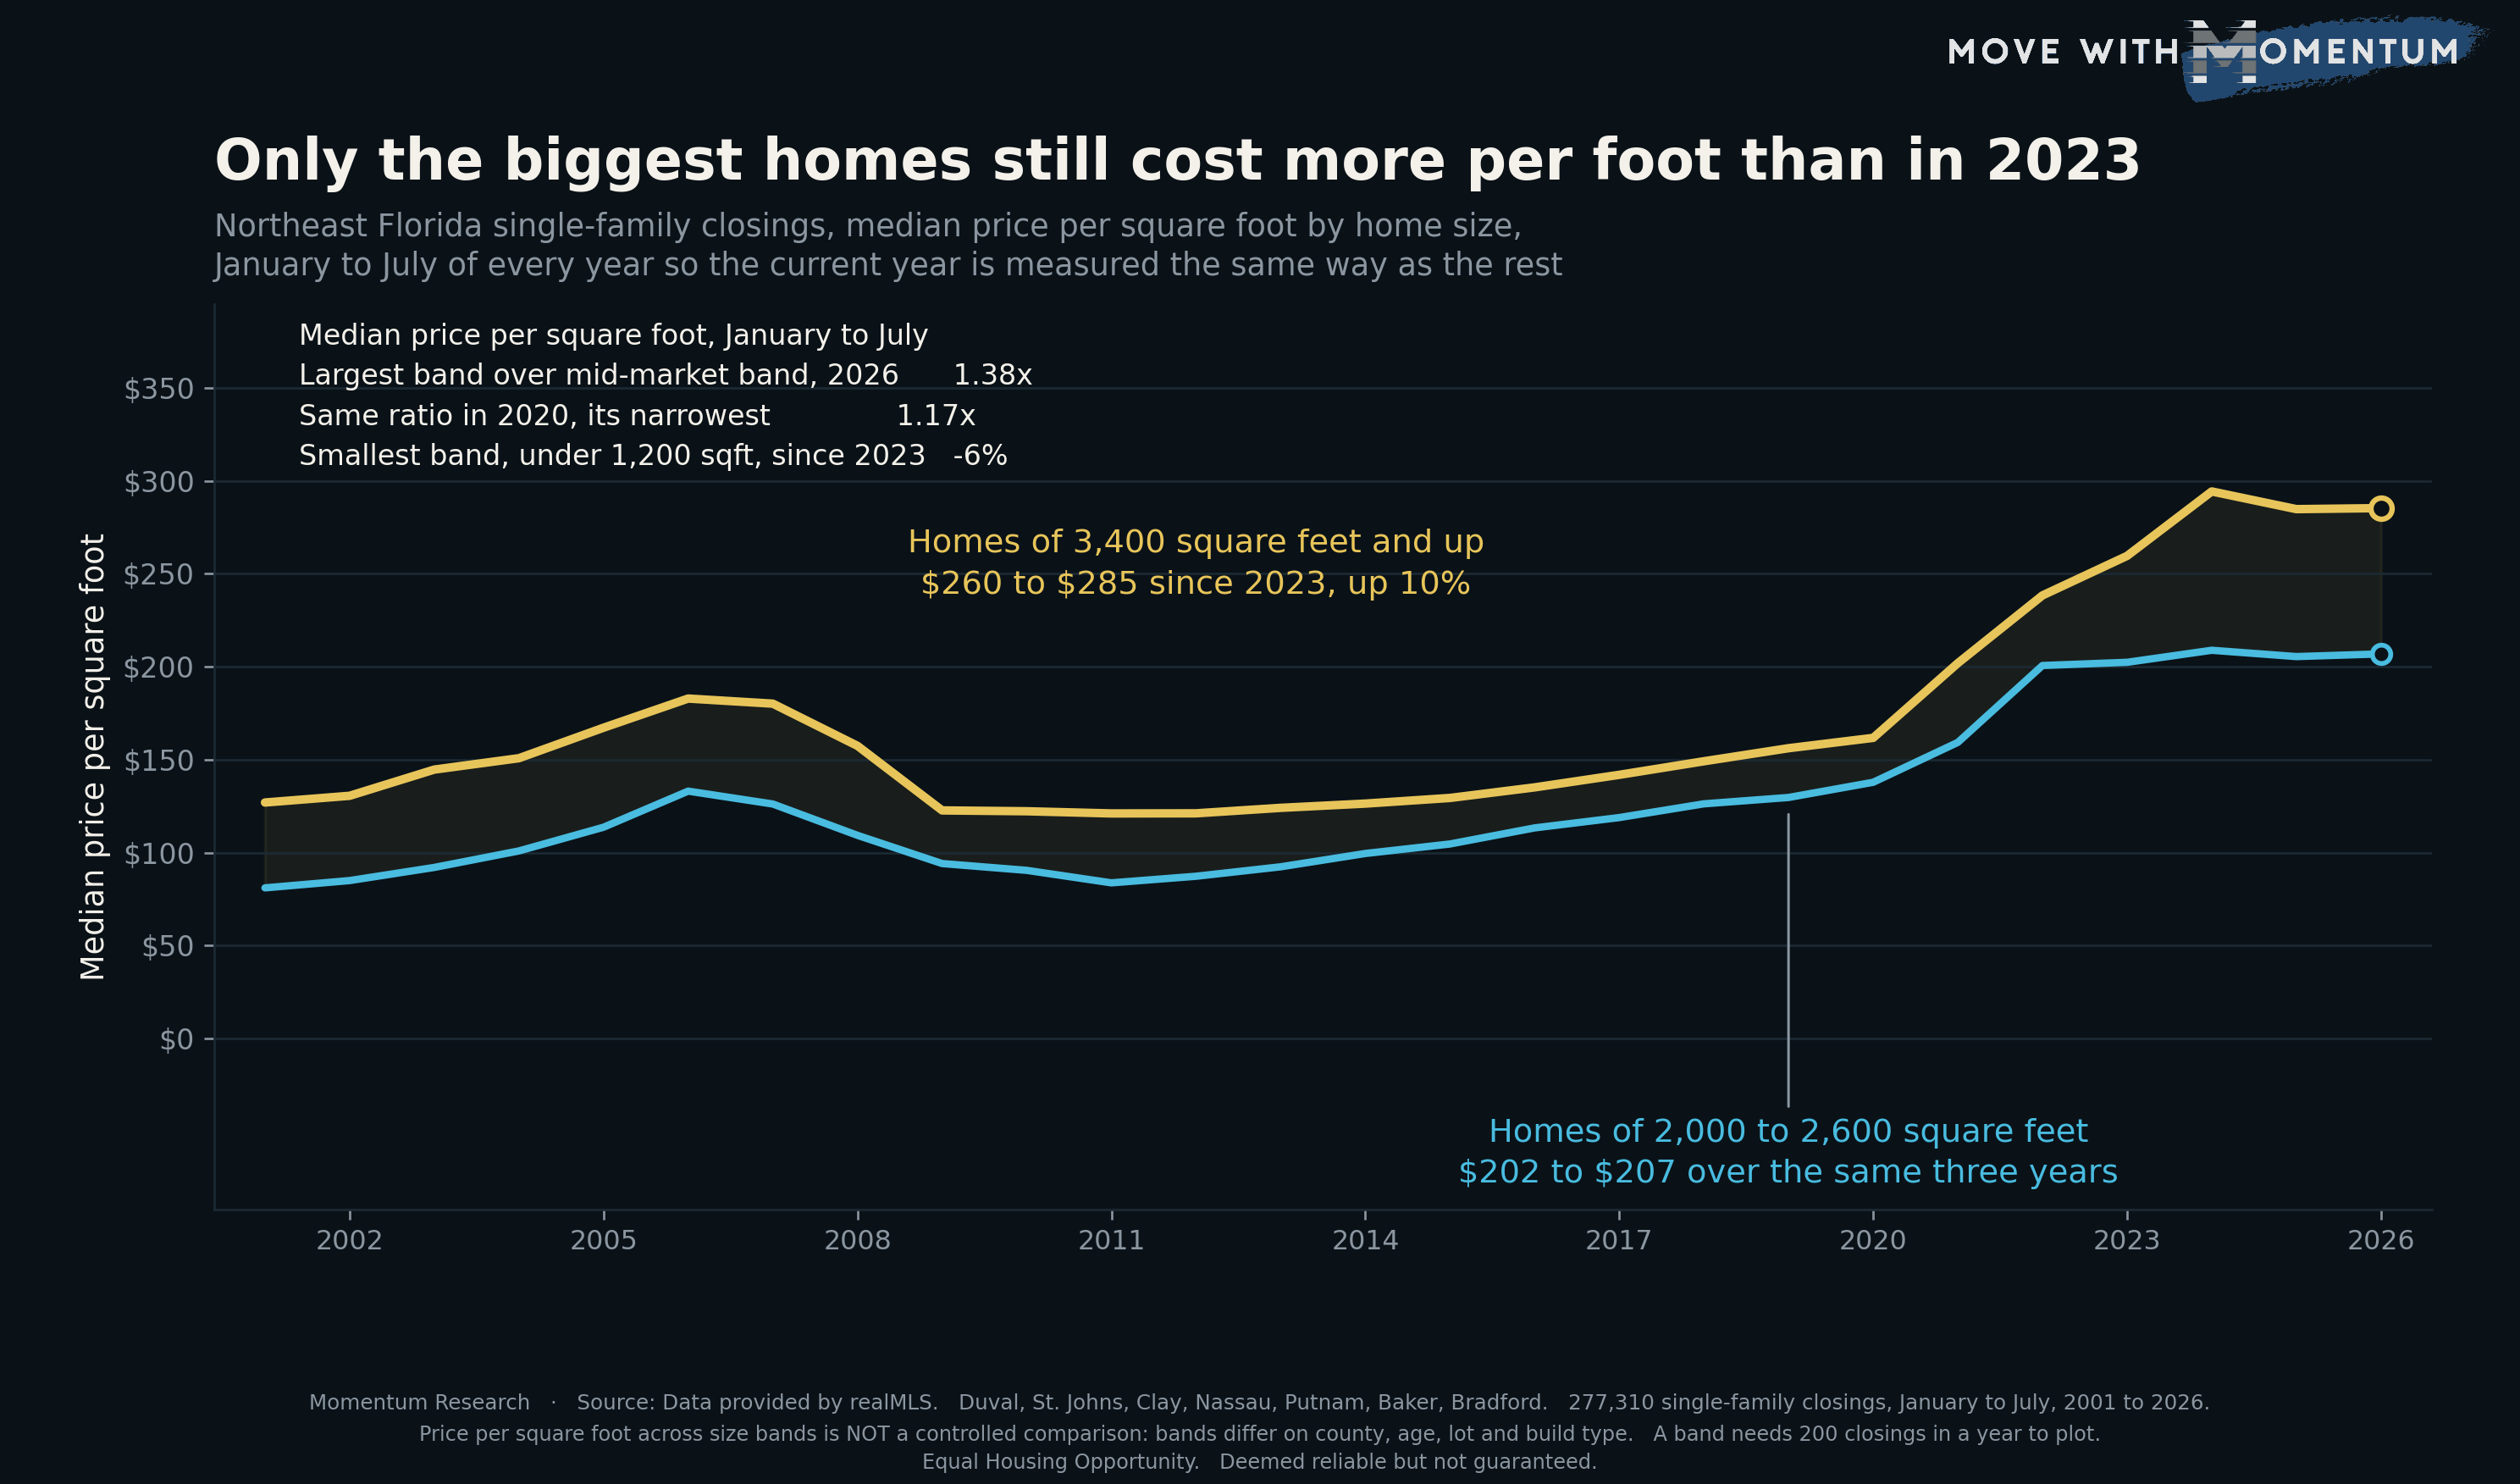
Take every single-family home that closed in Northeast Florida, sort it into six buckets by living area, and track the median price per square foot in each one. For most of the last 25 years those six lines moved as a group. Since 2023 they have not.
Five of the six are effectively where they were three years ago. The sixth, homes of 3,400 square feet and up, is about 10% higher. It is the only size band in the market that a buyer pays more per foot for today than in 2023.
Five of the six size bands stopped moving in 2023
Here is the whole market in one table. Median price per square foot, January to July closings, 2023 against 2026.
- Under 1,200 sqft: $189 to $178, down 6.0%
- 1,200 to 1,600 sqft: $201 to $202, up 0.8%
- 1,600 to 2,000 sqft: $196 to $200, up 2.0%
- 2,000 to 2,600 sqft: $202 to $207, up 2.2%
- 2,600 to 3,400 sqft: $227 to $227, up 0.1%
- 3,400 sqft and up: $260 to $285, up 9.9%
Four of those six numbers are inside two and a half points over three years. In a market where the regional median price per square foot has roughly tripled since 2011, that is a flat line. Our earlier work on region-wide price per square foot tracked that tripling without splitting it by size; splitting it is what shows that the recent part of the move belongs almost entirely to one lane.
The largest band repriced once, in 2024, and has held it
The gold line did not drift upward. It stepped. The 3,400 square foot and up band closed at a median $260 per square foot in 2023, $294 in 2024, $285 in 2025 and $285 in 2026. Almost the entire gain landed in a single year, and the two years since have been flat to slightly lower.
That matters for how the finding should be read. This is not a large-home lane that is still climbing. It is a lane that repriced once and then stopped, while everything below it stayed where it was. The correct description is a gap that opened and has not closed, not a trend still running.
The underlying prices corroborate it. In that band the median closed price went from $1,005,219 in January to July 2023 to $1,142,500 in the same window of 2026, a rise of about 13.7%, on a median home size that barely moved: 3,814 square feet then, 3,873 now. The band is not selling bigger houses. It is selling houses of the same size for more.
The smallest homes are the only band that actually fell
The under 1,200 square foot band is the one moving the other way. It peaked at $190 per square foot in 2024 and has closed at $181 and then $178 since, leaving it about 6% below its 2023 level and the only one of the six below where it started.
Read carefully, because per-foot price is not the same thing as price. The smallest homes remain by a wide margin the cheapest homes in the market in absolute dollars, and this is not a claim that they became cheap. It is a claim about the direction of the per-foot figure, which is the one number that can be compared across sizes at all. It also has the thinnest sample of any band here, 1,158 closings in the 2026 window against 3,382 in the 2,000 to 2,600 band, so it moves more on noise than the others do.
The gap is back to where it sat before 2015
The cleanest way to state the divergence is as a ratio: the largest band divided by the mid-market band. It ran 1.38 in January to July 2026, against 1.17 in 2020, which is the narrowest reading in the entire 26-year record.
That 2020 reading is the anomaly, not the current one. Through 2001 to 2013 the ratio sat between 1.30 and 1.57 in every single year. It then compressed steadily from 2014 to 2020 as the middle of the market caught up, sat near its floor through the frenzy, and reopened to 1.41 in 2024. What has happened since 2023 is a return to the historical relationship rather than a new one.
It is worth pairing this with the fourth-bedroom finding from earlier this month, which showed that a four-bedroom home no longer carries a per-foot premium over a three-bedroom. Both are true and they are not in conflict. Bedroom count stopped being priced. Raw floor area, at the top of the size range, did not.
What this does not prove
Three limits, and the first is the one that matters.
First, price per square foot across size bands is not a controlled comparison and cannot be made into one from this data. A 3,800 square foot home and a 2,200 square foot home differ on far more than floor area: county, lot size, age, build type and finish level all move together with size. The claim here is that the per-foot figure diverged. The claim is not that floor area caused it.
Second, the composition of the largest band did drift, and in one direction worth naming. St. Johns County was 51.3% of that band in the 2023 window and 56.1% in 2026, a shift of about five points toward the highest-priced county in the region. That alone does not account for a $25 per square foot move, but it is real and it works in the same direction as the finding. Two other candidate explanations were checked and do not hold: the median size in the band went 3,814 to 3,873 square feet, and the new-construction share of the band actually fell, from 20.9% to 17.6%.
Third, every year here uses a fixed January to July window because July is the last complete close month in the current pull. The unfixed calendar-year version was also run and shows the same divergence, but the fixed window is what makes 2026 comparable to the other 25 years rather than a stub, and a partial-year comparison has produced a false trend on this desk before.
How agents can use this data
Four uses, all of them about homes and prices rather than about people.
Stop quoting one price per square foot for the region. The spread across size bands in the 2026 window is $178 to $285, and a single regional figure sits in the middle of a range that wide. Pull the per-foot comparison from homes in the same size band as the subject property, not from a market average.
Check the size band before you assume a per-foot comp is conservative. Comping a 3,600 square foot home against per-foot figures drawn from 2,200 square foot sales understates it by roughly 38% on this data. The same error runs the other way on a small home. This is the most common way a per-foot comp goes wrong, and it is arithmetic rather than judgement.
Use the three-year flat line when a seller anchors on 2023 or 2024. For any home between 1,200 and 3,400 square feet, the per-foot figure has moved less than two and a half points in three years, and it is below its 2024 peak in every one of those bands. That is a documented, dated market fact rather than an opinion about the seller's home, and it is a far easier conversation than a price argument. Our concessions work covers the other half of that picture, where the repricing shows up at the closing table rather than on the sticker.
Treat the largest band as its own market, and its 2024 step as history. Above 3,400 square feet the per-foot price is up about 10% since 2023, but it has been flat since 2024 and the band closes only about 840 sales in a seven-month window across seven counties. That is a thin, distinct market, and last year's figure is not a forecast of next year's.
Whenever you use any of this with a client, cite the source and the date: Momentum Research analysis of data provided by realMLS, January to July closings, 2001 to 2026, published August 27, 2026. A number without a source is an opinion with decimal points attached.
People also ask
What is the price per square foot in Jacksonville right now?
There is no single figure, and that is the finding. Across January to July 2026 closings in the seven realMLS counties, the median price per square foot for a single-family home was 178 dollars in the under 1,200 square foot band, 202 dollars from 1,200 to 1,600, 200 dollars from 1,600 to 2,000, 207 dollars from 2,000 to 2,600, 227 dollars from 2,600 to 3,400 and 285 dollars at 3,400 square feet and up. Quoting one number for the region averages six lanes that have not moved together for three years. Figures are per Momentum Research analysis of realMLS closed sales and are deemed reliable but not guaranteed.
Do bigger homes cost more per square foot in Northeast Florida?
In this market, yes, which is the opposite of the usual rule of thumb. The per-foot price rises with size at every step of the ladder, and the 3,400 square foot and up band has closed above every other band in all 26 years of the record. In January to July 2026 that band closed at a median 285 dollars per square foot against 207 dollars for a home of 2,000 to 2,600 square feet, a ratio of 1.38. This is not a controlled comparison, because the size bands also differ on county, age, lot and build type. Figures are per Momentum Research analysis of realMLS closed sales and are deemed reliable but not guaranteed.
Which Jacksonville home sizes have lost value since 2023?
Measured per square foot on a fixed January to July window, the under 1,200 square foot band is the only one below its 2023 level, at 178 dollars against 189, about 6% lower. The four middle bands are within 2.2 points of where they were, and the 3,400 square foot and up band is about 10% higher. Per-foot price is not the same as a home's value, and no band here is controlled against another. Figures are per Momentum Research analysis of realMLS closed sales and are deemed reliable but not guaranteed.
The takeaway
Northeast Florida did not reprice as one market over the last three years. Between 1,200 and 3,400 square feet, which is most of what changes hands here, the per-foot price is where it was in 2023. Above 3,400 square feet it stepped up once in 2024 and stayed there. Below 1,200 square feet it went the other way. Anyone quoting a single price per square foot for this region is averaging six lanes that stopped moving together three years ago.
For the wider picture on prices, inventory and market time across the region, see our Jacksonville housing market data.
Method and limits
Source: data provided by realMLS. Closed single-family residential sales in the authoritative counties of Duval, St. Johns, Clay, Nassau, Putnam, Baker and Bradford. Records are deduplicated on listing id plus close date. 277,310 closings across the fixed January to July window, 2001 through 2026.
Price per square foot is close price divided by living area. Records with a living area below 300 or above 15,000 square feet, or a close price below $10,000, are excluded. Size bands are under 1,200, 1,200 to 1,600, 1,600 to 2,000, 2,000 to 2,600, 2,600 to 3,400 and 3,400 and up square feet, and a band must carry 200 or more closings in a year to be plotted. The mid-market band used for the ratio is 2,000 to 2,600 square feet, which is the largest band by closing count in the current year.
Every year uses the same January to July window, chosen because July is the last complete close month in the current pull. Living area is entered by the listing agent rather than measured independently, and condominiums, townhouses and manufactured homes are excluded so that the comparison runs across one property type.
Three limits carried from above: the comparison across size bands is not controlled for county, age, lot or build type; the county mix of the largest band shifted about five points toward St. Johns across the window; and the smallest band has the thinnest sample of the six.
All figures on this page are per Momentum Research analysis of data provided by realMLS and are deemed reliable but not guaranteed. Equal Housing Opportunity.