
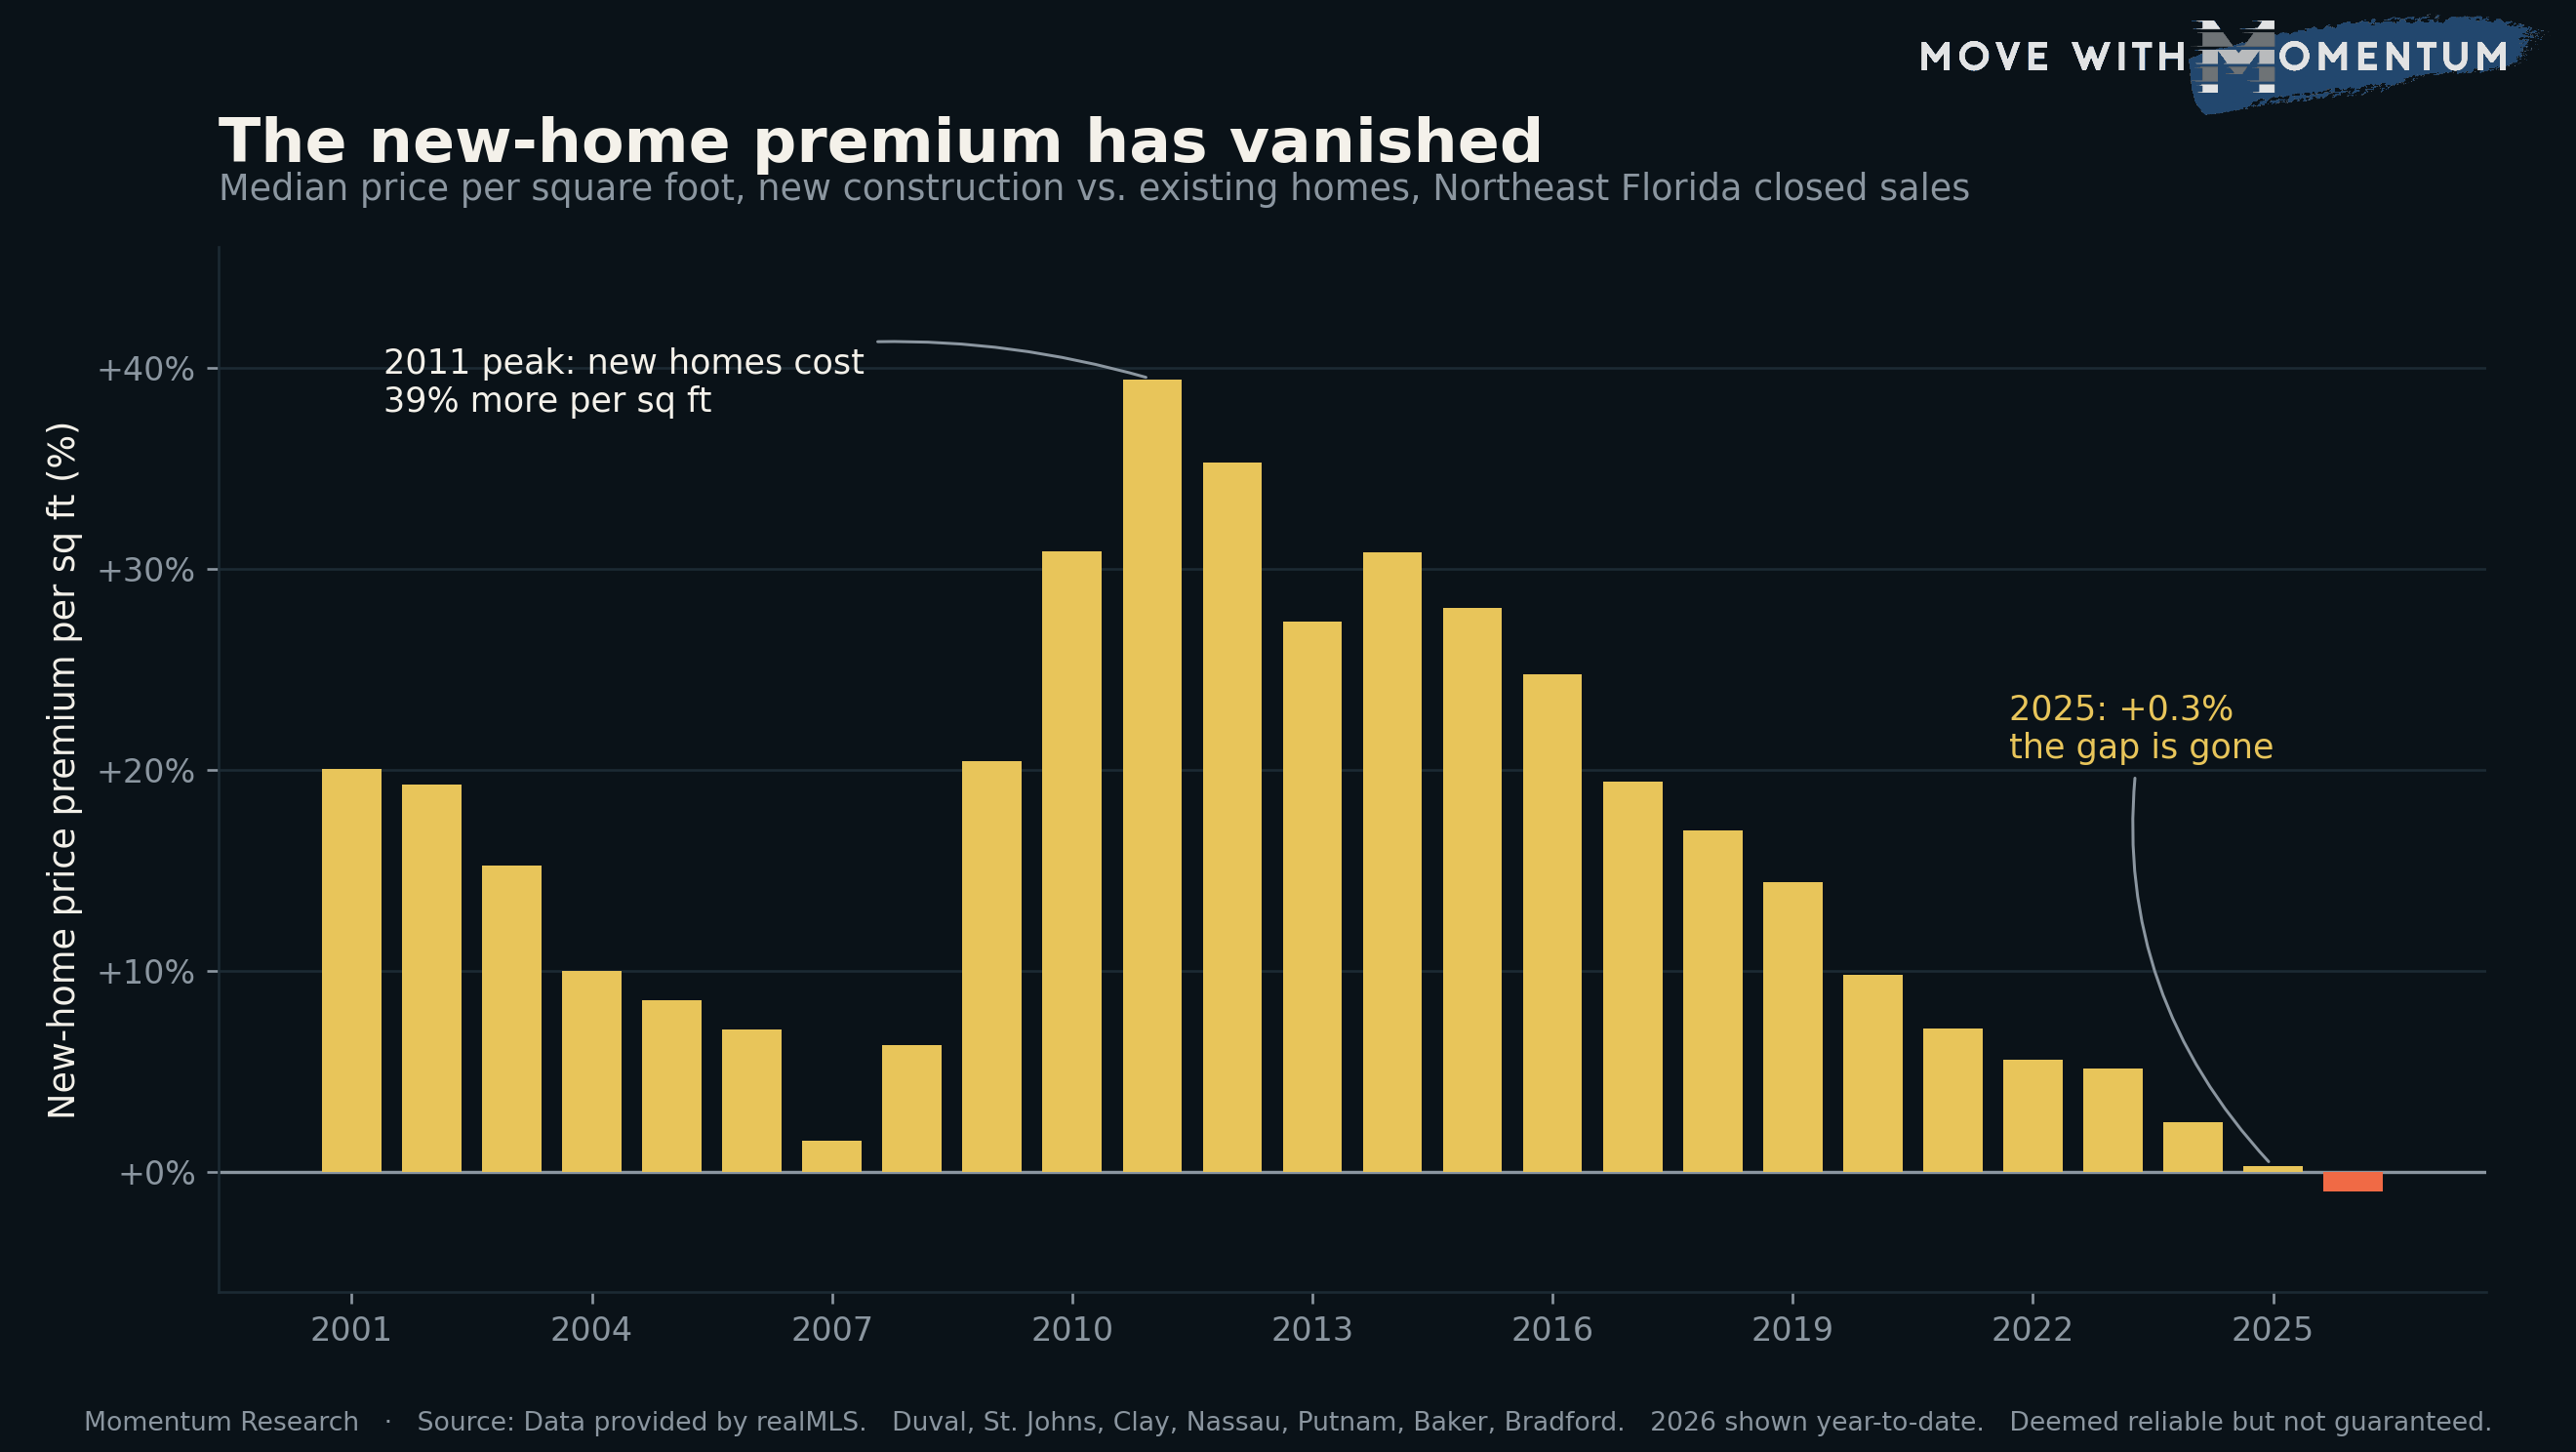
Ask most people whether a brand-new house costs more than a used one and they'll say yes without thinking about it. In Northeast Florida that stopped being true.
We pulled 25 years of closed sales from realMLS, every year back to 2001, and measured what new construction sold for against existing homes on a price-per-square-foot basis. Per foot matters here, because new homes are physically bigger, so a raw price comparison makes them look more expensive than they really are. Foot for foot is the honest way to line them up.
For most of that history, new carried a clear premium. In 2011 a new home sold for about 39% more per square foot than an existing one. Through the 2010s the gap ran in the 20s and 30s. Then it started sliding, and it kept sliding. In 2024 it was 2.4%. In 2025 it was 0.3%. So far in 2026 it's slightly negative, meaning a new home is now a hair cheaper per foot than a used one. That hasn't happened in the 25 years we can see.
Related coverage: Before you close on a new build, run Redfin’s new-construction walkthrough checklist (Momentum’s Jon Brooks is quoted on working the builder’s first-year warranty: a dated repair log, written requests, and a month-10 independent inspection).
Why the gap blew out after the crash, then faded
The premium is really a gauge of the used-home market, not the new one. A builder's price is anchored to hard costs. Land, materials, labor, and a margin. That moves slowly. A used home's price swings with demand, so when the resale market crashes the gap widens, and when resale booms it shrinks.
2011 was a crash reading. Foreclosures and short sales were still flooding the market, and they set the going rate for a used home. Existing price per foot fell about 46% from 2006 to 2011. New fell too, about 30%, but far less, because a builder doesn't foreclose on his own subdivision and dump it at a discount. When demand dried up, builders just stopped building, and new construction fell to about 13% of sales, a 20-year low. So the ratio of new to used blew out to 39%, even though new homes were losing value the whole time. That premium was the size of the foreclosure discount wearing a different label.
Then it faded in two stages. The first half of the decline, roughly 2011 to 2016, was those foreclosures clearing. As the distressed inventory got absorbed, used prices recovered and closed most of the gap. The second half, from about 2018 on, had nothing to do with foreclosures, which were long gone by then. That was the pandemic boom lifting resale prices fast, and then builders letting new prices soften while resale stayed frozen.
Why builders now sell one in four homes
Rates spiked in 2022 and settled near 6.5%. If you're sitting on a 3% mortgage, moving means trading it for a 6.5% one, so a lot of owners just didn't. Resale sales fell from about 33,500 in 2021 to about 20,200 in 2024, a 40% drop. That's the frozen market everyone talks about.
Builders don't have that problem. They're always making new supply, and they can make the payment work with incentives, so buyers who couldn't find or afford a resale went to the builder instead. New-home sales actually rose about 44% over the same stretch. Put those together and new construction went from 13% of sales in 2021 to 27% in 2024. The share doubled mostly because the used-home market shrank, not because builders exploded. Their slice of a smaller pie got bigger.
What the sticker price hides
One caution about the chart. Price per foot only counts the recorded sale price. It misses the incentives builders pile on, rate buydowns and paying a buyer's closing costs, which can run up to about 10% of the deal and do not lower the price on the contract. The home still closes at, say, $400,000. The builder just spends thousands on the side to make the payment cheaper.
Builders prefer it that way, because a lower recorded price would drag down the comps for the whole neighborhood. So the sticker prices in our data are holding higher than what buyers actually pay. Count the incentives and new construction is effectively the cheaper option today. The chart says the premium hit zero. Net of what buyers really pay, it went negative. A used home down the street rarely comes with a builder-sized buydown attached.
How solid this is
The trend survives the obvious objections. New homes go up on cheaper land at the edge of town, so you would expect them to look cheaper per foot for that reason alone. But compare a new home and a used one in the same ZIP code, holding location roughly still, and the premium still falls from about 33% in 2011 to low single digits today. It also holds single-family house to single-family house, so it isn't just the shift toward townhomes on tiny lots. And because the figure is per square foot, it already accounts for new homes being smaller. If anything that cuts against the finding, since smaller homes usually cost more per foot, not less.
New homes did get smaller. The median new home shrank from about 2,100 square feet in the early 2000s to about 1,880 today, while existing homes held near 1,700, and lots got tighter along the way. Strip all of that out and the gap is still gone.
What it means for you
If you're buying, drop the assumption that new is automatically the expensive option. With a builder rate buydown or closing-cost help, a comparable new home can land at or below a resale down the street. Run the payment both ways before you rule anything out.
If you're selling a used home, your competition changed. You're now up against brand-new inventory at nearly the same price per foot, and the builder can offer incentives you can't. Price to that, not to what resale used to command over new.
If you're an agent, the old "new construction carries a premium" line is out of date. Put the per-foot math and the builder's incentive stack next to each other and let a buyer see it. It changes the whole new-versus-resale conversation.
None of this is a forecast. It's what the closed-sale record actually shows, straight through the biggest rate shock in 40 years. If rates fall and owners start listing again, the resale market thaws and this gap could reopen. For now, in Northeast Florida, new and used cost about the same per foot, and that's new.
These numbers come from Momentum Research, computed from realMLS closed residential sales across Duval, St. Johns, Clay, Nassau, Putnam, Baker, and Bradford counties, 2001 through July 10, 2026. Want the monthly market read with the full county breakdown? It's free at movewithmomentum.com.
- Momentum Research, the research desk at Momentum Realty / jon@movewithmomentum.com
This article summarizes Momentum Research analysis of realMLS closed-sale data and includes our interpretation of it. It is for general informational purposes only and is not financial, investment, legal, or tax advice. Regional statistics are never a price for any specific home. Consult a licensed professional about your situation.