
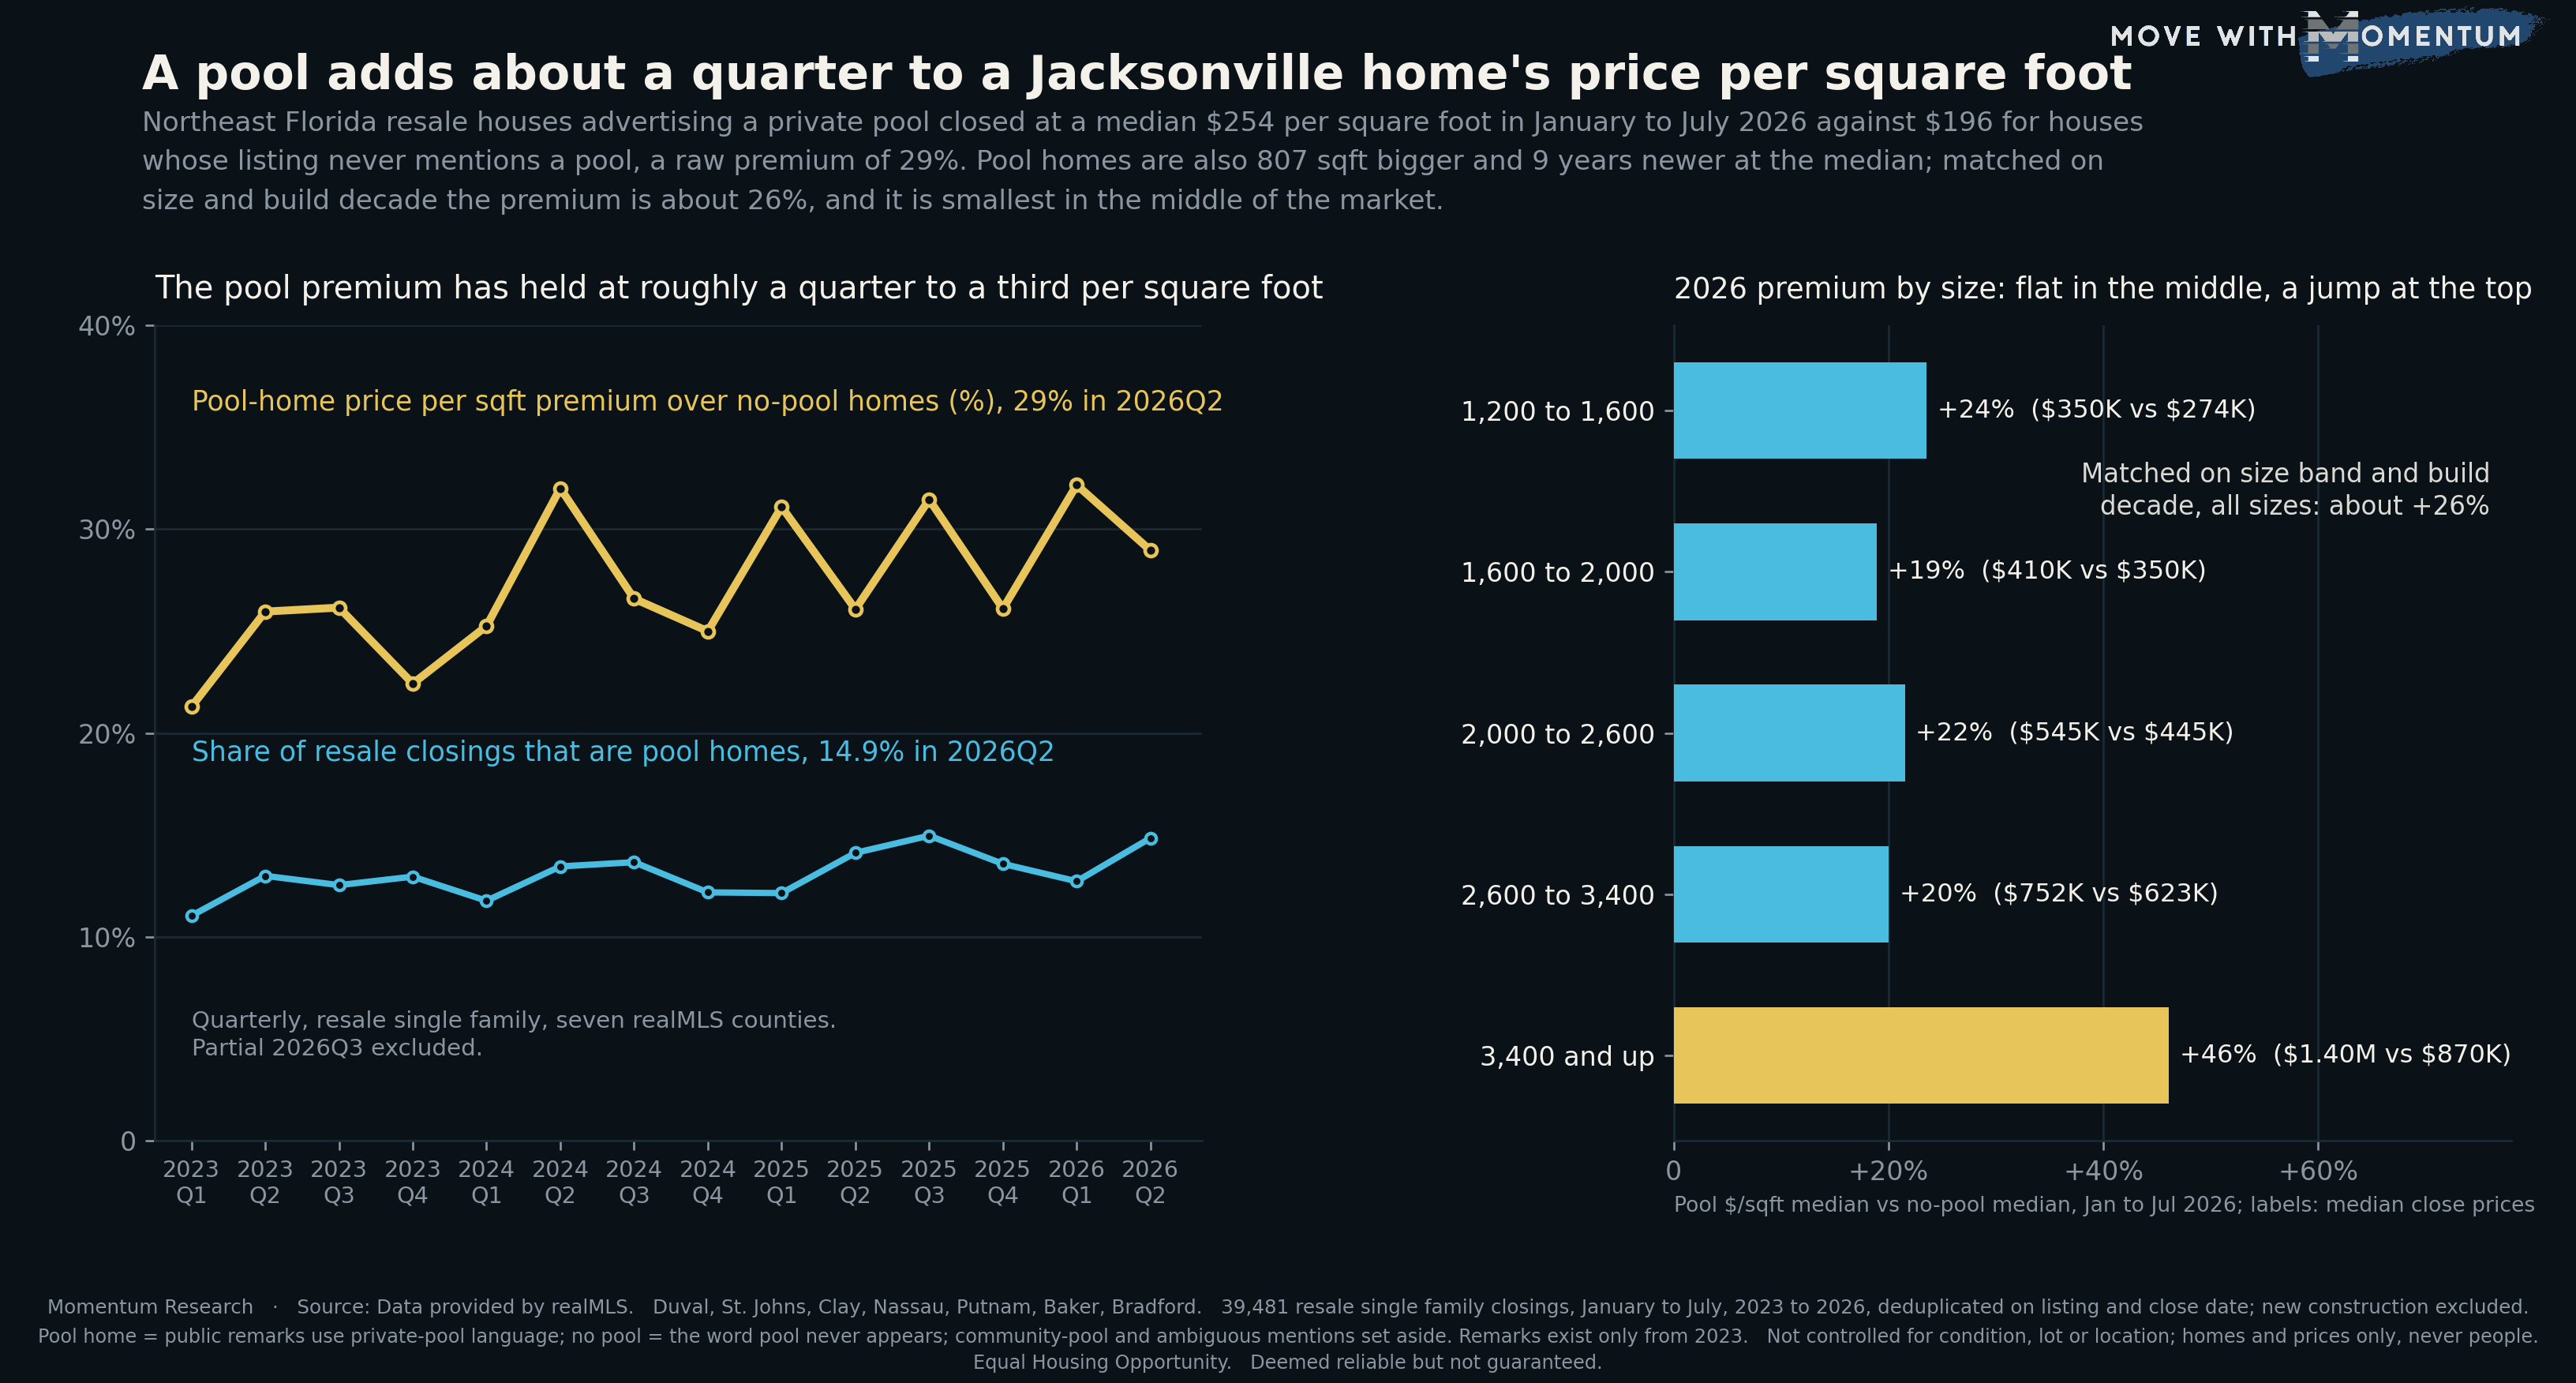
Ask what a pool is worth in Jacksonville and you will get a contractor's number (what it costs to build) or an appraiser's number (what it adds on a form). This is the market's number: what homes that were sold WITH a private pool actually closed for, per square foot, against homes sold without one, across every resale single family closing in the seven realMLS counties since the start of 2023. The short answer is about 29% more per square foot, or about 26% once you compare homes of the same size and age. The longer answer is that the premium is flat across most of the market and roughly doubles at the top, where a pool stops being a feature and becomes a marker of a different kind of house.
A note on method before the numbers, because this one depends on it. The MLS archive we work from does not carry a pool field, so the pool is read from the listing's own public remarks. A closing counts as a pool home when the remarks use unambiguous private-pool language: "pool home", "private pool", "screened pool", "saltwater pool", "heated pool", "in-ground pool", "pool and spa", "pool enclosure", "pool was resurfaced" and the like. A closing counts as no pool when the word pool never appears at all. Everything in between, community pools, "room for a pool", "pool bath", about 18% of closings, is set aside rather than guessed. Public remarks only exist in this archive from 2023, so the series is four years long, and every year uses January through July so a partial 2026 is compared with the same seven months of each earlier year.
$254 against $196: the raw premium
In January to July 2026 there were 9,949 resale single family closings in the seven counties. 1,420 of them (14.3%) advertised a private pool and 6,686 (67.2%) never mentioned one. The pool homes closed at a median $254 per square foot. The no-pool homes closed at $196. That is a raw premium of 29.3%, and it has been in the same neighborhood every year: 24.4% in 2023, 28.1% in 2024, 28.9% in 2025.
Quarter by quarter, the premium has run between 21.3% (the first quarter of 2023) and 32.2% (the first quarter of 2026), and it read 28.9% in the second quarter of 2026. There is a mild upward drift across the fourteen quarters and a fair amount of quarter-to-quarter noise; we would not lean on the drift with four years of data. What the chart supports is simpler: the premium is large, it is stable, and it has not narrowed as the broader market cooled.
Most of the dollar gap is the house, not the pool
In dollars, the median 2026 pool home closed at $645,000 and the median no-pool home at $338,650, a gap of more than $300,000. Nobody should read that as the value of a pool. The pool home is a different house: a median 2,511 square feet against 1,704, so about 800 square feet larger, and built in 2000 against 1991, so about nine years newer. Bigger, newer homes sell for more per square foot on their own, which is why the raw per-foot premium overstates the pool.
To take that out, we split the closings into living-area bands and build decades, compared pool homes to no-pool homes only inside the same cell (a 2,000 to 2,600 square foot house built in the 1990s against another 2,000 to 2,600 square foot house built in the 1990s), and weighted the cells by the number of pool homes in each. On that matched basis the 2026 premium is 26.1%, against 23.4% in 2023, 26.7% in 2024 and 23.4% in 2025. So size and age explain about three points of the raw 29%. The rest survives the match.
Flat in the middle, a jump at the top
The right panel of the chart is the same 2026 closings split by living area. The premium reads:
- 1,200 to 1,600 square feet: +23.6% (136 pool homes; median close $350,000 vs $274,000)
- 1,600 to 2,000: +18.9% (222; $410,000 vs $349,900)
- 2,000 to 2,600: +21.5% (391; $545,000 vs $445,000)
- 2,600 to 3,400: +20.0% (386; $752,500 vs $622,750)
- 3,400 and up: +46.1% (277; $1,400,000 vs $870,000)
Four of the five bands sit between 19% and 24%. The largest band roughly doubles that. The pool share tells you why: it is 6.3% of closings at 1,200 to 1,600 square feet, 16.6% at 2,000 to 2,600, 28.6% at 2,600 to 3,400 and 39.9% at 3,400 square feet and up, where a pool home outnumbers a no-pool home among the closings that can be classified. Above that size the pool is not a $60,000 feature added to an ordinary house; it is one of several things (lot, finish, location, waterfront) that travel together on an estate-type property, and the 46% is the price of the package. Under 1,200 square feet there were only eight pool homes, too few to chart.
The dollar gaps in the middle of the market are worth a look on their own. At 1,600 to 2,000 square feet the median pool home closed about $60,000 above the median no-pool home. At 2,000 to 2,600 it was about $100,000, at 2,600 to 3,400 about $130,000. Those are market price differences between two groups of homes that also differ in ways the data cannot see, so they are not a return on a pool contractor's invoice, but they are the right order of magnitude for a seller to have in mind when the question comes up.
The rivals we tested
Waterfront. Pool homes are twice as likely to carry waterfront language in the remarks (16.6% against 8.1%), and we showed in August that the waterfront label alone carries a 10% to 141% premium. Dropping every listing with waterfront language from both groups leaves the 2026 premium at 26.0%. Waterfront is riding along, but it is not the pool premium.
County mix. Inside Duval alone the raw premium is 28.6% with a pool share of 10.8%. St. Johns 20.0% with a share of 21.8%. Clay 14.3% and 15.6%. Nassau 32.9% and 14.9%. The premium is positive in every county, and it is larger where pool homes are scarcer, which is roughly what you would expect if part of what buyers pay for is not having to build one. The county-level matched cells are too thin to publish and we have not.
Build decade. On 1960s through 1990s stock the premium runs 14% to 19%. On 2000s, 2010s and 2020s stock it runs 34% to 38%. That lines up with the size finding, since the newest pool homes skew large, and it is the reason the matched calculation controls for decade as well as size.
Wordier remarks. Pool-home remarks are longer (a median 997 characters against 875), so a longer listing has more chances to trip the pattern. That is why the control group is defined by the total absence of the word, not by a pattern that failed to match. A pool that a listing agent never mentioned would sit in the no-pool group, which would understate the premium, not inflate it. Remarks are present on 98.7% of 2023 closings and 100% from 2025 on, with no ramp from zero.
Partial year. Every year uses the fixed January to July window. The full-calendar view of 2023 to 2025 reads 24.5%, 28.2% and 28.4% raw and 21.5%, 24.9% and 22.4% matched, the same picture. The quarterly series drops the partial third quarter of 2026.
New construction. Excluded throughout. Only 1.3% of the 2,759 builder closings in the first seven months of 2026 advertised a pool, so nearly every pool home that sells in this region is a resale, and mixing the two would have compared pool resales with pool-free new homes.
What the data cannot tell you
This is a comparison of two groups of homes and nothing more. It is not the return on installing a pool, it is not controlled for lot, condition, finish or location within a county, and pool homes differ from no-pool homes on all of those. The classifier reads marketing language; a hand check of 30 matched listings found 28 true private pools, one amenity-center pool and one "pool bath", after which the pool-bath pattern was removed. The series is four years long because that is how long the remarks field has existed in this archive. Nothing on this page describes any person or household; it describes homes and the prices attached to them.
How agents can use this data
Four uses, all about pricing property, none about anyone's choice of where to live:
- Stop pricing a pool with a flat dollar adjustment. The market difference scales with the home. A 1,600 to 2,000 square foot pool home closed about $60,000 above its no-pool counterpart in 2026; a 2,600 to 3,400 square foot one closed about $130,000 above. A single "pools add $40,000" rule is wrong at both ends.
- Pull pool comps by size band first. The premium is roughly 19% to 24% per foot from 1,200 to 3,400 square feet and 46% above that. A 3,800 square foot pool home compared with 2,200 square foot pool homes will look overpriced when it is not, and the reverse.
- Separate the pool from the waterfront in a CMA. One pool home in six also carries a waterfront label, and the two premiums stack. If the subject has one and the comps have both, the comps are running rich.
- Use the scarcity reading in Duval and Nassau. Pool homes are 11% of Duval resale closings and carry a 29% premium there; in St. Johns they are 22% of closings at 20%. Where the pool is rarer the market has paid more for it, which is useful context when a seller asks whether the pool will matter to the price.
If you use any of these figures with a client, cite the source and the date: Momentum Research analysis of data provided by realMLS, January to July 2026. Market data moves, and a number without a date attached invites an argument you do not need to have.
What this measurement does not do
This is a per-square-foot comparison of MLS-recorded resale single family closings sorted by the pool language in their own listings. It is not a controlled test and it does not identify a cause. It only sees homes sold through the MLS. Related work on the same archive looks at how price per square foot splits by home size, which is the composition effect this piece had to control for, and at how price per foot varies by build decade.
People also ask
How much more do pool homes sell for in Jacksonville?
In January to July 2026, resale single family homes in the seven realMLS counties whose listing advertised a private pool closed at a median $254 per square foot, against $196 for homes whose listing never mentioned a pool, a premium of about 29%. Pool homes are also bigger and newer, and after matching on living-area band and build decade the premium is about 26%. In dollars, the median pool home closed at $645,000 against $338,650, but most of that gap is the larger, newer house the pool sits behind.
Does a pool add value to a house in Jacksonville?
Homes sold with a private pool commanded more per square foot than homes without one in every size band, every county and every build decade we measured in 2026, and the premium has held between 21% and 32% in every quarter since the start of 2023. That is a market price difference, not the return on installing a pool: the data does not see what the pool cost, the condition of the home, the lot or the finish level, and pool homes differ from no-pool homes on all of those.
What share of Jacksonville homes have a pool?
Among resale single family closings in Northeast Florida in January to July 2026, 14.3% carried unambiguous private-pool language in the listing, up from 12.2% in the same months of 2023. The share rises steeply with home size: about 6% of closings at 1,200 to 1,600 square feet, 17% at 2,000 to 2,600, 29% at 2,600 to 3,400 and 40% at 3,400 square feet and up. Only 1.3% of new construction closings in 2026 advertised a pool, so nearly all pool homes sold in the region are resale.
Method and limits
Source: data provided by realMLS. Closed resale single family sales in the authoritative counties of Duval, St. Johns, Clay, Nassau, Putnam, Baker and Bradford. Records are deduplicated on listing id plus close date. Closings under $10,000, living area under 400 square feet and listings flagged NewConstructionYN are excluded. 39,481 closings remain across the fixed January to July window, 2023 through 2026: 5,259 pool homes, 27,275 no-pool homes and 6,947 set aside as ambiguous.
Pool home means the PublicRemarks field matches a private-pool pattern (a qualifier such as private, screened, screen-enclosed, in-ground, saltwater, heated, solar-heated, caged, gunite, backyard, resurfaced or refinished immediately before "pool"; or "pool home"; or "pool and spa" and its variants; or "pool enclosure", "pool cage", "pool deck", "pool pump", "pool heater", "pool equipment" and similar; or "lanai with pool"). No pool means the word pool does not appear anywhere in the remarks. Any other mention of a pool is ambiguous and excluded from both groups. Price per square foot is close price divided by LivingArea; every figure is a median.
The matched premium splits closings into six living-area bands and ten-year build decades, computes the pool-over-no-pool median premium inside each cell that has at least 30 closings on each side, and weights the cells by their pool-home count. 992 of the 1,420 2026 pool homes fall in a qualifying cell. Waterfront language means the remarks contain waterfront, oceanfront, riverfront, lakefront, intracoastal, navigable, dock, boat lift, marsh front or canal front.
PublicRemarks is populated from 2023 in this archive and absent before, which is a field artifact and not a change in the market; the series therefore starts in 2023. Nothing is controlled for condition, lot, finish or location within a county. Every year uses the same January to July window because 2026 is a partial year; the full-calendar view of 2023 to 2025 reaches the same result.
Related reading on the same archive: how far below the original asking price Jacksonville homes really sell and the ongoing Jacksonville housing market tracker.
All figures on this page are per Momentum Research analysis of data provided by realMLS and are deemed reliable but not guaranteed. Equal Housing Opportunity.