Townhouse in Watersong At Rivertown, St. Johns · Built 2026
Watersong At Rivertown · St. Johns, FL 32259
Listing data updated October 22, 2026 at 2:34 PM ET · checked against the MLS hourly
Listed by MATTAMY REAL ESTATE SERVICES (MLS) · Page maintained by Momentum Realty (EAB RE Investments LLC) · Brittany Brooks, broker of record
2Bedrooms
2Bathrooms
1,731Sq Ft
2026Year Built
$242Per Sq Ft
Waterfront2-car garageNew constructionFEMA Zone X
How to read this page: MLS listing facts carry their source; everything else is labelled as a public record, a calculation, an estimate, or something to verify. Where local data is too thin to support a number, the page says so instead of guessing.
6% below
$/sq ft vs community
$242 here vs $257 median sold (12 mo)
Buyer leverage
Buyer advantage
29 days on market
25.0 months
Supply around this home
Seller <3 · balanced 3-6 · buyer >6
Zone X
Flood risk
Minimal hazard per FEMA; ~22 ft elevation
$1k–$2k/yr
Est. insurance · illustrative
Not a carrier quote; premiums vary widely by property. Get a real quote.
57 FOXFORD Place in Watersong At Rivertown, St. Johns is listed at $419,000 (1,731 sq ft, about $242 per sq ft). That sits within a few percent of Watersong At Rivertown's median closed sale of $480,000 over the last 12 months (119 recorded sales). It has been listed Sep 23, 2026, well inside the community's typical 106 days. Listing facts: new construction, waterfront, HOA dues of $415/mo, a CDD assessment of about $1,900/yr. The parcel maps to FEMA flood zone X, outside the special flood hazard area. Figures are from the MLS record and county data; deemed reliable but not guaranteed.
CDD assessment ~$1,900/yr
New construction — built 2026
1,731 sq ft of living area
2-car garage
Listed at $419,000 — recent neighborhood median sale price ~$480,000 (nearby sales; deemed reliable, not an appraisal)
listed Sep 23, 2026
HOA $415/mo (per listing)
School district: St. Johns County SchoolCommunity built 2020–2026Weedman's Grocery · 4 min driveWoodpeckers Backyard BBQ · 4 min driveHarbor 210 Village · 6 min drive
Listing description
About this home
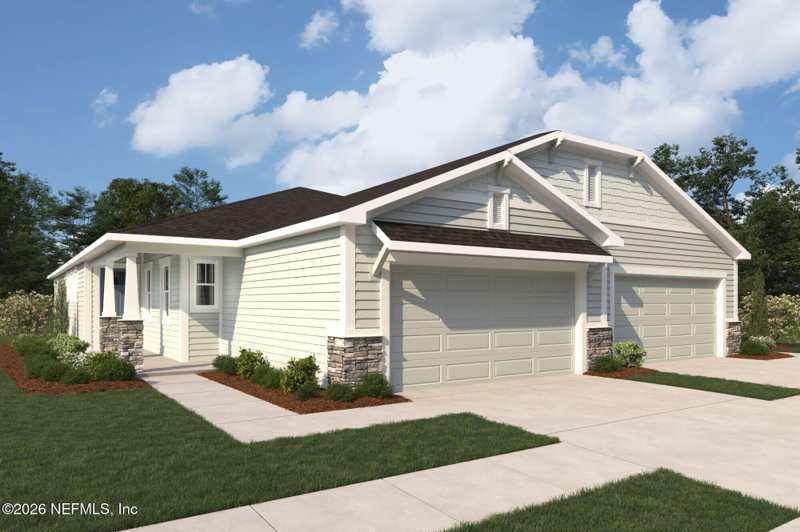
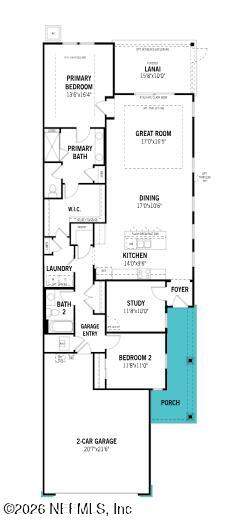
LOT 2 - The Hammock welcomes you with an open flow from foyer to kitchen, where the island overlooks the Great Room and dining area. Sun-filled windows brighten the space and lead seamlessly to the covered lanai--perfect for relaxing or hosting. The primary suite connects to the Great Room and sits just steps from the lanai for peaceful mornings.
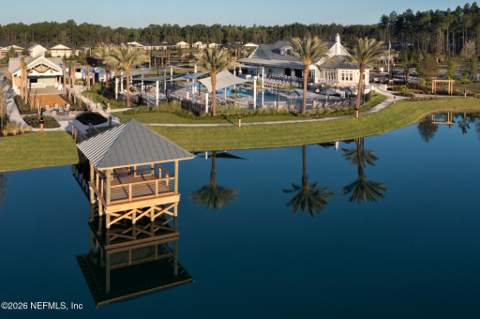
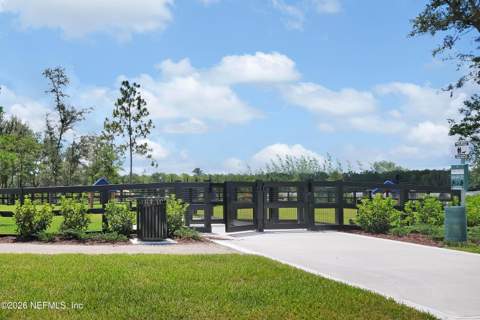
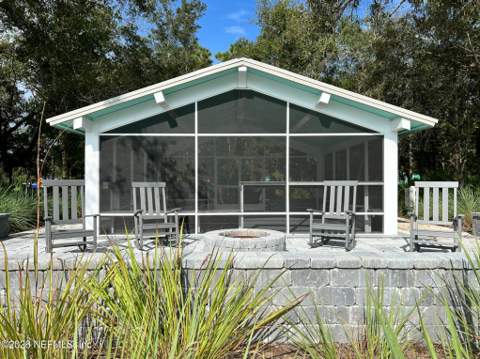
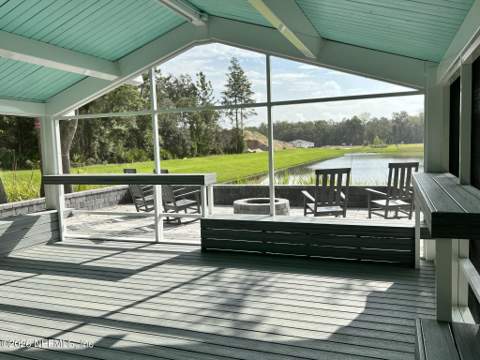
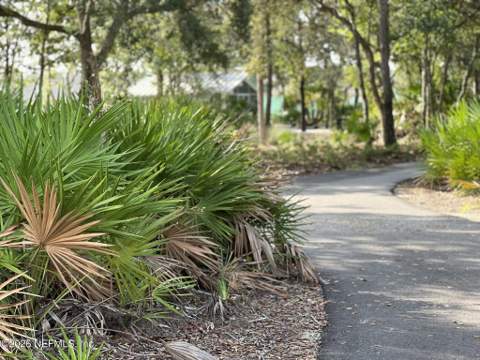
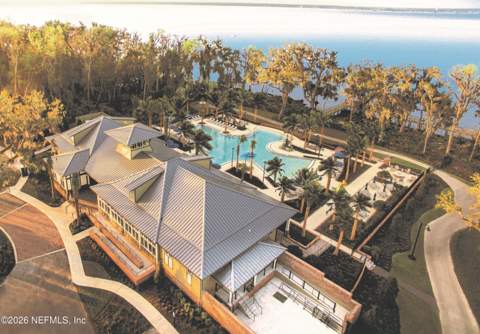
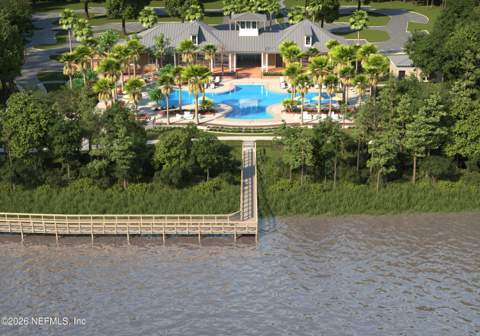
A second bedroom sits near the study, offering flexibility for a guest room, home office, or hobby space. WATERSONG, an exclusive gated 55+ neighborhood in RiverTown, surrounds residents with parks, lakes, preserves, miles of trails, and an unspoiled St. Johns River setting.
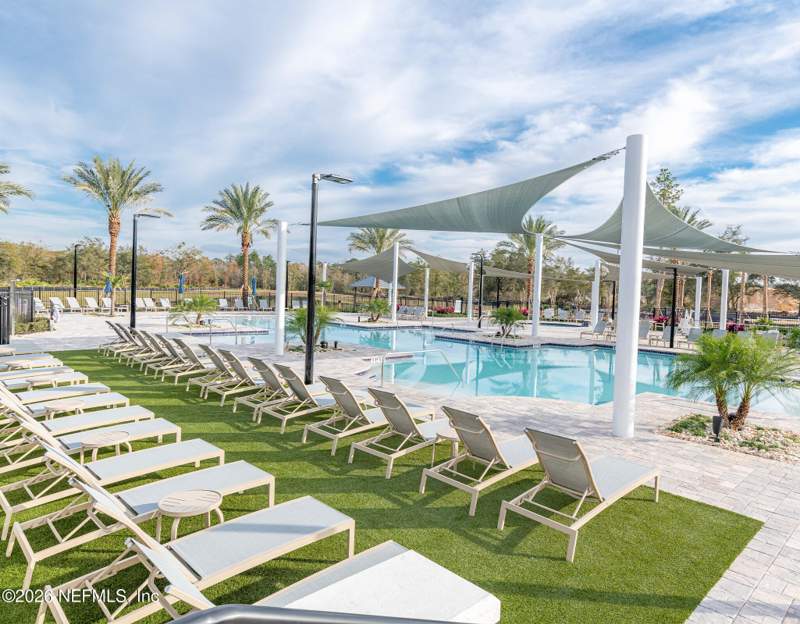
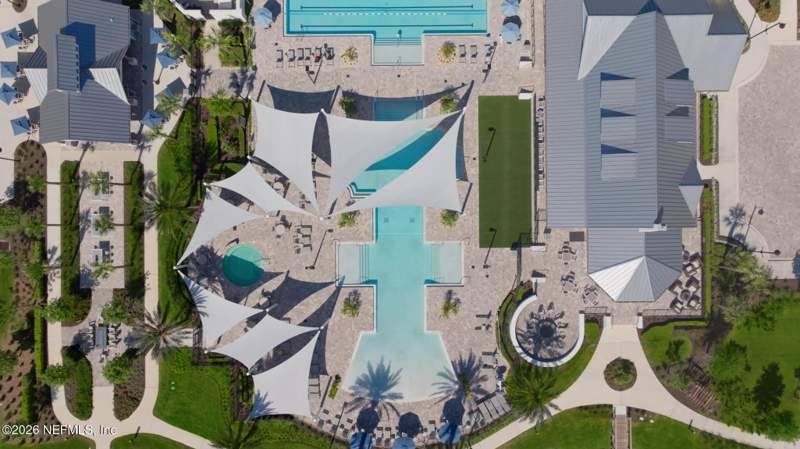
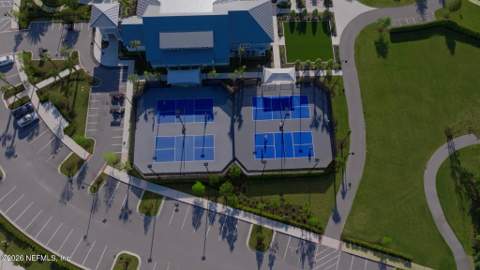
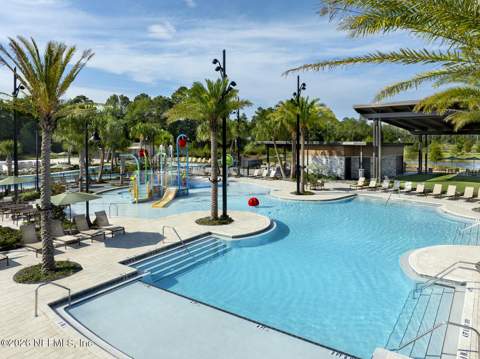
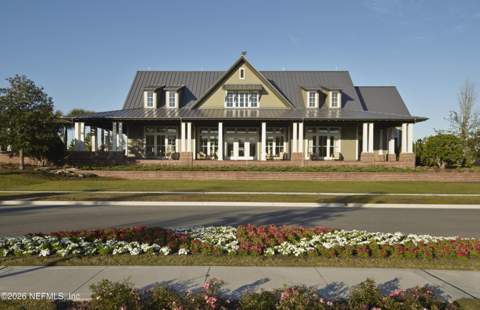
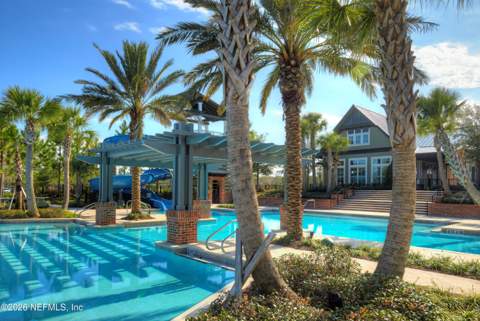
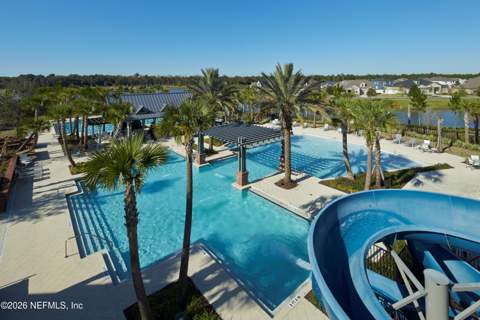
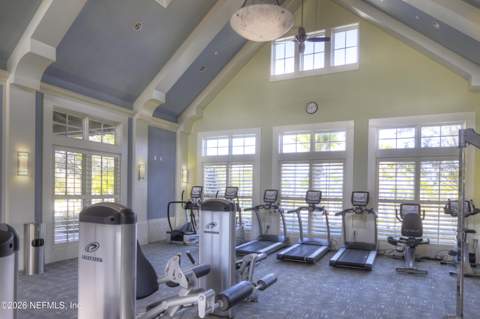
Resort-style amenities and activities--from food truck Fridays to fitness classes--make every day engaging.
All 33 photos
Description provided by MATTAMY REAL ESTATE SERVICES and reproduced from the MLS; not independently verified.
Listing data, public records, our calculations, and what to verify — each fact shown once. Estimates and calculations shown are for general information only, are not appraisals or advice, and should be independently verified.
Listing facts MLS
List price$419,000
Bed / bath2 / 2
Living area1,731 sq ft
Year built2026
Property typeTownhouse
Garage2-car
MLS #2154155
Listing statusPending
Public records & third-party data
FEMA flood zoneZone X
Ground elevation~22 ft
CountySt. Johns
Area listings25 active · 18 under contract
Estimated first-year tax~$3,603/yr
CDD assessment~$1,900/yr
HOA$415/mo
Calculated estimates
Price per sq ft$242
Estimated monthly payment$3,304
Insurance (illustrative)$1k–$2k/yr
Messtimate range$346,200 – $351,393
Comparable-sales median$480,000
Buyer should verify Buyer verify
Exact HOA dues, fees, and restrictionsRoof age and conditionHVAC age and conditionA property-specific insurance quoteSurvey and lot boundariesPermit historyFlood-insurance requirementsSchool zoning (confirm with the district)Property taxes after sale (homestead reset)CDD / community assessmentsSquare footage and room dimensions
Financing
Estimated monthly payment
$3,304/mo
Principal & interest $2,321/mo70%
Taxes $300/mo9%
Insurance $110/mo3%
HOA $415/mo13%
CDD $158/mo5%
$3,304/mo at 20% down, 30-yr @ 7.4% · edit any field to update.
The parts of the monthly number a mortgage calculator leaves out, from this listing's MLS record, the county tax roll, Citizens and FEMA. Property facts only.
Property tax
Buy at the asking price of $419,000 and the first-year bill resets to about $5,125/yr (St. Johns County total millage 13.4686 with homestead, FY2025-26); Save Our Homes caps later increases at 3%/yr.
CDD / special assessments
About $1,900/yr, the figure on file for this community; the listing record does not state its own.
HOA dues
$415/month per the listing record. Dues cover what the association documents say they cover; ask for the budget and reserve study before you close.
Home and flood insurance
The average Citizens Property Insurance premium in Saint Johns County is $1,378/yr (977 policies, Citizens detail by county, April 2026); private-market quotes differ by roof age, wind mitigation and distance to the coast. The page's modeled range for this home is $1,000–$2,000/yr; neither is a quote. Flood: this address maps to FEMA zone X, outside the high-risk zone; flood insurance is optional but most lenders and insurers recommend it. Statewide, a zone X flood policy runs about $500–$700/yr (FEMA Risk Rating 2.0 averages, not a quote).
Roof and age
Built in 2026. A newer roof and current wind-mitigation features usually mean the lower end of insurance quotes; ask for the wind-mitigation form.
Estimated carrying cost at the asking price, before the mortgage: about $1,115/month (tax $427, CDD $158, HOA $415, insurance $115). An estimate from the sources above, not a quote; the monthly-cost calculator on this page adds the loan.
Estimated ownership costs
Estimated costs & disclosures
Estimated ownership costs for general information. Confirm each with the county, your lender, and an insurer. See data & estimate notes.
Property tax (first-year est.)
~$3,603/yr
Estimate: a typical St. Johns effective rate applied to the list price before any exemptions. Florida bills change with reassessment, homestead and other exemptions, and local taxing districts — this is not your expected bill. Confirm with the county property appraiser.
CDD assessment
~$1,900/yr
A Community Development District bond funds roads & amenities; it appears on your tax bill and is not optional.
Insurance (illustrative range)
$1k–$2k/yr
An illustrative modeled range, not based on carrier underwriting and not a quote. Florida premiums vary significantly by roof age, wind-mitigation features, claims history, and carrier — a real quote can land well outside this range. Flood insurance not federally mandated (Zone X). Get a quote from a licensed insurer before relying on any figure.
HOA
$415/mo
Per the MLS listing. Confirm exact dues and what they include with the association.
Environmental data
Flood zone & elevation
Sourced environmental data for the parcel. Confirm with FEMA and your insurer.
FEMA flood zone
Zone X
From the FEMA National Flood Hazard Layer. In this zone lender-required flood insurance is generally not mandated; confirm for the parcel.
Ground elevation
~22 ft
Approximate parcel elevation from USGS; confirm exact elevation with a survey.
Windstorm / insurance
Obtain a quote
St. Johns County is on the Florida coast; wind coverage is a major part of the premium. Premiums and coverage vary by home (roof age, wind mitigation, claims history); obtain a quote from a licensed insurer.
Hazard risk
Natural hazard risk
FEMA National Risk Index for St. Johns County, FL: overall Relatively Moderate. Ratings compare this county with every county in the United States for expected annual loss from each hazard.
HurricaneRelatively High
Coastal floodingRelatively High
Inland floodingRelatively Moderate
Heat waveRelatively Moderate
WildfireRelatively Moderate
TornadoRelatively Moderate
LightningRelatively High
Strong windRelatively Low
DroughtRelatively Low
HailVery Low
Cold waveVery Low
Source: FEMA National Risk Index (county level, hazard risk ratings only). Ratings describe the county, not this parcel; the flood zone shown above is parcel-specific. Verify insurance requirements with your lender and agent.
Connectivity
Internet & broadband
Fiber
Check availability
Address-level fiber service is not confirmed for this home. Check the FCC National Broadband Map (broadbandmap.fcc.gov) or the provider for this address.
Cable
Check availability
Cable broadband is common in Florida and Georgia towns but not confirmed for this address; verify with the provider.
Fixed wireless / satellite
Check availability
5G home internet and satellite service depend on the exact location; check coverage for this address.
Momentum Research · Watersong At Rivertown
Pricing & the Watersong At Rivertown market
How this home is priced against recent nearby sales, and where Watersong At Rivertown has been over 25 years. Momentum Research analysis of realMLS records; closed sales, deemed reliable but not guaranteed. Estimates only; see data notes.
This home’s $/sq ft vs. nearby sales
List $/sq ft against recent nearby closed sales; the community median is marked.
Price vs. size in Watersong At Rivertown
Each dot is a closed sale since 2020 (407 total). This home is the gold marker.
Sale price (y) by living area in sq ft (x). realMLS closed sales.
Median $/sq ft by year
Community sold $/sq ft, 2020–2026. This home lists at $242/sq ft.
Median sale price by year
12-month median closed price, 2020–2026.
Market Heat by year (0–100)
Momentum Market Heat, 2021–2026. Now 39 (cold).
Property timeline
This home’s history
2026BuiltPer public record
Jul 10, 2026First seen on movewithmomentum.comObserved at $423,990
Aug 4, 2026Price cut$419,000 (-$4,990, -1.2%)
NowUnder contractCurrently pending
Build year is from public record. The MLS list date is approximate (today minus the cumulative days on market the MLS reports, which can span relistings). Other milestones reflect movewithmomentum.com’s own observations since we began tracking this listing and are not the MLS listing history; dates and prices are deemed reliable but not guaranteed.
Transparency
Price & listing history
Listed for $419,000Momentum Realty · listed Sep 23, 2026
Public records
Building permits
Permit history not yet linkedConfirm permit history with the county building department.
How it stacks up
Comparable recent sales
6 closed sales within about 3 miles in the last 18 months — same property type, living area within 30% of this home. Sold prices are MLS closed-sale records, deemed reliable but not guaranteed.
Sold Aug 2026
$363,000
174 YELLOWSTONE Drive, St. Augustine
3 / 2.5 bd/ba · 1,813 sq ft · $200/sq ft
· View details →
Sold May 2026
$369,990
170 YELLOWSTONE Drive, St. Augustine
3 / 2.5 bd/ba · 1,813 sq ft · $204/sq ft
· View details →
Sold Jul 2026
$359,990
190 YELLOWSTONE Drive, St. Augustine
3 / 2.5 bd/ba · 1,813 sq ft · $199/sq ft
· View details →
Sold May 2026
$364,990
162 YELLOWSTONE Drive, St. Augustine
3 / 2.5 bd/ba · 1,813 sq ft · $201/sq ft
· View details →
Sold May 2026
$367,990
225 YELLOWSTONE Drive, St. Augustine
3 / 2.5 bd/ba · 1,813 sq ft · $203/sq ft
· View details →
Sold Jun 2026
$365,990
201 YELLOWSTONE Drive, St. Augustine
3 / 2.5 bd/ba · 1,813 sq ft · $202/sq ft
· View details →
Median of these 6 sales: $480,000 ($257/sq ft). Stronger local evidence. Shown for general reference only — not an appraisal or a statement of this home’s value.
The Messtimate™ · automated estimate
The Messtimate
Our automated estimate of the likely sale-price range for this home — modeled from recent closed sales nearby adjusted to today's market, a local size-and-age model, and the county tax roll. It is an estimate, not an appraisal, not market value, and not an offer. A licensed agent's CMA sees the condition, the lot, and the live market that a model can't.
$337,800the mess$373,400
Directional estimate — built from 9 comparable closed sales within about 3 miles (same property type, closed within the last 18 months, each adjusted to today's market).
Track record: across 2,982 recent closed sales we scored, the closed price landed inside the Messtimate range 57% of the time; median miss 9.3% (closed sales statewide, FL + GA feeds that permit an automated estimate). Re-scored weekly; last 2026-10-20.
Actual list price: $419,000 ($242/sq ft) — the seller's asking price is not an input to this range; compare the two.
A 11% spread on the same house — here is what a model can't see:
Condition & finishes — as new construction, builder upgrades and finish level aren't in the model.
The lot — this listing is waterfront; water frontage is priced far off nearby averages.
Carrying costs & concessions — this home carries HOA dues of $415/mo and a CDD assessment of about $1,900/yr; insurance, CDD/HOA and seller-paid buydowns change what a buyer actually pays.
And what the live market is doing right now:
This home: listed Sep 23, 2026 on market vs. a 106-day community median
25 active listings competing, 17 under contract
≈25.0 months of supply
12 closed here in the last 12 months
Want a property-specific value from a licensed agent? A Momentum Realty agent will do a real, free comparative market analysis — walking the home, the lot, the condition, and the live market.
Methodology: 20th–80th percentile band combining time-adjusted $/sq ft of comparable closed sales (9); MLS closed-sale records. Automated valuation model output for general information only — not an appraisal, not market value, not an offer, and not reviewed by a licensed appraiser. Updated October 22, 2026.
Momentum Scores
Momentum Property Score
66/100
Strongest on: Flood safety (95), Insurance cost (80)
0 limited50100 exceptional
66/100 is solid, mid-pack across the objective indicators below. It reflects only those measures — not the home’s quality, condition, or desirability.
A 0-100 score built from objective property and market data: flood risk, insurance, pricing, supply, affordability, and recent sales. Higher means more measures line up in a buyer’s favor. It reflects only the factors below.
Price vs area65
This home $242/sq ft vs the community 12-month median $257/sq ft.
Affordability71
List price $419,000 vs the community median $480,000. Not a measure of personal affordability.
Flood safety95
FEMA Zone X, ~22 ft elevation. Verify the parcel with FEMA.
Insurance cost80
From FEMA Zone X and a 2026 build. Obtain a property-specific quote.
Market liquidity15
Community median 106 days on market, ~25.0 months of supply (12-month record).
Pricing power73
Recent sales closed at about 93.5% of original asking (~6.5% below). More room below asking generally favors buyers.
Market timing61
Momentum Market Heat is 39/100 (cold). Cooler readings generally favor buyers; hotter readings favor sellers.
Coverage: 7 of 8 indicators had valid data for this home; indicators without data are left out, not scored as zero. Momentum Scores are objective, rules-based indicators computed from listing facts, public records, and recent comparable sales. They do not measure property condition, quality, or investment suitability, and they are not appraisals, valuations, investment advice, or judgments about a neighborhood or who should live there. Verify independently.
Momentum Research
The Momentum read
🟢 Buyer-leaning conditions around this listing. 25.0 months of supply in the surrounding market and 29 days on market for this home, against a 106-day area median.Days on market:this home 29Area median: 106 daysWhy it matters: above-median time on market, together with the level of supply, is a clear sign of how much leverage sits with buyers.Momentum Research interpretation of the MLS facts in the snapshot above. Source: Data provided by realMLS. As of October 20, 2026.
🟡 Asking $242 per square foot, about 6% below the community’s $257 median. Watersong At Rivertown’s 12-month median sold price per square foot is $257. Median sold price per square foot is up 2.3% year over year. Confidence: Very High · 119 closed sales in 12 monthsMLS facts: realMLS closed sales. A per-square-foot gap is context, not an appraisal; condition, lot, and view set the final number here.
40% of homes in Watersong At Rivertown are owner-occupied. An estimated 60% are non-owner-occupied, including 47% held in a company or trust and 4% out-of-state owners.Why it matters: a high owner-occupied share typically means fewer rentals nearby and steadier resale demand.Source: Florida Department of Revenue 2025 assessment roll (public records), 219 homes matched. Community-level context.
Recent Watersong At Rivertown sales closed near 93.5% of original asking.Why it matters: the community’s own record shows how far opening prices typically move, and how often buyers compete without financing.Momentum Research analysis of realMLS records, community-level, 12 months ending October 20, 2026. Aggregates only; deemed reliable but not guaranteed.
What’s unique here: one of only 25 active listings in Watersong At Rivertown.
Updated October 22, 2026 · MLS facts carry their source; interpretation lines are Momentum Research · Data sources & freshness
Seen enough photos?
Want to see 57 FOXFORD Place?
Tell us when works for you and a local agent will reach out to arrange a showing and answer your questions about this home.
Listed by MATTAMY REAL ESTATE SERVICES · MLS # 2154155
Request a showing
Keep looking
Similar homes for sale near Watersong At Rivertown
Active listings nearby at a comparable size and price. Listings held by brokerages other than Momentum Realty are marked with the listing broker. Deemed reliable but not guaranteed.
Recent local developments near this home, compiled from news and public sources. Provided for general information; verify details with the original source.
Sep 2026 · Development
UF Health Durbin Park 99-bed hospital opens in northern St. Johns County; Baptist Silverleaf adds emergency department
UF Health Durbin Park, a 99-bed hospital with a 24-hour emergency department on 42.5 acres, held its ribbon-cutting and opens the following week. Baptist Health's Silverleaf campus, about 10 miles south, is adding an emergency department, and AdventHealth and Acadia Health have also opened facilities near I-95. The county's population has grown more than 25% since 2020.
Why it matters: New hospital and emergency capacity shortens drive times to emergency care and adds healthcare jobs in northern St. Johns County. The site is about 8 miles northeast of Watersong At Rivertown.
St. Johns County school board moves ahead with design of SilverLeaf-area high school costing about $100 million
The board approved moving forward with design and architecture for a high school on Parcel 38, with cost estimated at roughly $100 million and possibly up to $120 million as design progresses. Construction is expected to take about three years. A board workshop on full project scope is being prepared.
Why it matters: A new high school in the SilverLeaf area would add school capacity for the fast-growing northwest part of the county. The site is about 3 miles east of Watersong At Rivertown.
CR 210 widening westbound lanes set to reopen in St. Johns County
News4Jax reported that all westbound lanes of the County Road 210 widening project in St. Johns County were expected to reopen by the end of Friday, July 31, 2026, ahead of the August 10 school year start. The county said it is managing 44 active road projects totaling $183.1 million this year.
Why it matters: Expands roadway capacity on a major county corridor, improving traffic flow and supporting continued growth along the CR 210 area. The project is about 11 miles east of Watersong At Rivertown, elsewhere in St. Johns County.
First Coast Expressway advances as an economic-development corridor across Clay and St. Johns
The First Coast Expressway (State Road 23), a tolled beltway looping around the west and south of the Jacksonville metro, continued to open land for development along its corridor, with the final St. Johns County phase from Interstate 95 to east of County Road 2209 in progress. FDOT held a St. Johns County open house on the final phase in January 2026.
Why it matters: New limited-access highway capacity shortens commutes and opens adjacent land, changes that have historically shaped where new communities and demand concentrate. The site is about 6 miles west of Watersong At Rivertown.
See schools, amenities, builders, HOA/CDD detail, and every active & sold home in the community — the single biggest advantage of buying here over a portal.
Schools currently assigned to this address in St. Johns County, provided as neutral factual data. Assignments can change — confirm current zoning with the school district. This is not a statement about the home's suitability for any person or family.
GRADEA
Freedom Crossing Academy (St. Johns)Public K-8 · St. Johns County School District · Grade A (Florida DOE 2025-26)
GRADEA
Liberty Pines Academy (St. Johns)Public K-8 · St. Johns County School District · Grade A (Florida DOE 2025-26)
GRADEA
Bartram Trail High School (St. Johns)Public 9-12 · St. Johns County School District · Grade A (Florida DOE 2025-26)
What's nearby
Drive times to everyday places
Approximate driving times to verified nearby destinations. Estimates for general reference; actual times vary with traffic and route.
Groceries
Weedman's Grocery 4 min
Dining
Woodpeckers Backyard BBQ 4 min
Shopping
Harbor 210 Village 6 min
Parks
Trout Creek Memorial Park and Marina 6 min
Nearby & guides
City, county & community guides
Where this home sits, with links to the matching guides. General reference only.
Items worth confirming for 57 FOXFORD Place, chosen from what the record shows. This is general guidance, not advice about this specific property.
New construction: get the builder's warranty terms and the certificate of occupancy in writing, and ask which finishes shown are upgrades.
HOA dues are listed at $415/mo: request the current budget, reserves, and rules before relying on that figure or on any restriction.
A CDD assessment of about $1,900/yr is on record: confirm the bond balance and remaining term with the district; it appears on the tax bill.
FEMA flood zone X: flood insurance is not usually required, but get a quote anyway — FEMA reports roughly one in four flood claims come from outside high-risk zones.
Get a homeowners insurance quote for this specific address in St. Johns County; a wind-mitigation inspection and, on older homes, a four-point inspection can change the premium.
Waterfront: confirm seawall or dock condition and permits, and ask who owns and maintains the shoreline.
Listed living area is 1,731 sq ft: verify it against the property appraiser's record and measure before relying on it.
Order a survey to confirm lot boundaries and easements.
Review permit history with the county.
Property taxes: the estimate on this page (about $3,603/yr) assumes reassessment at the list price; the seller's current bill is not a guide Exemptions and portability change the actual bill — confirm with the county property appraiser.
Confirm school zoning directly with the district.
Provenance
Data sources & freshness
Listing record
realMLS, checked against the MLS hourly (last: October 22, 2026)
Comparable sales
realMLS closed sales within about 3 miles, last 18 months, as of October 20, 2026
Flood zone & elevation
FEMA flood maps + USGS elevation (Zone X shown above)
Taxes & monthly cost
Typical county effective rate applied to the list price; an estimate, not a bill
Insurance figure
Modeled estimate; obtain a real quote before offering
Schools
2025-26 district assignments; verify with the district
Momentum Research lines are our own analysis of realMLS records; MLS data is deemed reliable but not guaranteed. Estimates are informational, not appraisals or advice. Methodology: how Momentum scores are computed.
Answered before you ask
Frequently asked questions
How big is 57 FOXFORD Place and when was it built?
Per the listing record, 57 FOXFORD Place was built in 2026 and has 1,731 sq ft of living area, 2 bedrooms and 2.0 bathrooms. Living area and lot size come from the MLS record and should be verified against the county property appraiser.
What community is 57 FOXFORD Place in?
57 FOXFORD Place is in Watersong At Rivertown in St. Johns, St. Johns County. The comparable-sales section on this page shows recent closed sales nearby from the same MLS data.
Does 57 FOXFORD Place have an HOA, and how much are the dues?
The listing reports HOA dues of $415 per month. Dues, what they cover, and the community's rules should be confirmed from the association's current documents before relying on them.
What is a CDD fee?
A Community Development District fee funds a community's roads, amenities, and infrastructure through a bond and appears on the annual tax bill. This parcel shows a CDD assessment of about $1,900 per year; confirm the exact figure with the county.
Why might property taxes on 57 FOXFORD Place differ from the current owner's?
The estimate on this page (about $3,603 per year) assumes reassessment at the list price less the homestead exemption. Florida reassesses a home after it sells; for a homesteaded seller the Save Our Homes cap on their assessment does not transfer, and a buyer's own exemptions and portability are applied separately, so the two bills usually differ. Any tax figure shown here is an estimate, not the actual bill — confirm with the county property appraiser and tax collector.
Are short-term rentals allowed at 57 FOXFORD Place?
Many communities restrict short-term rentals, and city/county rules also apply. Confirm the current HOA/CDD rules and local ordinances directly before assuming any rental use.
Is 57 FOXFORD Place in a flood zone?
The FEMA flood map places this parcel in Zone X, outside the special flood hazard area, so flood insurance is not usually required by a lender. It is still available and worth quoting; confirm the parcel's status with FEMA and your insurer.
Can I rely on the figures on this page?
No. Estimated taxes, insurance, payments, and any market or comparable-sales summary are opinions and estimates for general information only and should not be relied upon. Verify all information independently before making any decision.
Ready when you are
See 57 FOXFORD Place in person
Private tours available 7 days a week, in person or by live video walkthrough. Request a tour or send a question and a licensed Momentum Realty agent will follow up.
Opinion & estimate — do not rely on this page. Any figure on this page that is not a verbatim fact from the listing or a public record — including estimated property taxes, insurance, CDD/HOA amounts, mortgage payments, comparable-sales summaries, and market statistics — is an opinion and estimate provided for general informational purposes only. These figures may be inaccurate or out of date, are not appraisals, valuations, or financial, legal, tax, or investment advice, and should not be relied upon. Do not make any purchase, offer, financing, or other decision based on this page. Independently verify everything — price, square footage, lot size, year built, taxes, CDD/HOA, flood status, school assignments, permits, and community rules — with the listing broker, the county, your lender, a licensed inspector, an insurer, and your own advisors before acting.
Estimate methodology. Tax estimates apply county millage to the list price (less the homestead exemption where the parcel is matched to the certified roll) and will differ from the actual assessed bill. Cost and market figures are derived from available data and simple calculations, not a professional appraisal. We make no representation that any estimate reflects fair market value.
Equal Housing Opportunity. Content on this page is compiled from public records, MLS data, and automated sources and may contain errors or be out of date. It is general information only, not a representation about any specific property, community, builder, or association. Verify information independently before relying on it. Momentum Realty supports the Fair Housing Act and does not discriminate on the basis of race, color, religion, sex, handicap, familial status, national origin, sexual orientation, or gender identity. Information about schools, distances, and amenities is provided as neutral factual data to help you research the property and is not a statement about who should or should not live here or the suitability of the home or neighborhood for any person or group. School data may change — confirm current assignments with the school district.
Found an error? If you are the owner, listing agent, or a party to this property and believe any information is inaccurate, email and we will review and correct or remove it promptly.
Automated content. Some summaries, distances, and estimates on this page are generated automatically from public and proprietary data sources and may contain errors or omissions. We strive for accuracy but cannot guarantee the completeness or accuracy of any information. Verify anything important independently.
No warranty; measurements & photos. No guarantee, warranty, or representation of any kind is made regarding the completeness or accuracy of any information, descriptions, or measurements on this page — including square-footage measurements and property condition — all of which should be independently verified through appropriate means, including in-person inspection and public records. Photographs may be virtually staged or digitally enhanced and may not reflect actual property conditions. Momentum Realty and its agents expressly disclaim any liability in connection with the information provided.
Sold price and details are from public records and the MLS, deemed reliable but not guaranteed. Shown for comparison only — not an appraisal or a statement of this home's value.