
Amberly
Homes for Sale in Green Cove Springs, FL
All 419 homes for sale in Green Cove Springs, FL · median $384,000 · 421 homes for sale in 32043 · Clay County homes for sale
True comps, carrying-cost math, and listings before the portals.
Photo courtesy of OLYMPUS EXECUTIVE REALTY, INC · via realMLS
As of October 2026, Amberly in Green Cove Springs, FL has 14 homes for sale and 14 pending, asking from $299,990 to $463,483 (median $420,212). Over the 12 months ending 2026-10-23, 46 recorded sales closed at a median of $358,990, $172 per square foot, a median 91 days on market, sellers accepting 96% of original asking. Homes listed or recently sold were built 2025–2026 with 40 new construction; 40 of 40 report an HOA (median $40/mo); 4 of the 40 geocoded homes sit in a FEMA special flood hazard zone (median elevation 94 ft). At the median price and Clay County's FY2025-26 rate of 15.05 mills, annual property tax runs about $5,400 ($4,810 with the full homestead exemption).
Last 30 days in Amberly: 3 new listings (median asking $354,990), 14 under contract right now, 3 closed sales (median $329,990). As of October 24, 2026, realMLS.
Homes For Sale Right Now in Amberly
Live MLS inventory for Amberly. Every active listing, what is under contract right now, and the last 12 months of closed sales, refreshed twice a day. Closed comps beat an algorithm's guess every time.
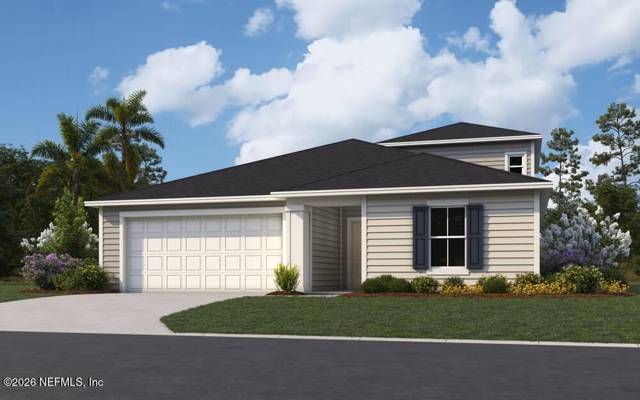 Active · 73 daysTop listing
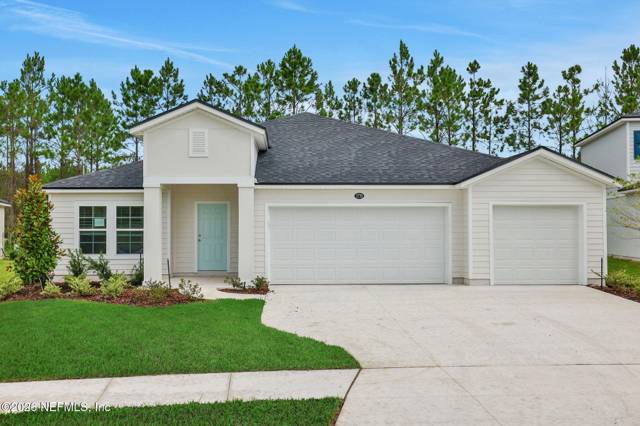 Active · 172 days
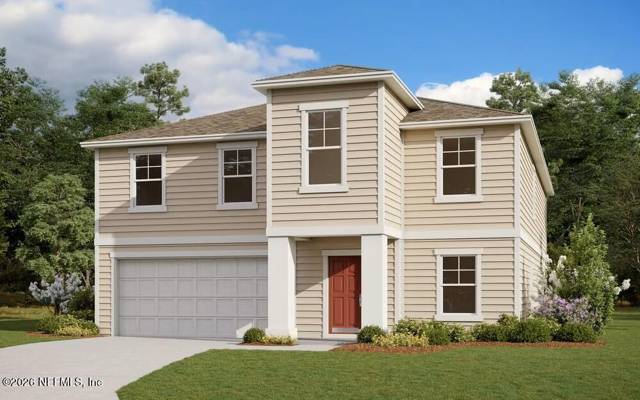 Active · 49 days
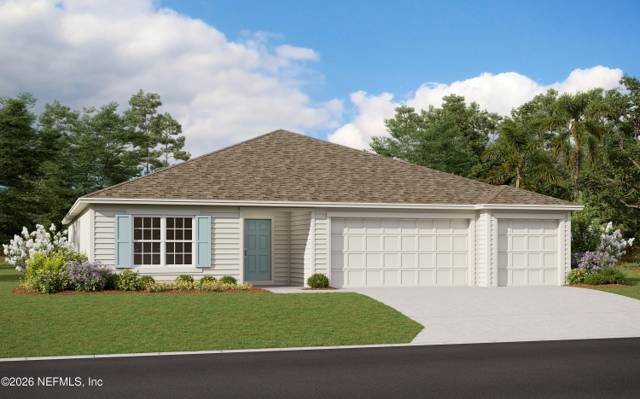 Active · 102 days
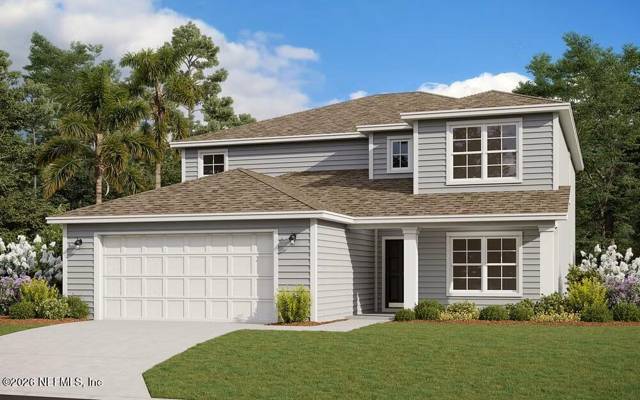 Active · 47 days
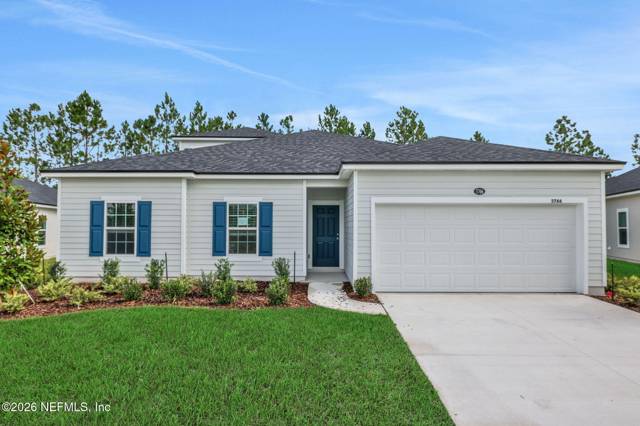 Active · 61 days
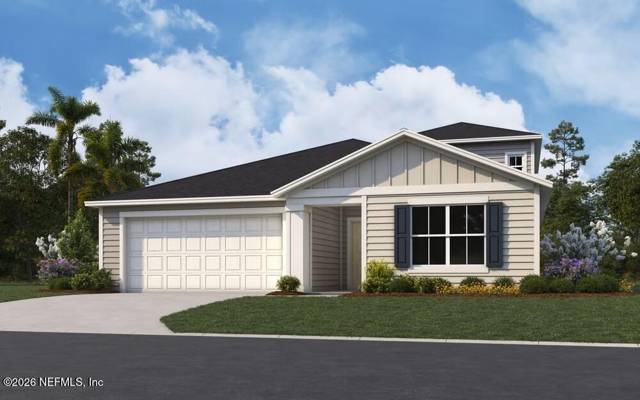 Active · 61 days
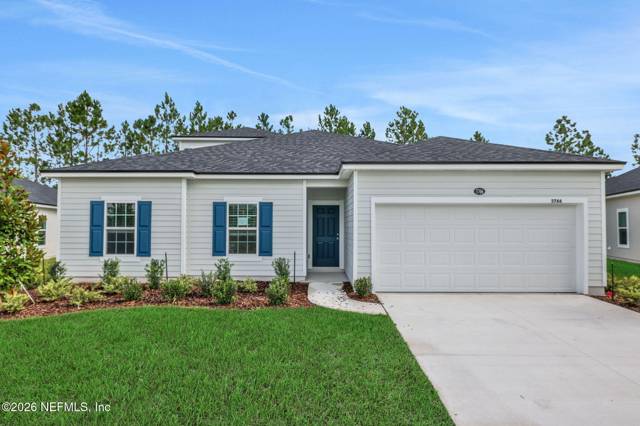 Active · 119 days
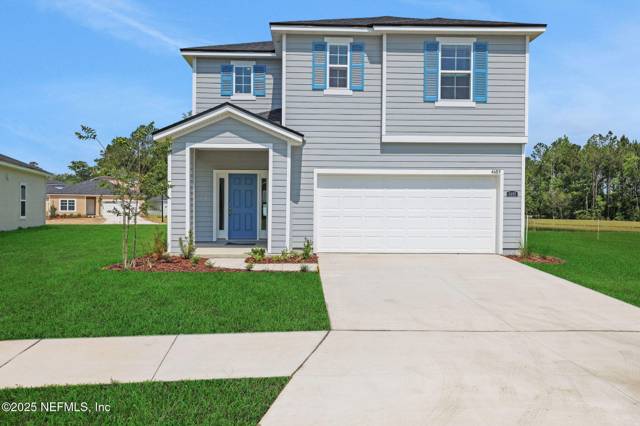 Active · 12 days
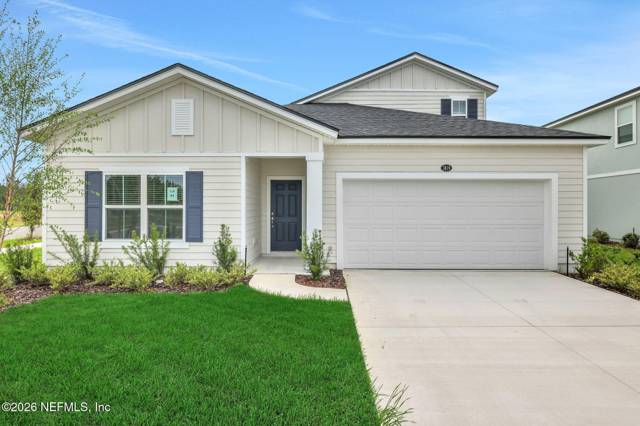 Active · 61 days
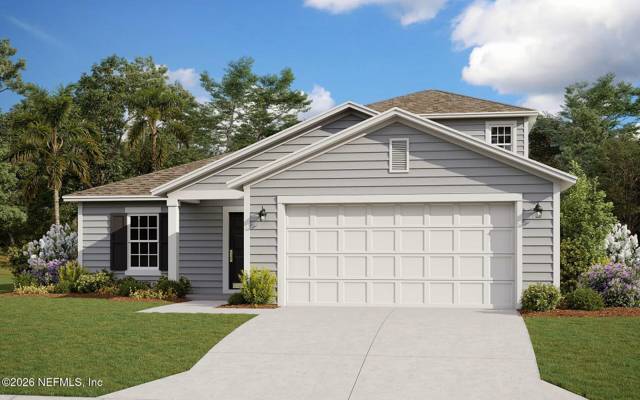 Active · 40 days
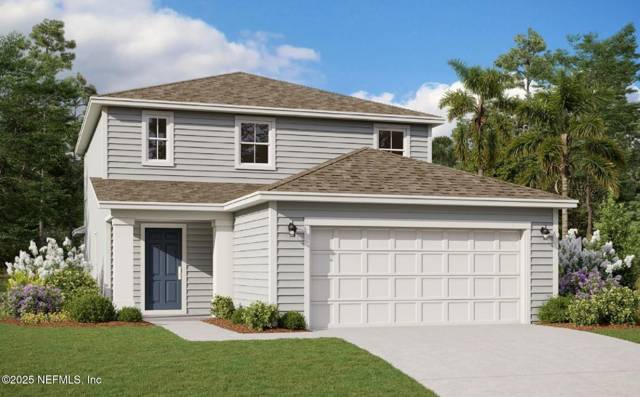 Active · 18 days
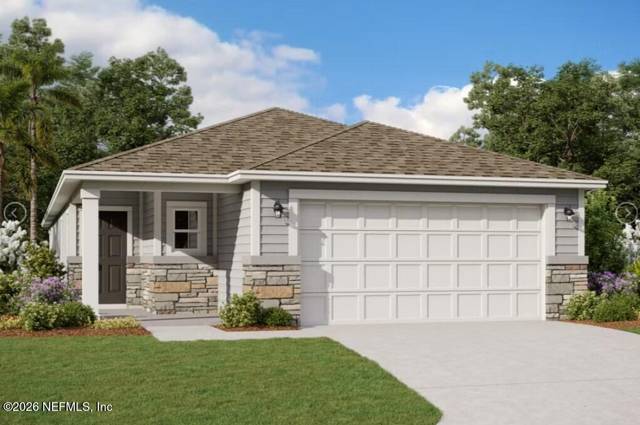 Active · 17 days
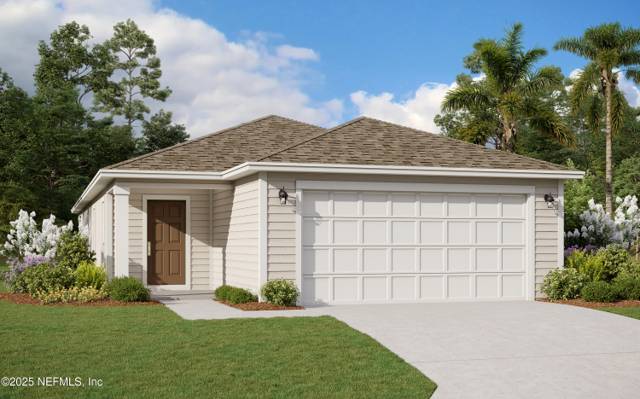 Active · 19 days
Active and pending Amberly listings as of 2026-10-23, priced high to low. Source: Data provided by realMLS. Tap any home to ask about it.

Amberly is a small, thinly traded slice of Green Cove Springs — 19 active listings and a median price of $355,000 set the tone, with price per square foot landing at $178.07. There's no clubhouse fee or HOA amenity package showing up in current MLS listings, so that price is built almost entirely from the house and the lot themselves, not what's built around them.
The market sits in balanced territory at 5.8 months of supply, and the 53-day median days-on-market backs that up — this isn't an environment where homes go under contract in a weekend. With only 39 closings in the recent window, the median price can move on a handful of sales, so sellers should lean on comparable condition and square footage rather than the headline number, and buyers have real room to negotiate rather than compete.
Figures in this note are as of July 15, 2026. The live market numbers elsewhere on this page update nightly and are newer.
Amberly right now
🟢 Buyer-leaning market. 15.0 months of supply and 46% of the inventory already under contract give buyers above-average negotiating leverage.Why it matters: months of supply is how long today's inventory would last at today's sales pace; under-contract share is the portion of homes for sale that already have a buyer.Momentum Research analysis of realMLS records, as of October 23, 2026. Confidence: Very High (28 active and pending listings, 46 closed sales in 12 months).
Jump to: Price history & scorecard · Homes for sale · Schools · FAQ
· Updated October 24, 2026 · Live data: realMLS, refreshed twice daily · MLS facts carry their source; interpretation lines are Momentum Research · Data sources & freshness
The 60-Second Overview
Amberly market snapshot (as of October 23, 2026): the median sale price is about $359K ($172 per sq ft over the trailing 12 months of closed sales), a median 91 days on market for closed sales, and 15.0 months of supply, a buyer-leaning market.
In ZIP 32043 (Green Cove Springs), 1,114 homes closed in the last 12 months at a median of $336K ($183/sq ft), down 3.4% year over year, with a median 64 days on market. Right now 265 active and 115 pending listings put supply at about 14.4 months — a buyer's market. See the live ZIP 32043 housing market and the Clay County market.
realMLS (Northeast Florida) sales records identify 74 homes in Amberly that have changed hands since 2025, built between 2025 and 2026 (median 2026), with a median living area of about 2,289 sq ft and a typical 4-bedroom, 3-bath layout; 100% are single-family homes. Source: realMLS (Northeast Florida) closed-sale history compiled by Momentum Research; counts reflect homes with a recorded MLS sale, not every home in the community.
Flood zones in Amberly: of 35 listing addresses checked against the FEMA National Flood Hazard Layer, 89% sit outside the FEMA Special Flood Hazard Area (Zone X); 11% are in an A-series high-risk zone where flood insurance is required with a federally backed mortgage. Individual parcels vary - verify any specific address at msc.fema.gov. See flood zones by neighborhood in Green Cove Springs.
Amberly is a small, balanced-market pocket of Green Cove Springs in Clay County: with just 19 active listings and no identified community amenities in current MLS data, pricing here is driven almost entirely by the individual home rather than the neighborhood package around it.
The setting & the homes.
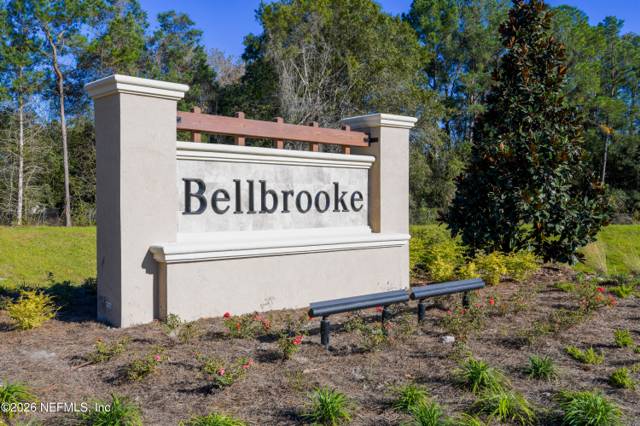
Aerial and on-site photos of Amberly. Swipe to explore the community.
Swipe or use the arrows → tap any photo to enlarge
 Amberly
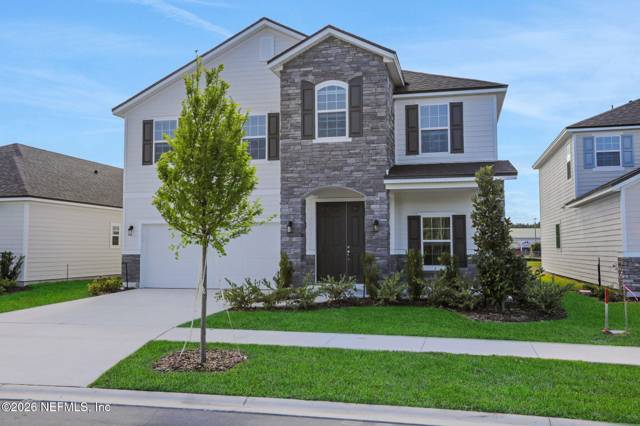 Amberly
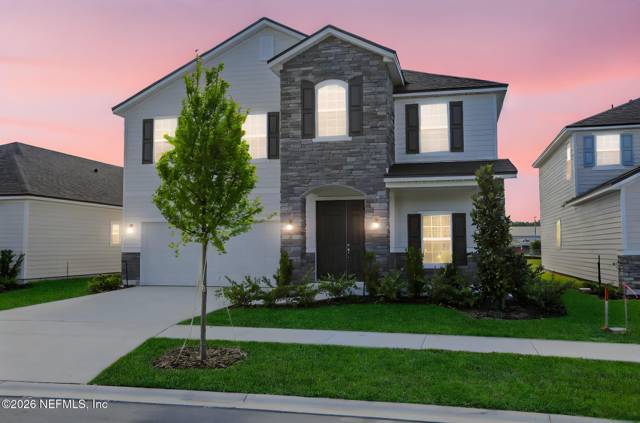 Amberly
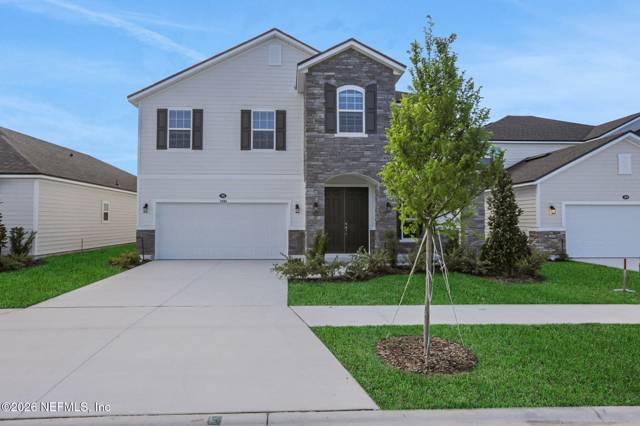 Amberly
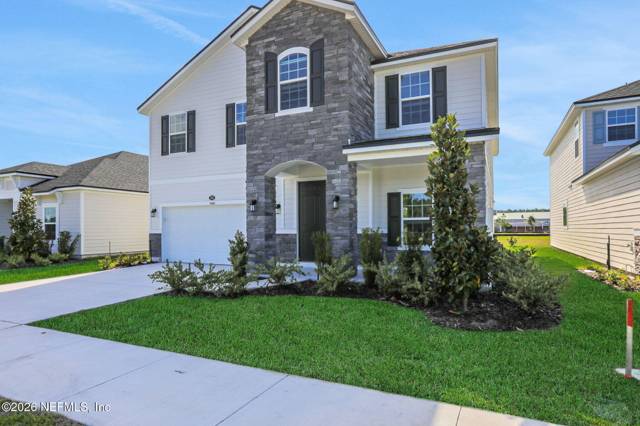 Amberly
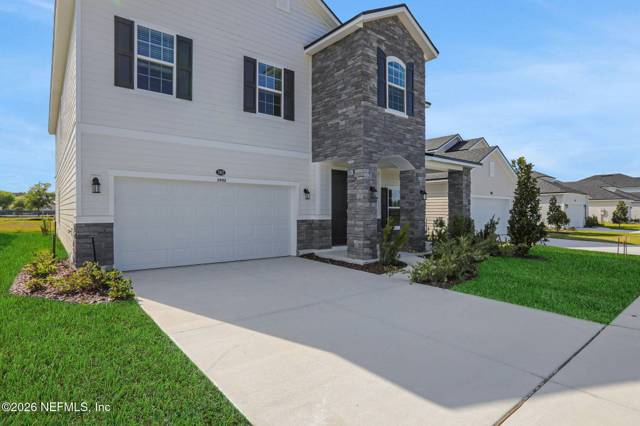 Amberly
Photos from realMLS listings in Amberly; content deemed reliable but not guaranteed.
Who Amberly is best for.
Best for
- Buyers comfortable purchasing near the $355,000 median and willing to work through a 53-day median timeline to close.
- Investors evaluating a market where homestead exemptions are effectively absent among current active listings.
- Buyers who want to pay for the home and lot itself, since no community amenities are identified in current MLS data.
Probably not for
- Buyers who need a fast, competitive-bid purchase — 5.8 months of supply points to a balanced, not a seller's, market.
- Sellers expecting to price well above the $355,000 median without strong comparable support, given only 39 closings in the recent window.
- Buyers seeking built-in community amenities such as a clubhouse or pool package, since none are identified here.
Price History: What Homes Here Have Actually Sold For
Median sale price over the trailing 12 months ending October 23 of each year, from record-level realMLS closed sales. Same methodology as every appreciation figure on this page: the 2026 point ($359K) IS the median in the snapshot above.
Windows contain 2 to 46 sales each (46 in the current window); every figure carries its sample size. Source: Data provided by realMLS. Deemed reliable but not guaranteed.
The real cost & risk here
Before the list price, the Florida math the portals skip. These are Clay County typicals — your exact home, flood zone, and insurance quote will vary, so verify each before you offer.
Check it for your address: look up your flood zone (FEMA) · insurance by county · true-cost calculator · Clay County scorecard.
County typicals from Momentum’s Florida housing data (Zillow & Realtor.com aggregates, Census, FRED), updated monthly; insurance modeled. Flood zone is property-specific — always confirm via FEMA.
Amberly Market Scorecard
Amberly is currently a strong buyer's market. About 14.0 months of supply, a median asking price of $420,212, and homes go under contract in about 65 days.
Typical home value in the 32043 ZIP is $344,671, about 13.7% below the Florida norm (Zillow Home Value Index).
Go deeper: ZIP market scorecard · county scorecard · true cost calculator · affordability calculator.
Live data: realMLS, refreshed twice daily. Typical value: Zillow Research. Market metrics only; these describe homes for sale and recent sales, not residents.
Amberly on the map.
Every active, pending, and recently sold home, plotted. Toggle the layers and tap a home for the details.
Listing locations from realMLS. Map data © OpenStreetMap contributors.
Schools
- Clay County Public Schools
- Verify the zoned schools by address
- Magnet and choice options may be available
- Shadowlawn · Elementary
- Lake Asbury · Middle
- Clay · High
Zoned schools reflect the assignments reported on recent Amberly listings and can change; always confirm with Clay County Public Schools for a specific address.
Buying with schools in mind? We can confirm the exact zoned schools for any Amberly address.
Shop the zone: Homes zoned for Shadowlawn Elementary School · Homes zoned for Lake Asbury Middle School · Homes zoned for Clay High School
The Amberly buying strategy.
If we were buying in Amberly today, this is the order of operations we would run for our clients.
Underwrite the condition first. Price the roof, HVAC, and systems honestly before judging any list price; condition swings value here more than square footage alone.
Match the home to real comps. Recent sales of similar condition and lot, not the asking price, tell you what a home is worth.
Use your leverage. With inventory sitting, there is room to negotiate on anything dated or overpriced and to ask for repairs or a rate buydown.
Line up financing and inspection early. A pre-approval and an inspection plan let you act fast and negotiate from evidence.
Keep an agent in your corner. The listing agent works for the seller; we represent you and prepare a hand-built valuation before any offer in Amberly.
What's Actually Setting Amberly's Price
Strip away the marketing and Amberly's value case is straightforward: a $355,000 median price and $178.07 per square foot, generated from a pool of just 19 active listings. That's a small enough sample that one or two unusual sales can shift the median meaningfully, which is why we weight recent, comparable closings over the headline number when we price a listing or advise on an offer here.
None of the active listings currently carry a homestead exemption, which points to a market weighted toward non-owner-occupied purchases rather than owner move-ins. Combine that with 5.8 months of supply, a balanced market band, and a 53-day median days-on-market, and the picture is a community that moves at its own pace — not a rush environment for buyers, and not a sellers'-market environment either. Thirty-nine closings in the recent window is enough to confirm the trend, but not enough to call it a runaway one.
The location and the amenities are priced into every listing in Amberly. The deal is won or lost on condition, the comps, and the renovation math.
Momentum Buy Score.
Our proprietary 0 to 10 read across the factors that decide how a home in Amberly buys, holds, and resells. Momentum Research; not an appraisal.
Momentum Intelligence Scores are our proprietary, qualitative assessment on a 0 to 10 scale, built from the record-level market data on this page. They are a framework for comparing communities, not a guarantee of future value and not advice on a specific home; unlike an automated value estimate they do not price your home, they grade the community on evidence you can inspect. Composite is the plain average of the 3 factors (2.5). Basis: Liquidity & Demand 15.0 months of supply; Owner Commitment 0% owner-occupied; Pricing Power 96.1% sale-to-list. Refreshed with each data update.
Why work with Momentum here
In a market this thin — 19 active listings, 39 recent closings — the median price and per-square-foot figures move on individual sales, not broad trend lines. That's exactly where local, listing-by-listing knowledge matters more than an algorithm: knowing which of those 19 listings are truly comparable, what condition is driving the $178.07-per-square-foot baseline, and how to price or negotiate against a 53-day median days-on-market instead of reacting to it.
Amberly in 15 seconds.
Tools for a Amberly buy.
Free calculators to pressure-test the real cost before you tour.
Selling here is won on condition and pricing to real comps, not an automated estimate. The right number comes from closed Amberly sales matched to your home.
Price it to the comps and condition, not an automated estimate.
If you are thinking about selling in Amberly, the right list price comes from recent comparable sales matched to your home's condition and location, not an automated estimate.
What is your Amberly home worth?
Get a no-obligation home value based on real comparable sales in Amberly, not an automated guess. Tell us about your home and we will personally prepare your numbers and a pricing strategy. No obligation, no spam.
See all homes for sale in Green Cove Springs →
Recently off market in Amberly
Homes in Amberly that recently left the market. Each address opens its public-record profile: county-recorded value, property taxes, the last recorded sale, community sales history, and what is for sale nearby now. 46 on record.
- 3402 Humphrey Street · off market
- 3406 Humphrey Street · off market
- 3407 Humphrey Street · off market
- 3410 Humphrey Street · off market
- 3411 Humphrey Street · off market
- 3414 Humphrey Street · off market
- 3415 Humphrey Street · off market
- 3418 Humphrey Street · off market
| Location | Green Cove Springs, Clay County, FL · ZIP 32043 |
|---|---|
| Home types (current listings and sales) | single-family 100% |
| Amenities listed by sellers | Carbon Monoxide Detector(s), None, Dog Park, Fitness Center, Pickleball, Clubhouse |
| Sale prices, last 12 months | $358,990 median across 46 closed sales · $172 per sq ft |
| Days on market (closed sales) | 91 median |
| For sale right now | 15 active, 13 pending · median asking $419,990 · 15.0 months of supply |
Data as of October 23, 2026. Data provided by realMLS. Market figures describe homes, not residents. Cite as: Momentum Realty, “Amberly key facts,” movewithmomentum.com/neighborhoods/amberly-green-cove-springs, data as of October 23, 2026.
Housing distress & ownership in Amberly, Green Cove Springs
Who owns here, how much is not owner-occupied, and how much for-sale inventory is under distress.
Source: Momentum Realty Research. Ownership & parcels from the FL DOR 2025 tax roll; distress from MLS active-listing status/remarks; price from MLS closed sales. Source: Data provided by realMLS. Deemed reliable but not guaranteed.
Just listed in Amberly
The newest homes for sale in Amberly right now, newest first. Each link opens the full listing with every photo, the price history and a tour request.
- 3873 Holstein Way $389,990 · 4 bd · 2 ba · 2,500 sq ft · listed Oct 8, 2026 Courtesy of OLYMPUS EXECUTIVE REALTY, INC
- 3867 Holstein Way $324,990 · 4 bd · 2 ba · 1,797 sq ft · listed Oct 3, 2026 Courtesy of OLYMPUS EXECUTIVE REALTY, INC
- 3915 Holstein Way $354,990 · 4 bd · 2.5 ba · 2,317 sq ft · listed Oct 2, 2026 Courtesy of OLYMPUS EXECUTIVE REALTY, INC
- 3722 Holstein Way $380,921 · 5 bd · 3 ba · 2,286 sq ft · listed Sep 10, 2026 Courtesy of OLYMPUS EXECUTIVE REALTY, INC
- 3730 Holstein Way $429,664 · 4 bd · 3.5 ba · 2,956 sq ft · listed Sep 3, 2026 Courtesy of OLYMPUS EXECUTIVE REALTY, INC
- 3742 Holstein Way $447,713 · 5 bd · 2 ba · 3,498 sq ft · listed Sep 3, 2026 Courtesy of OLYMPUS EXECUTIVE REALTY, INC
Checked against the MLS nightly. All new listings in this market.
Every Home for Sale in Amberly Green Cove Springs Right Now (28)
All 28 active and pending Amberly Green Cove Springs listings with a detail page, newest first, refreshed twice a day from the MLS.
- 3873 Holstein Way · $389,990 · 4 bd / 2 ba · listed Oct 9, 2026 · listed by Olympus Executive Realty, Inc
- 3867 Holstein Way · $324,990 · 4 bd / 2 ba · listed Oct 3, 2026 · listed by Olympus Executive Realty, Inc
- 3915 Holstein Way · $354,990 · 4 bd / 2.5 ba · listed Oct 2, 2026 · listed by Olympus Executive Realty, Inc
- 3901 Holstein Way · $309,990 · 3 bd / 2 ba · listed Oct 2, 2026 · listed by Olympus Executive Realty, Inc
- 3722 Holstein Way · $380,921 · 5 bd / 3 ba · listed Sep 10, 2026 · listed by Olympus Executive Realty, Inc
- 3730 Holstein Way · $429,664 · 4 bd / 3.5 ba · listed Sep 4, 2026 · listed by Olympus Executive Realty, Inc
- 3742 Holstein Way · $447,713 · 5 bd / 2 ba · listed Sep 4, 2026 · listed by Olympus Executive Realty, Inc
- 3774 Holstein Way · $478,174 · 5 bd / 4 ba · pending · listed Aug 27, 2026 · listed by Olympus Executive Realty, Inc
- 3864 Holstein Way · $389,990 · 5 bd / 4 ba · pending · listed Aug 27, 2026 · listed by Olympus Executive Realty, Inc
- 3778 Holstein Way · $389,990 · 4 bd / 3 ba · listed Aug 21, 2026 · listed by Olympus Executive Realty, Inc
- 3796 Holstein Way · $420,435 · 5 bd / 4 ba · listed Aug 21, 2026 · listed by Olympus Executive Realty, Inc
- 3754 Holstein Way · $426,024 · 5 bd / 3 ba · listed Aug 21, 2026 · listed by Olympus Executive Realty, Inc
- 3702 Holstein Way · $484,865 · 5 bd / 4 ba · pending · listed Aug 21, 2026 · listed by Olympus Executive Realty, Inc
- 3746 Holstein Way · $463,483 · 5 bd / 4 ba · listed Aug 9, 2026 · listed by Olympus Executive Realty, Inc
- 3848 Holstein Way · $391,990 · 4 bd / 3 ba · pending · listed Aug 9, 2026 · listed by Olympus Executive Realty, Inc
- 3880 Holstein Way · $465,990 · 5 bd / 3.5 ba · pending · listed Aug 9, 2026 · listed by Olympus Executive Realty, Inc
- 3832 Holstein Way · $354,490 · 3 bd / 2 ba · pending · listed by Olympus Executive Realty, Inc
- 3852 Holstein Way · $379,490 · 4 bd / 3 ba · pending · listed by Olympus Executive Realty, Inc
- 3856 Holstein Way · $421,990 · 5 bd / 3.5 ba · pending · listed by Olympus Executive Realty, Inc
- 3905 Holstein Way · $299,990 · 4 bd / 2.5 ba · listed by Olympus Executive Realty, Inc
- 3758 Holstein Way · $446,416 · 4 bd / 3 ba · listed by Olympus Executive Realty, Inc
- 3844 Holstein Way · $421,990 · 5 bd / 4 ba · pending · listed by Olympus Executive Realty, Inc
- 3897 Holstein Way · $389,990 · 4 bd / 2 ba · pending · listed by Olympus Executive Realty, Inc
- 3893 Holstein Way · $363,058 · 4 bd / 2.5 ba · pending · listed by Olympus Executive Realty, Inc
- 3766 Holstein Way · $419,990 · 5 bd / 3 ba · listed by Olympus Executive Realty, Inc
- 3770 Holstein Way · $449,990 · 4 bd / 3 ba · listed by Olympus Executive Realty, Inc
- 3902 Holstein Way · $465,990 · 5 bd / 3.5 ba · pending · listed by Olympus Executive Realty, Inc
- 3890 Holstein Way · $381,990 · 4 bd / 3 ba · pending · listed by Olympus Executive Realty, Inc
Recently sold in Amberly Green Cove Springs
- 3889 Holstein Way · sold $338,990
- 3885 Holstein Way · sold $303,990
- 3431 Humphrey Street · sold $329,990
- 3906 Holstein Way · sold $386,000
- 3819 Holstein Way · sold $349,990
- 3829 Holstein Way · sold $369,990
- 3762 Holstein Way · sold $463,990
- 3932 Holstein Way · sold $379,990
- 3948 Holstein Way · sold $440,990
- 3920 Holstein Way · sold $425,000
Closed sales from the MLS; each page shows the sold price, taxes and value history.
More Green Cove Springs home searches
- All homes for sale in Green Cove Springs, FL
- Homes for sale in Clay County, FL
- Green Cove Springs pool homes for sale
- Green Cove Springs waterfront homes for sale
- Gated communities in Green Cove Springs
- Green Cove Springs golf course homes
- Homes under $300K in Green Cove Springs
- Homes from $300K to $500K in Green Cove Springs
- 4-bedroom homes for sale in Green Cove Springs
- Green Cove Springs home values: what is my house worth?
Green Cove Springs guides & data
- Market data
- Cost of living
- Best neighborhoods
- Flood zones
- Property taxes (Clay County)
- Homestead exemption (Clay County)
- Home insurance cost
- New construction
Florida buyer guides
- Florida home insurance rates by county
- Florida property tax by county
- Florida property tax calculator
- What flood zone X means
- The 4-point inspection, explained
- Florida flood insurance calculator
Real estate agent in Green Cove Springs? Join Momentum in Green Cove Springs: 100% commission, one $12K cap.
Streets in this community
Street-level pages: every home on record, what sold and what is for sale on each street.
- Holstein Way (50 homes on record)
Recent Developments in Amberly
Development, infrastructure, retail, and school activity affecting Amberly, tracked by our team and summarized from public reporting and official sources, with links to the original coverage. Last updated October 2026.
- September 2026Infrastructure
County Road 220 widening and Little Black Creek bridge replacement open to traffic in Clay County
The project finished ahead of schedule, with a new four-lane bridge over Little Black Creek replacing a 1947 structure. Phase 1 began in December 2024 with intersection improvements at Rideout Ferry Road, and Phase 2 began in January 2025. Officials say it should ease traffic along the corridor.
What it may mean for the marketA four-lane CR 220 corridor improves commute capacity for Fleming Island and Middleburg area drivers. The site is about 6 miles southeast of Amberly.
Source: News4JAX - June 2026Development
Hillwood contracts with the City of Jacksonville for 192 acres at AllianceFlorida at Cecil Commerce Center
Master developer Hillwood contracted with the City of Jacksonville for 192 acres at AllianceFlorida at Cecil Commerce Center on Jacksonville's Westside, continuing the buildout of the former Naval Air Station Cecil Field into an industrial and logistics park.
What it may mean for the marketContinued absorption of large industrial parcels at Cecil signals sustained employment growth on the Westside, which can support housing demand across nearby communities. The site is about 5 miles northwest of Amberly.
Source: Jax Daily Record - June 2026Builder Activity
Hyland Trail to bring over 3,000 homes to Lake Asbury in Clay County
News4Jax reported that Hyland Trail, along with the related Edenbrooke and The Glens communities, will bring more than 3,000 new homes to the Lake Asbury area of Clay County. Homes are being built by Dream Finders, Pulte and Lennar, with a Lodge amenity center featuring a beach-entry pool, splash zone, exercise facility and pickleball courts. Edenbrooke includes an age-restricted, low-maintenance home section.
What it may mean for the marketAdds a large volume of new single-family housing supply and a private amenity center to the Lake Asbury area, expanding for-sale inventory across a range of home sizes and price points. The project is about 9 miles south of Amberly, elsewhere in Clay County.
Source: News4Jax - June 2026Infrastructure
First Coast Expressway advances as an economic-development corridor across Clay and St. Johns
The First Coast Expressway (State Road 23), a tolled beltway looping around the west and south of the Jacksonville metro, continued to open land for development along its corridor, with the final St. Johns County phase from Interstate 95 to east of County Road 2209 in progress. FDOT held a St. Johns County open house on the final phase in January 2026.
What it may mean for the marketNew limited-access highway capacity shortens commutes and opens adjacent land, changes that have historically shaped where new communities and demand concentrate. The site is about 11 miles southeast of Amberly.
Source: Jax Daily Record - April 2026Development
Hillwood seeks to mass-grade an AllianceFlorida site for a possible 1 million-square-foot building
Hillwood asked to mass grade a site at AllianceFlorida at Cecil Commerce Center to prepare for a possible 1 million-square-foot building, a step that typically precedes a large industrial or distribution user committing to the Westside park.
What it may mean for the marketA build-ready million-square-foot pad points to a potential large employer on the Westside, the kind of jobs anchor that can lift demand for nearby housing. The site is about 5 miles northwest of Amberly.
Source: Jax Daily Record
Summaries reflect public reporting and official sources linked above as of the dates shown. Project details, timelines, and approvals can change. Commentary on potential market effects is general observation, not investment advice or a prediction for any specific property. For the freshest items across the whole region, see This Week in Northeast Florida.
What it really costs to own in Amberly
The parts of the monthly number a mortgage calculator leaves out, from the tax roll, the MLS, Citizens and FEMA. Property facts only.
| Property tax | Current owners' bills run a median of $2,823/yr across 9 listings here (MLS tax records, 2026-10-24). Buy at today's median asking price of $420,212 and the first-year bill resets to about $5,700 with homestead (Clay County total millage 15.053 mills, FY2025-26, Clay County Property Appraiser, FY2025-26 adopted budget); municipal and district millage vary within the county. |
|---|---|
| HOA dues | Median $479/year (about $40/month) across 13 MLS listings (most billed annually; 2026-10-24). Dues cover what the documents say they cover; ask for the budget and reserve study. |
| Home and flood insurance | The average Citizens Property Insurance premium in Clay County is $1,189/yr (606 policies, Citizens detail by county, April 2026); private-market quotes depend on roof age, wind mitigation and construction. Flood: of 35 listing addresses checked against the FEMA flood map, 89% sit outside the high-risk zone and 11% inside one, where flood insurance is required with a federally backed mortgage. Statewide, a Zone X flood policy runs about $500-$700/yr and a high-risk zone $1,200-$2,500/yr (FEMA Risk Rating 2.0 averages, not quotes). |
| Roof and age | Median build year 2026 across 12 listings. Newer roofs and current wind-mitigation features usually mean the lower end of insurance quotes. |
Estimated carrying cost at the median asking price, before the mortgage: about $614/month (tax $475, HOA $40, insurance $99). An estimate from the sources above, not a quote.
Email me new listings in Amberly
One e-mail a day, only when a home lists here, with price, beds, baths and a link to every listing. Straight from the MLS feed; no account needed.
Ask an agent about Amberly
Have a question about the homes, fees, rules or commute here? A Momentum agent who works Amberly will answer, and the answer is published on this page for the next buyer.
Frequently Asked Questions
What is the median home price in Amberly?
How long do homes in Amberly take to sell?
Is Amberly a buyer's or seller's market right now?
What share of Amberly is owner-occupied?
Who is the best real estate agent for Amberly?
How do I find a top Green Cove Springs real estate agent who knows Amberly?
Can Momentum Realty connect me with an agent for Amberly?
Where is Amberly, and what county is it in?
How far is Amberly from downtown Jacksonville and the beach?
Is Amberly in a flood zone?
Is Amberly a good place to live?
Should you buy in Amberly?
An honest fit check. We will tell you when it is not your community.
Data sources & freshness
| Live listings | realMLS, refreshed twice daily (last: October 23, 2026) |
| Community market stats | realMLS closed sales, 12-month windows ending October 23, 2026 |
| Housing stock & ownership | Florida DOR assessment roll (street-list match (2 streets, ZIP 32043)) |
| Under-contract shares | realMLS records, as of 2026-10-20 |
| Historical depth | Closed-sale records back to 2025 (48 transactions analyzed) |
Verify the primary sources yourself: Florida DOR · U.S. Census · FEMA flood maps · Citizens Property Insurance.
Momentum Research figures are our own analysis of realMLS records; MLS data is deemed reliable but not guaranteed. Methodology: how Momentum market scores are computed. Market metrics describe homes for sale and recent sales, not residents.
Own a home here?
You just read the data. Now see what your home is worth.
The numbers on this page move markets in the aggregate. The number that matters to you is what a buyer pays for your address. Momentum sells for 1.25% above the realMLS member average and 8 days faster, and we’ll price yours against live local comps.
Looking to buy here? Search homes for sale →
What’s your home worth in your area?
A real valuation with real comps from a local listing agent, not an instant algorithm. Response within one business day.
See how Amberly fits the bigger picture — live prices, inventory, and Momentum Scores:
Nearby Communities
Explore more neighborhoods near Amberly with Momentum Realty’s local guides.