
Data Analysis
Buyers who purchased a Florida home in 2023 and have already resold lost money 55.5 percent of the time once an 8 percent round trip in buying and selling costs is counted, the highest share for any purchase year since 2007, a Momentum Research match of 2,329,694 repeat sales found.
In St. Johns County 70.6% of 2022-2023 buyers who resold came out behind; Flagler 70.3%, Clay 55.3%, Duval 52.9%. Only 2006 buyers did worse, at 85.8%.
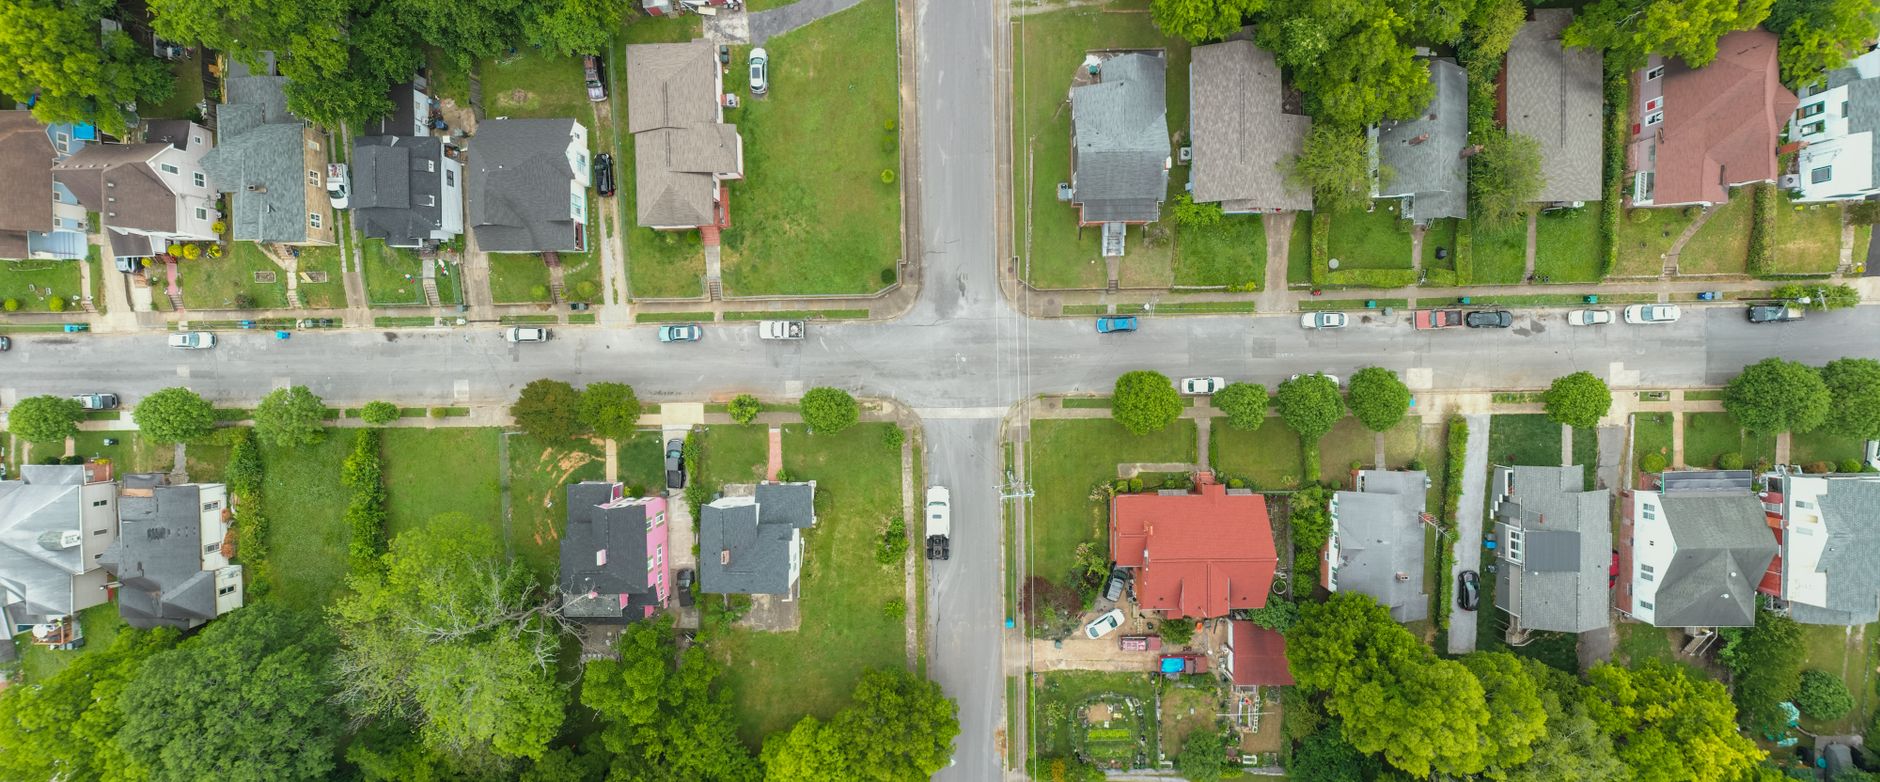
Momentum Research matched every Florida closing in its licensed MLS archives to that property's own earlier sale, by county and parcel number, and asked one question of each pair: after paying the costs of buying and later selling, did the owner get their money back? Across 2,329,694 pairs going back to 2004, the answer for people who bought in 2023 is no more often than yes.
The number
Of the 37,227 homes bought in 2023 that have already resold, 55.5 percent netted less than the owner paid, using an 8 percent allowance for the round trip of closing costs, commissions and transfer taxes. Before costs, 28.7 percent sold for a lower gross price than they were bought for. The 2022 cohort is close behind at 48.9 percent after costs, and 2024 buyers who have resold so far sit at 52.8 percent, though that year is still filling in.
That makes 2023 the worst purchase year in the series since 2007, when 76.0 percent of buyers who resold lost money. Only 2006, the top of the last cycle, was worse at 85.8 percent.
| Purchase year | Resale pairs | Lost money after 8% costs | Sold below purchase price |
|---|---|---|---|
| 2005 | 137,137 | 76.0% | 69.8% |
| 2006 | 129,350 | 85.8% | 81.4% |
| 2007 | 87,111 | 76.0% | 68.8% |
| 2008 | 75,653 | 43.6% | 33.2% |
| 2012 | 129,981 | 4.9% | 1.6% |
| 2019 | 106,381 | 8.2% | 2.0% |
| 2020 | 92,716 | 4.4% | 1.2% |
| 2021 | 97,026 | 12.8% | 4.3% |
| 2022 | 63,986 | 48.9% | 24.7% |
| 2023 | 37,227 | 55.5% | 28.7% |
The figures describe people who have already sold. An owner who bought in 2023 and is still in the house is not in this table, and most of them are. The share is a report on the exits so far, not a forecast for everyone who bought that year.
Where the 2022-2023 buyers lost most often
Northeast Florida's growth counties lead the list. St. Johns and Flagler are the only counties where more than 7 in 10 resales by 2022-2023 buyers came out behind after costs.
| County | Resale pairs (2022-23 buyers) | Lost money after costs | Sold below purchase price |
|---|---|---|---|
| St. Johns | 1,954 | 70.6% | 39.2% |
| Flagler | 1,023 | 70.3% | 39.0% |
| Charlotte | 1,672 | 66.4% | 50.2% |
| Osceola | 2,853 | 66.1% | 39.9% |
| Sarasota | 3,556 | 64.9% | 46.0% |
| Manatee | 3,120 | 64.0% | 42.7% |
| Sumter | 586 | 63.3% | 37.5% |
| Walton | 1,154 | 61.2% | 34.5% |
| Indian River | 382 | 60.2% | 34.6% |
| St. Lucie | 2,022 | 59.4% | 31.3% |
| Polk | 4,127 | 58.8% | 31.5% |
| Lake | 2,340 | 58.4% | 25.3% |
At the other end, the large coastal counties in South Florida held up best.
| County | Resale pairs (2022-23 buyers) | Lost money after costs | Sold below purchase price |
|---|---|---|---|
| Putnam | 327 | 26.0% | 10.4% |
| Miami-Dade | 8,547 | 31.7% | 12.5% |
| Broward | 9,847 | 42.0% | 19.0% |
| Palm Beach | 9,979 | 43.3% | 21.3% |
| Orange | 5,221 | 47.8% | 18.0% |
Statewide, the 2022-2023 cohort has 101,213 resales on record so far and 51.3 percent of them lost money after costs.
Why St. Johns: new construction
Part of the St. Johns and Osceola numbers is what those buyers bought. Newer homes resold at a loss far more often than older ones across the whole 2022-2023 cohort.
| Home age at purchase | Share of 2022-23 resales | Lost money after costs |
|---|---|---|
| Built 2020 or later | 13.0% | 65.7% |
| Built 2010 to 2019 | 8.8% | 73.5% |
| Built 2000 to 2009 | 17.0% | 60.3% |
| Built before 2000 | 61.2% | 42.6% |
If St. Johns had the statewide mix of home ages instead of its own (38.3 percent of its 2022-2023 resales were homes built in 2020 or later), its loss share would be about 60.8 percent instead of 70.6 percent; the mix explains roughly 9.8 points of the gap. Osceola shows the same pattern, 9.3 points explained by mix. This is an association, not a cause: a home built in 2020 or later is a proxy for buying new, and new subdivisions also carry CDD assessments and different insurance costs that this analysis does not separate. What it does say is that the resale market for a two- or three-year-old house in a subdivision where the builder is still selling is a hard place to recover an 8 percent round trip.
Time in the house
Holding longer helps, but not quickly. Among all pairs in the series, owners who sold within a year of buying lost money 28.0 percent of the time; at four years the share is 24.1 percent. For the 2023 cohort specifically, every resale so far is by definition a short hold, which is part of why its number is high and why it will move as the rest of that year's buyers sell over a longer horizon.
| Years held | Resale pairs (all years) | Lost money after costs |
|---|---|---|
| 0 | 223,582 | 22.1% |
| 1 | 236,509 | 28.0% |
| 2 | 276,546 | 26.1% |
| 3 | 261,874 | 25.6% |
| 4 | 231,622 | 24.1% |
| 5 | 197,812 | 23.9% |
What this means for a buyer or seller in Northeast Florida
A buyer closing this fall in St. Johns or Clay should plan on staying long enough for appreciation to cover the round trip, which at 8 percent of price is not a two-year proposition in a flat market. A seller who bought in 2022 or 2023 should price against the closings on their own street rather than the purchase price, because the buyers deciding on that house are looking at the same data. Momentum's community pages carry the sold history by subdivision and the county tax and insurance figures that shape the carry.
How we did this
Every closed sale in Momentum Realty's licensed MLS archives across eight Florida feeds was matched to the previous recorded sale of the same parcel in the same county. A pair counts as a loss after costs when the resale price times 0.92 is below the earlier purchase price. Pairs are grouped by the year of the earlier purchase. Feed coverage before 2004 is uneven, so the series starts there. The 2024 and 2025 cohorts are incomplete because most of those buyers have not sold. County rows with fewer than 500 pairs are not shown. Full series, county table and hold-length curve: Florida resale loss history.
People also ask
Was 2023 the worst year to buy a house in Florida? By this measure, yes, for the buyers who have already resold: 55.5 percent lost money after an 8 percent allowance for costs, the highest share since 2007's 76.0 percent and second only to 2006's 85.8 percent in the series.
Which Florida counties had the most 2023 buyers lose money on resale? St. Johns (70.6 percent) and Flagler (70.3 percent) lead the 2022-2023 cohort, followed by Charlotte, Osceola, Sarasota and Manatee. Miami-Dade, Broward and Palm Beach had the lowest loss shares.
Does this mean home values fell? Not necessarily. The measure counts the owner's own round trip, including about 8 percent in buying and selling costs. A home can resell slightly above its purchase price and still be a loss after costs. The gross column in each table shows the share that sold below the purchase price outright.
Sources
- Momentum Research analysis of licensed MLS closed-sale archives, eight Florida feeds, matched by county and parcel; data as of 2026-08-29.
- Full dataset and method: Florida resale loss history
- Coverage: News4Jax, September 7, 2026
Disclosure: Jon Brooks is a co-founder of Momentum Realty, a Florida real estate brokerage that owns and funds Florida Housing Intelligence. Momentum has a financial interest in Florida real estate transactions, including in markets named here. See our editorial standards.
Market statistics in this article are computed from MLS data licensed by Momentum Realty, and are current as of the date shown. Data may be preliminary and subject to revision by its source. This article is general information, not advice about any specific property, transaction, or financial decision, and is not a representation about any specific property, community, builder, or association.
Equal Housing Opportunity. Editorial standards · Corrections · About