
How to Find the Best Real Estate Agent in Lighthouse Shores, Ponce Inlet
Buying here? See Lighthouse Shores homes for sale and the Lighthouse Shores community guide (Oak Hill).
In Lighthouse Shores: Top Realtors & Agents, recent sales run a median of about $645,000 ($415/sq ft), typically closing in about 245 days — so accurate local pricing and comparable-sales knowledge are what separate a strong Lighthouse Shores: Top Realtors & Agents agent from an average one.
Lighthouse Shores recorded 7 closings in the last 12 months at a median of $645,000, averaging 245 days on market — the numbers any agent you interview here should already know. This guide covers how to find the top realtors in Lighthouse Shores, what makes a great Lighthouse Shores real estate agent, the questions to ask before you hire, the current Lighthouse Shores market in detail, and how to connect with a proven local expert. See the Lighthouse Shores neighborhood guide for homes and lifestyle.
Top realtors in Lighthouse Shores: what “top Lighthouse Shores real estate agents” actually means
The best Lighthouse Shores agents share four things: local sales experience (they’ve actually closed deals here), pricing accuracy built on real comps, marketing that reaches the right buyers, and negotiation that protects your money. In Lighthouse Shores, homes can take time to sell (a median of 245 days on market), so marketing reach and negotiation make the difference, and values have softened about 17% over the past year, so a disciplined pricing strategy is key.
That local nuance is why a Lighthouse Shores specialist beats a generalist: they know the streets, the HOAs, the school zones, and what buyers here will and won’t pay for. New to the process? Start with what a real estate agent actually does.
Recent market activity in Lighthouse Shores
A great agent works from data, not guesswork. Here’s the current snapshot for Lighthouse Shores (from Momentum’s MLS data, as of 2026-10-01):
Market read: Buyer's Market. Use these numbers to pressure-test any agent you interview — a true local will know them cold.
Recent sales in Lighthouse Shores
Real homes recently closed in Lighthouse Shores — the kind of comps a great local agent prices from:
| Address | Details | Sold |
|---|---|---|
| 66 Beverly Hills Avenue | 3 bd / 2 ba · 1,412 sqft · closed 2026-09-15 | $524,000 |
| 4707 S Atlantic Avenue | 3 bd / 2 ba · 2,274 sqft · closed 2026-06-30 | $1.80M |
| 4748 Riverglen Boulevard | 2 bd / 2.5 ba · 1,540 sqft · closed 2026-06-15 | $639,000 |
| 4727 Riverglen Boulevard | 3 bd / 3.5 ba · 3,663 sqft · closed 2026-06-05 | $1.12M |
| 4748 Dixie Drive | 3 bd / 2 ba · 1,811 sqft · closed 2026-06-04 | $585,000 |
| 4719 Dixie Drive | 3 bd / 2.5 ba · 1,540 sqft · closed 2026-03-16 | $645,000 |
© 2026 Daytona Beach Area Association of REALTORS®, Inc. Recent closed sales shown for market context.
Where Lighthouse Shores sales actually landed, 2024–2026
Of the 30 recorded Lighthouse Shores closings since 2024, half landed between $537,475 and $682,500 (the middle two quartiles); the lowest recorded sale was $300,000 and the highest $4,550,000. If your home sits outside the middle band, the reason usually shows up in the size table below before it shows up in condition.
| Sold price band | Share of closings | Sales |
|---|---|---|
| Under $350,000 | 4 (13%) | |
| $350,000 – $600,000 | 11 (37%) | |
| $600,000 – $850,000 | 9 (30%) | |
| $850,000 – $1,100,000 | 3 (10%) | |
| None and up | 3 (10%) |
What homes of your size have sold for in Lighthouse Shores
The same recorded closings, split into thirds by living area. Find the row your home falls in: the $/sqft figure times your square footage is the recorded-sales bracket for homes like yours here — a starting range from real closings, not a valuation of your specific property. Smaller homes here have been selling at a higher price per square foot than larger ones ($426 vs $346) — the usual pattern, since lot, kitchen and baths do not scale with floor area.
| Size group | Median $/sqft | Median sold | Sold range | Sales |
|---|---|---|---|---|
| Smaller homes 984–1,412 sq ft | $426 | $511,650 | $315,000 – $600,000 | 10 |
| Mid-size homes 1,516–1,811 sq ft | $383 | $622,450 | $300,000 – $695,000 | 10 |
| Larger homes 1,845–5,242 sq ft | $346 | $922,500 | $340,000 – $4,550,000 | 10 |
How Lighthouse Shores compares to its neighbors
Pricing a home means knowing the alternatives buyers are weighing. The five nearest tracked communities, side by side:
| Community | Median | $/sq ft | DOM | Momentum Score |
|---|---|---|---|---|
| Lighthouse Shores | $645,000 | $415 | 245 d | 32 |
| Tidewater Condo | $285,000 | $251 | – | 50 |
| Lighthouse Village | $610,000 | $401 | – | 50 |
| Calulantic | $1.20M | $286 | – | 50 |
| East Wind | $395,000 | $329 | 92 d | 47 |
| Ponce Harbour | $275,000 | $240 | – | 50 |
Momentum Score is Momentum Realty’s proprietary 0-100 community market rating. Figures from Momentum’s MLS data, as of 2026-10-01.
What is on the market in Lighthouse Shores right now
From the live MLS feed as of 2026-10-01: 9 active listings (plus 0 pending) asking from $479,500 to $884,900, median $740,000; 8 of 9 have been on the market over 60 days (median 170 days so far); the homes listed or recently sold were built between 1954 and 2024 (median 1988); 9 of the current listings state there is no HOA; none of the 16 geocoded listed or recently sold homes sits in a FEMA special flood hazard zone (median elevation 12 ft). For a seller this is the competition a buyer will tour alongside your home; for a buyer, the stale share is where negotiating room usually is. See the current Lighthouse Shores listings →
Which way this market is moving
Active inventory across Volusia County has fallen over the past year (-16%). About 28% of county listings currently carry a price cut, which tells you how much negotiating room the average seller has already conceded. Lighthouse Shores itself has appreciated about 186% over the period Momentum’s MLS data tracks — a community-level trend, not the county average. A strong local agent will reconcile these numbers with what is happening on your exact street before recommending a price.
What it costs to own in Lighthouse Shores
On a median-priced Lighthouse Shores home ($645,000), property taxes at Volusia County’s typical millage of 19.2141 run roughly $11,432 a year with the homestead exemption applied — before any CDD or special-district charges, which vary by community.
The average Citizens Property Insurance premium in Volusia County is about $1,807 a year (April 2026 filings); private-market quotes differ, and a good agent will tell you which carriers are actually writing here.
Run the real numbers before you commit: what selling nets you, whether your Save Our Homes benefit moves with you, and rent vs buy in Volusia County.
At Lighthouse Shores’s $645,000 median and Volusia County’s adopted 19.21 mills (FY2025-26), a home assessed at that price carries roughly $12,390 a year in property tax before exemptions, or about $11,560 with the full Florida homestead exemption — a buyer’s first-year figure; a long-time owner’s Save Our Homes cap can be far lower, which is one reason resale taxes jump at closing. Municipal and special-district millage varies inside the county; see the Volusia County tax page.
Rents and the investor math
Typical asking rent across Volusia County sits near $1,738 a month (Zillow’s rent index). Rents are moving about 1.2% year over year. County-level yield math pencils to roughly a 6.43% cap rate on typical numbers, before expenses. Home prices run about 4.88x the county’s median household income, the affordability backdrop every buyer here negotiates inside. If you are weighing an investment purchase in Lighthouse Shores, ask your agent for community-level rent comps rather than county averages — the spread between communities is wide.
Who is moving to Volusia County, and what they earn
The county gained a net 8,035 people in the latest IRS county-migration year. Households moving IN average $72,813 in income versus $57,215 for those moving out — movers arriving here earn more than those leaving, which shapes what sellers can ask and what buyers compete against. The biggest out-of-state feeder markets are NY, NJ, GA. Median household income in Volusia County has grown about 42% since 2018 ($66,581 now). Population is up about 8% over the same stretch. An agent who knows these flows can tell you which way demand in Lighthouse Shores is actually pointing, not just where prices have been.
Sources: IRS SOI county-to-county migration; U.S. Census income and population estimates. County-level data for context; community demand varies within the county.
School context you can verify: the Volusia County school district earned a district grade of A from the Florida Department of Education (2025-26) and has held an A since 2025. Attendance zones vary by address, so confirm the zoned schools for any specific home with the district.
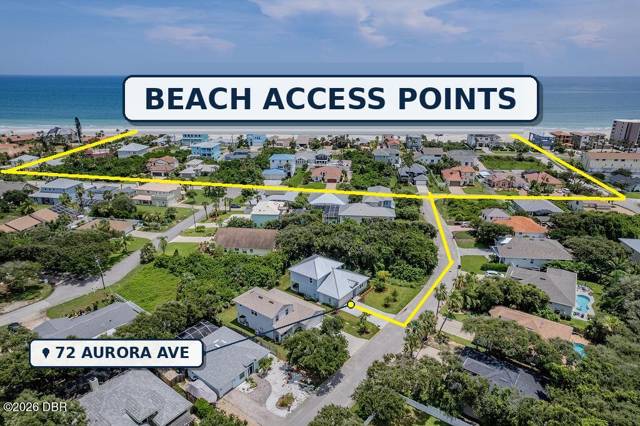
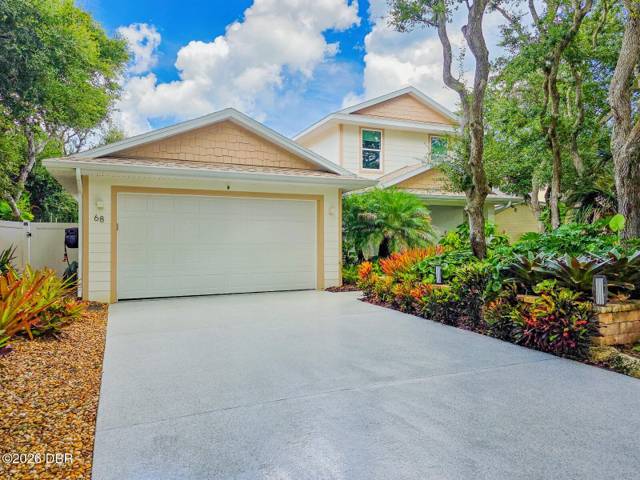
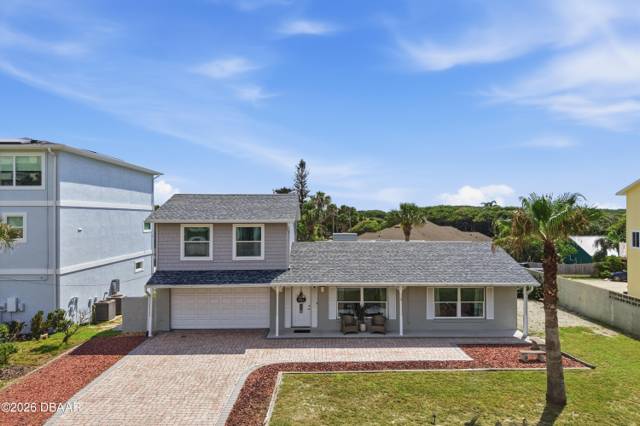
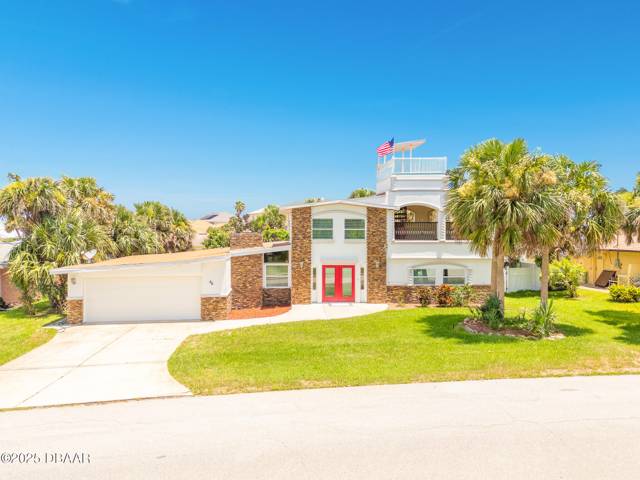
9 for sale — the inventory any agent you interview should already know street by street.
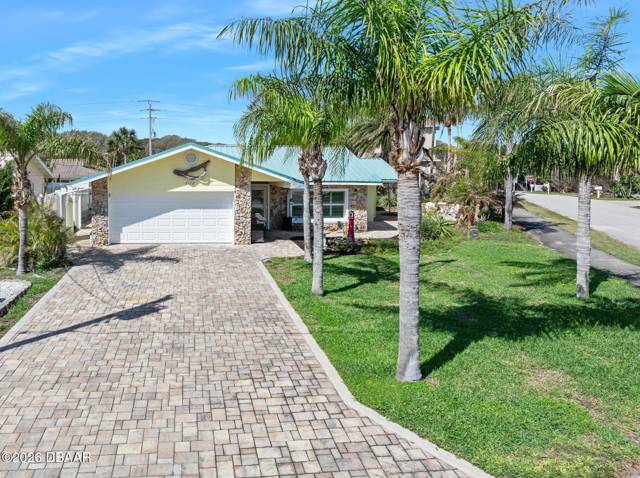
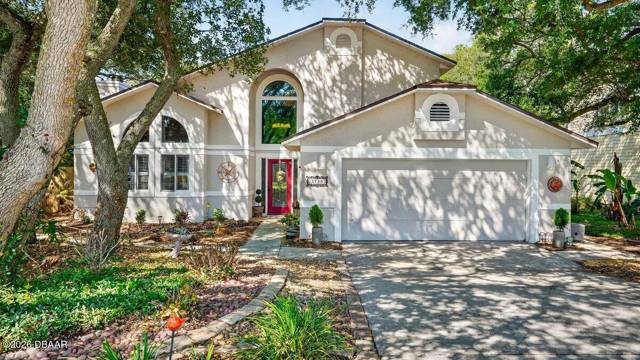
See every 2 listing, with full data ›
© 2026 Daytona Beach Area Association of REALTORS®, Inc. Deemed reliable but not guaranteed. Listings shown as of 2026-10-01; prices and availability change.
If you’re buying in Lighthouse Shores
Time is on your side in Lighthouse Shores right now. Tour aggressively, compare concessions — rate buydowns and credits often beat a small price cut — and let your agent use days-on-market as negotiating leverage. Every price cut on a listing is information.
If you’re selling in Lighthouse Shores
Selling into a slower Lighthouse Shores market means prep and pricing are the whole game. Interview agents on their marketing reach beyond the MLS, their plan for the first 14 days, and what they would do at day 45 if showings stall. The wrong list price costs more than any commission difference.
Questions to ask before you hire a Lighthouse Shores agent
- How many homes have you sold in or near Lighthouse Shores in the last year — the community recorded 7?
- How would you price my home against the $415 per square foot Lighthouse Shores closings have averaged — and the size-band table above?
- Homes here have been taking about 245 days to go under contract — what is your plan for the first two weeks?
- With about 15.4 months of supply in Lighthouse Shores, is this a market where you would advise me to negotiate or hold firm?
- How and how often will you communicate with me?
- Can you share recent client references?
Why community expertise matters in Lighthouse Shores
Inside Lighthouse Shores itself, recorded closings have run from $426 per square foot on the smaller homes to $346 on the larger ones — a gap of 23% that a community average hides. An agent who prices from the size table above, not the headline median, is the difference between a home that lingers and one that sells for more, faster.
Top listing agents vs. buyer’s agents in Lighthouse Shores
If you’re selling in Lighthouse Shores, a top listing agent’s pricing, staging, and marketing are what win top dollar — the same skills behind a strong home sale. If you’re buying, a sharp buyer’s agent protects you in negotiation and inspections. The best Lighthouse Shores Realtors do both well; ask any agent you interview which side they’re strongest on and how they’d handle yours.
Momentum’s record in Lighthouse Shores
Momentum Realty is a Northeast Florida brokerage; we do not list homes in Oak Hill ourselves. When you ask us for an agent here we match you with a vetted local agent from our referral network — one whose own closed sales are in Oak Hill — and we only get paid if you close, so the match has to be right. The market numbers on this page are what we would check that agent against.
Meet your local expert

Brittany co-founded Momentum Realty, a RealTrends 500 brokerage (ranked #440 in the U.S.) with 320+ agents and $3.5B+ in closed sales across Florida. Tell her what you’re looking for and she’ll connect you with the right local Momentum specialist — and make sure you’re taken care of from first call to closing.
“I have now worked with Brittany and the Brooks Group / Momentum Realty to both buy and sell a property over the past 3 years. I had an outstanding experience.” — A. Lloyd, Zillow
Related Lighthouse Shores resources
- Homes for sale & Lighthouse Shores neighborhood guide
- Volusia County real estate market
- Sell your Lighthouse Shores home with a local expert
- Volusia County homestead exemption
Common questions
How do I find the best real estate agent in Lighthouse Shores?
What questions should I ask a Lighthouse Shores agent before hiring them?
Does Momentum Realty cover Lighthouse Shores?
What happens after I ask to be matched?
What is the median home price in Lighthouse Shores?
Is Lighthouse Shores a buyer market or a seller market right now?
What should I budget beyond the mortgage in Lighthouse Shores?
What do homes of my size sell for in Lighthouse Shores?
Is Lighthouse Shores in a flood zone?
Does Lighthouse Shores have an HOA?
How much are property taxes in Lighthouse Shores?
Market figures are aggregates from Momentum Realty’s MLS data for Lighthouse Shores, as of 2026-10-01, and will change over time. This is general guidance on how to choose an agent, not a ranking or endorsement of any individual. Equal Housing Opportunity.