
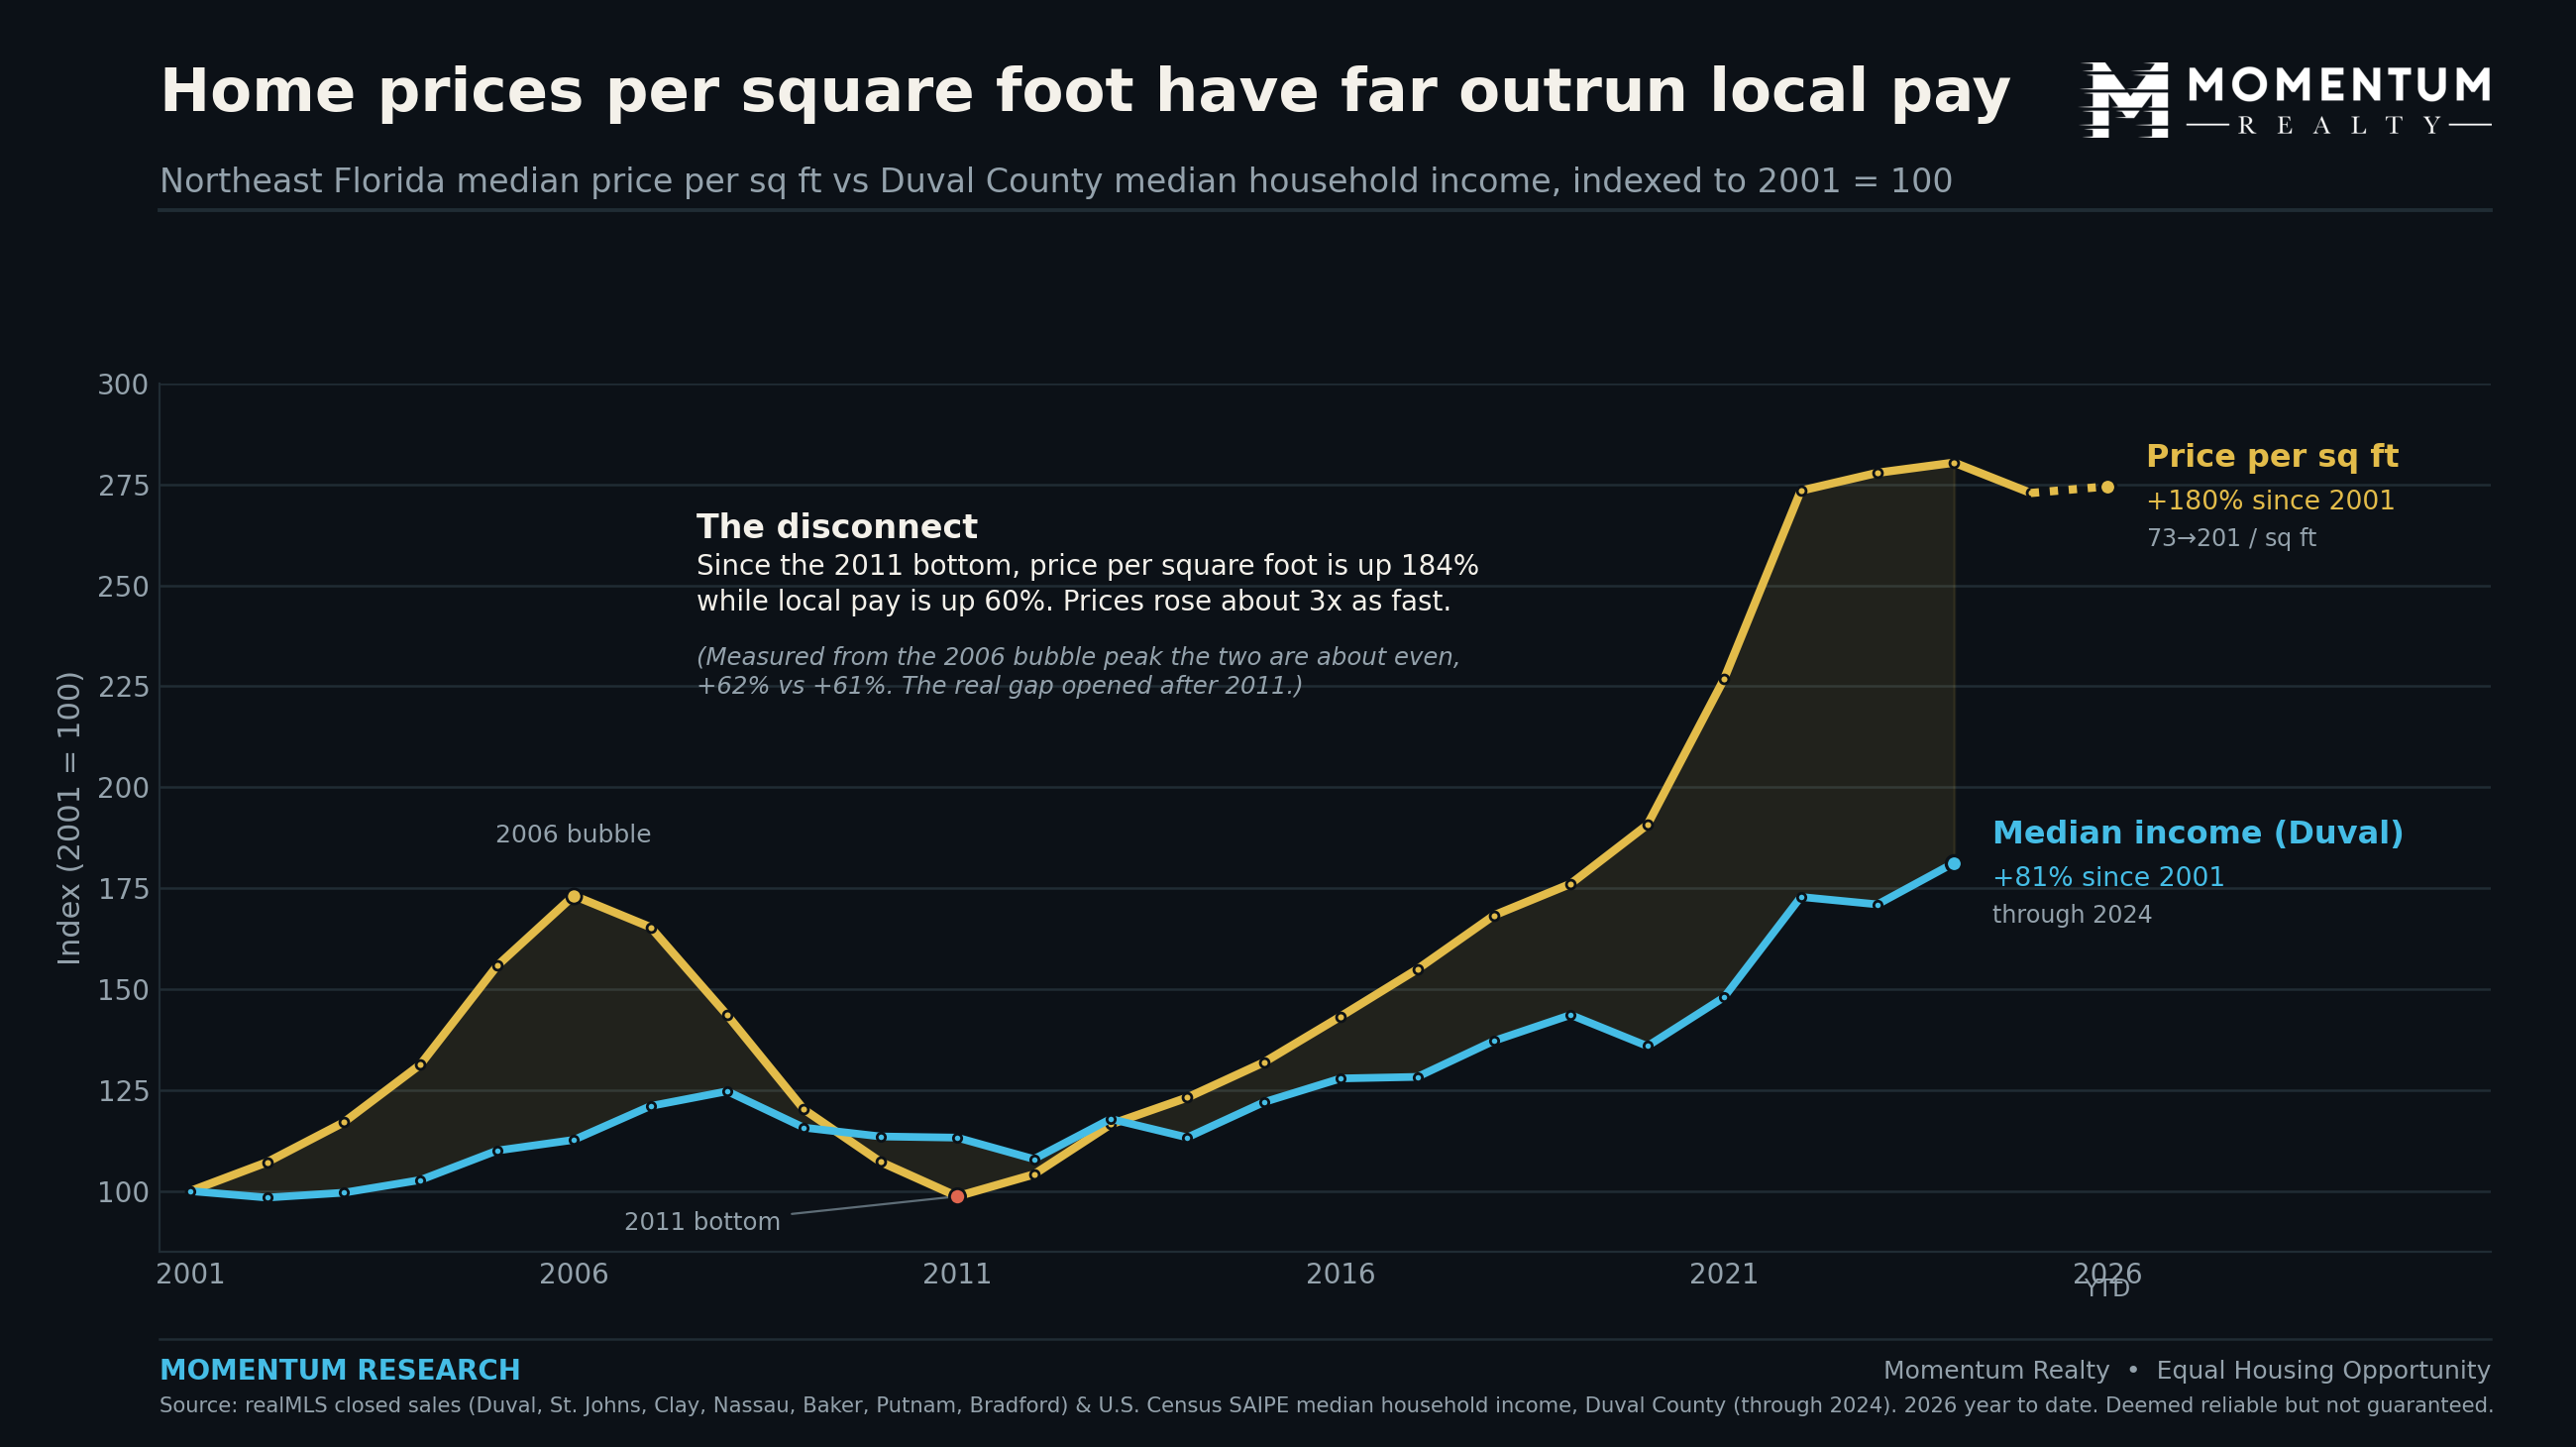
A useful way to track home prices over time is to strip out the size of the house and look at the price of a single square foot. It answers a cleaner question than the headline median price. Not what a home costs, but what the space inside it costs. In Northeast Florida that number reached a median of about $201 per square foot in 2026, up from $73 in 2001.
We pulled every closed sale back to 2001, divided each sale price by the living area, and took the median for each year. Measuring it the same way every year makes the 25 year arc easy to read.
The 25 year pattern
In 2001, a square foot of a typical Northeast Florida home sold for about $73. The mid 2000s boom nearly doubled that to a peak of $127 in 2006. Then the downturn erased the entire run. By 2011 the median was back to $72 per square foot, essentially where it started a decade earlier. A full round trip.
The recovery that followed was slower and, so far, more durable. Price per foot climbed steadily through the 2010s, passed its old 2006 peak around 2018, and reached $140 in 2020. The 2021 frenzy pushed it to $166, and in 2022 it crossed $200 for the first time. Since then it has held there: about $200 in 2022, $205 in 2024, and $201 in 2026. That is a plateau, not a reversal.
The same house, nearly three times the price
Here is what makes price per foot such a clean measure. The typical home that sold in 2001 had about 1,680 square feet of living area. In 2026 the typical home that sold had about 1,794 square feet. Barely changed. So almost none of the increase in price per foot comes from people buying bigger houses. It is the price of the space itself that roughly tripled, from $73 to $201 a foot.
That is different from the headline median price, which went from about $123,000 in 2001 to about $360,000 in 2026. Part of that jump can reflect a shift toward larger or newer homes. Price per square foot takes size off the table and isolates what a foot of Northeast Florida actually costs, which is the number that drives affordability.
Prices left wages behind
The affordability question is not just how fast prices rose, but how fast they rose next to what people earn. Indexed to 2001, price per square foot and Duval County median household income tracked each other through the 2000s and into the 2011 bottom. Then they split apart. Since the 2011 bottom, price per square foot is up about 184 percent while median household income is up about 60 percent, so home prices rose roughly three times as fast as pay. Over the full stretch since 2001, price per square foot is up about 180 percent against roughly 81 percent for income.
One honest caveat: measured from the 2006 bubble peak instead of the 2011 bottom, the two are close, price per square foot up about 62 percent and income about 61 percent. That is because 2006 prices were already inflated. The real gap opened after 2011, when prices climbed for more than a decade while incomes grew at their normal pace. Income figures are Duval County median household income from the U.S. Census Bureau Small Area Income and Poverty Estimates, the latest available through 2024.
The affordability crisis, and who can still pay
This gap is the affordability crisis, stated plainly. When price per square foot climbs 184 percent and local pay climbs 60 percent, the math stops working for a buyer earning a local wage. The home costs far more per foot than it used to, and the paycheck that has to cover it did not keep pace. That is why buying feels harder even though rates, not just prices, get most of the blame.
So who keeps clearing the market at these prices? Increasingly, buyers who bring purchasing power from somewhere more expensive. Jacksonville is one of the stronger relocation magnets in the country, pulling movers from higher cost metros like New York, Washington, Miami, and the California coast. Someone selling a house in one of those markets can land in Northeast Florida, pay $200 a foot, and still feel like they got a bargain. A local buyer on a local income is measuring that same $200 a foot against a Duval County paycheck, and it lands very differently.
That is the quiet shift underneath the numbers. As the price to pay gap widens, the buyer who sets the market price is more likely to be relocating in with outside equity, while the buyer squeezed out is more likely to already live here. It does not mean locals cannot buy. It means the market increasingly clears at a price anchored to out of market budgets, which is exactly what you would expect when local pay falls this far behind. For where movers actually come from, see our Jacksonville migration trends and the honest relocation guide.
Now add rates, and the math breaks
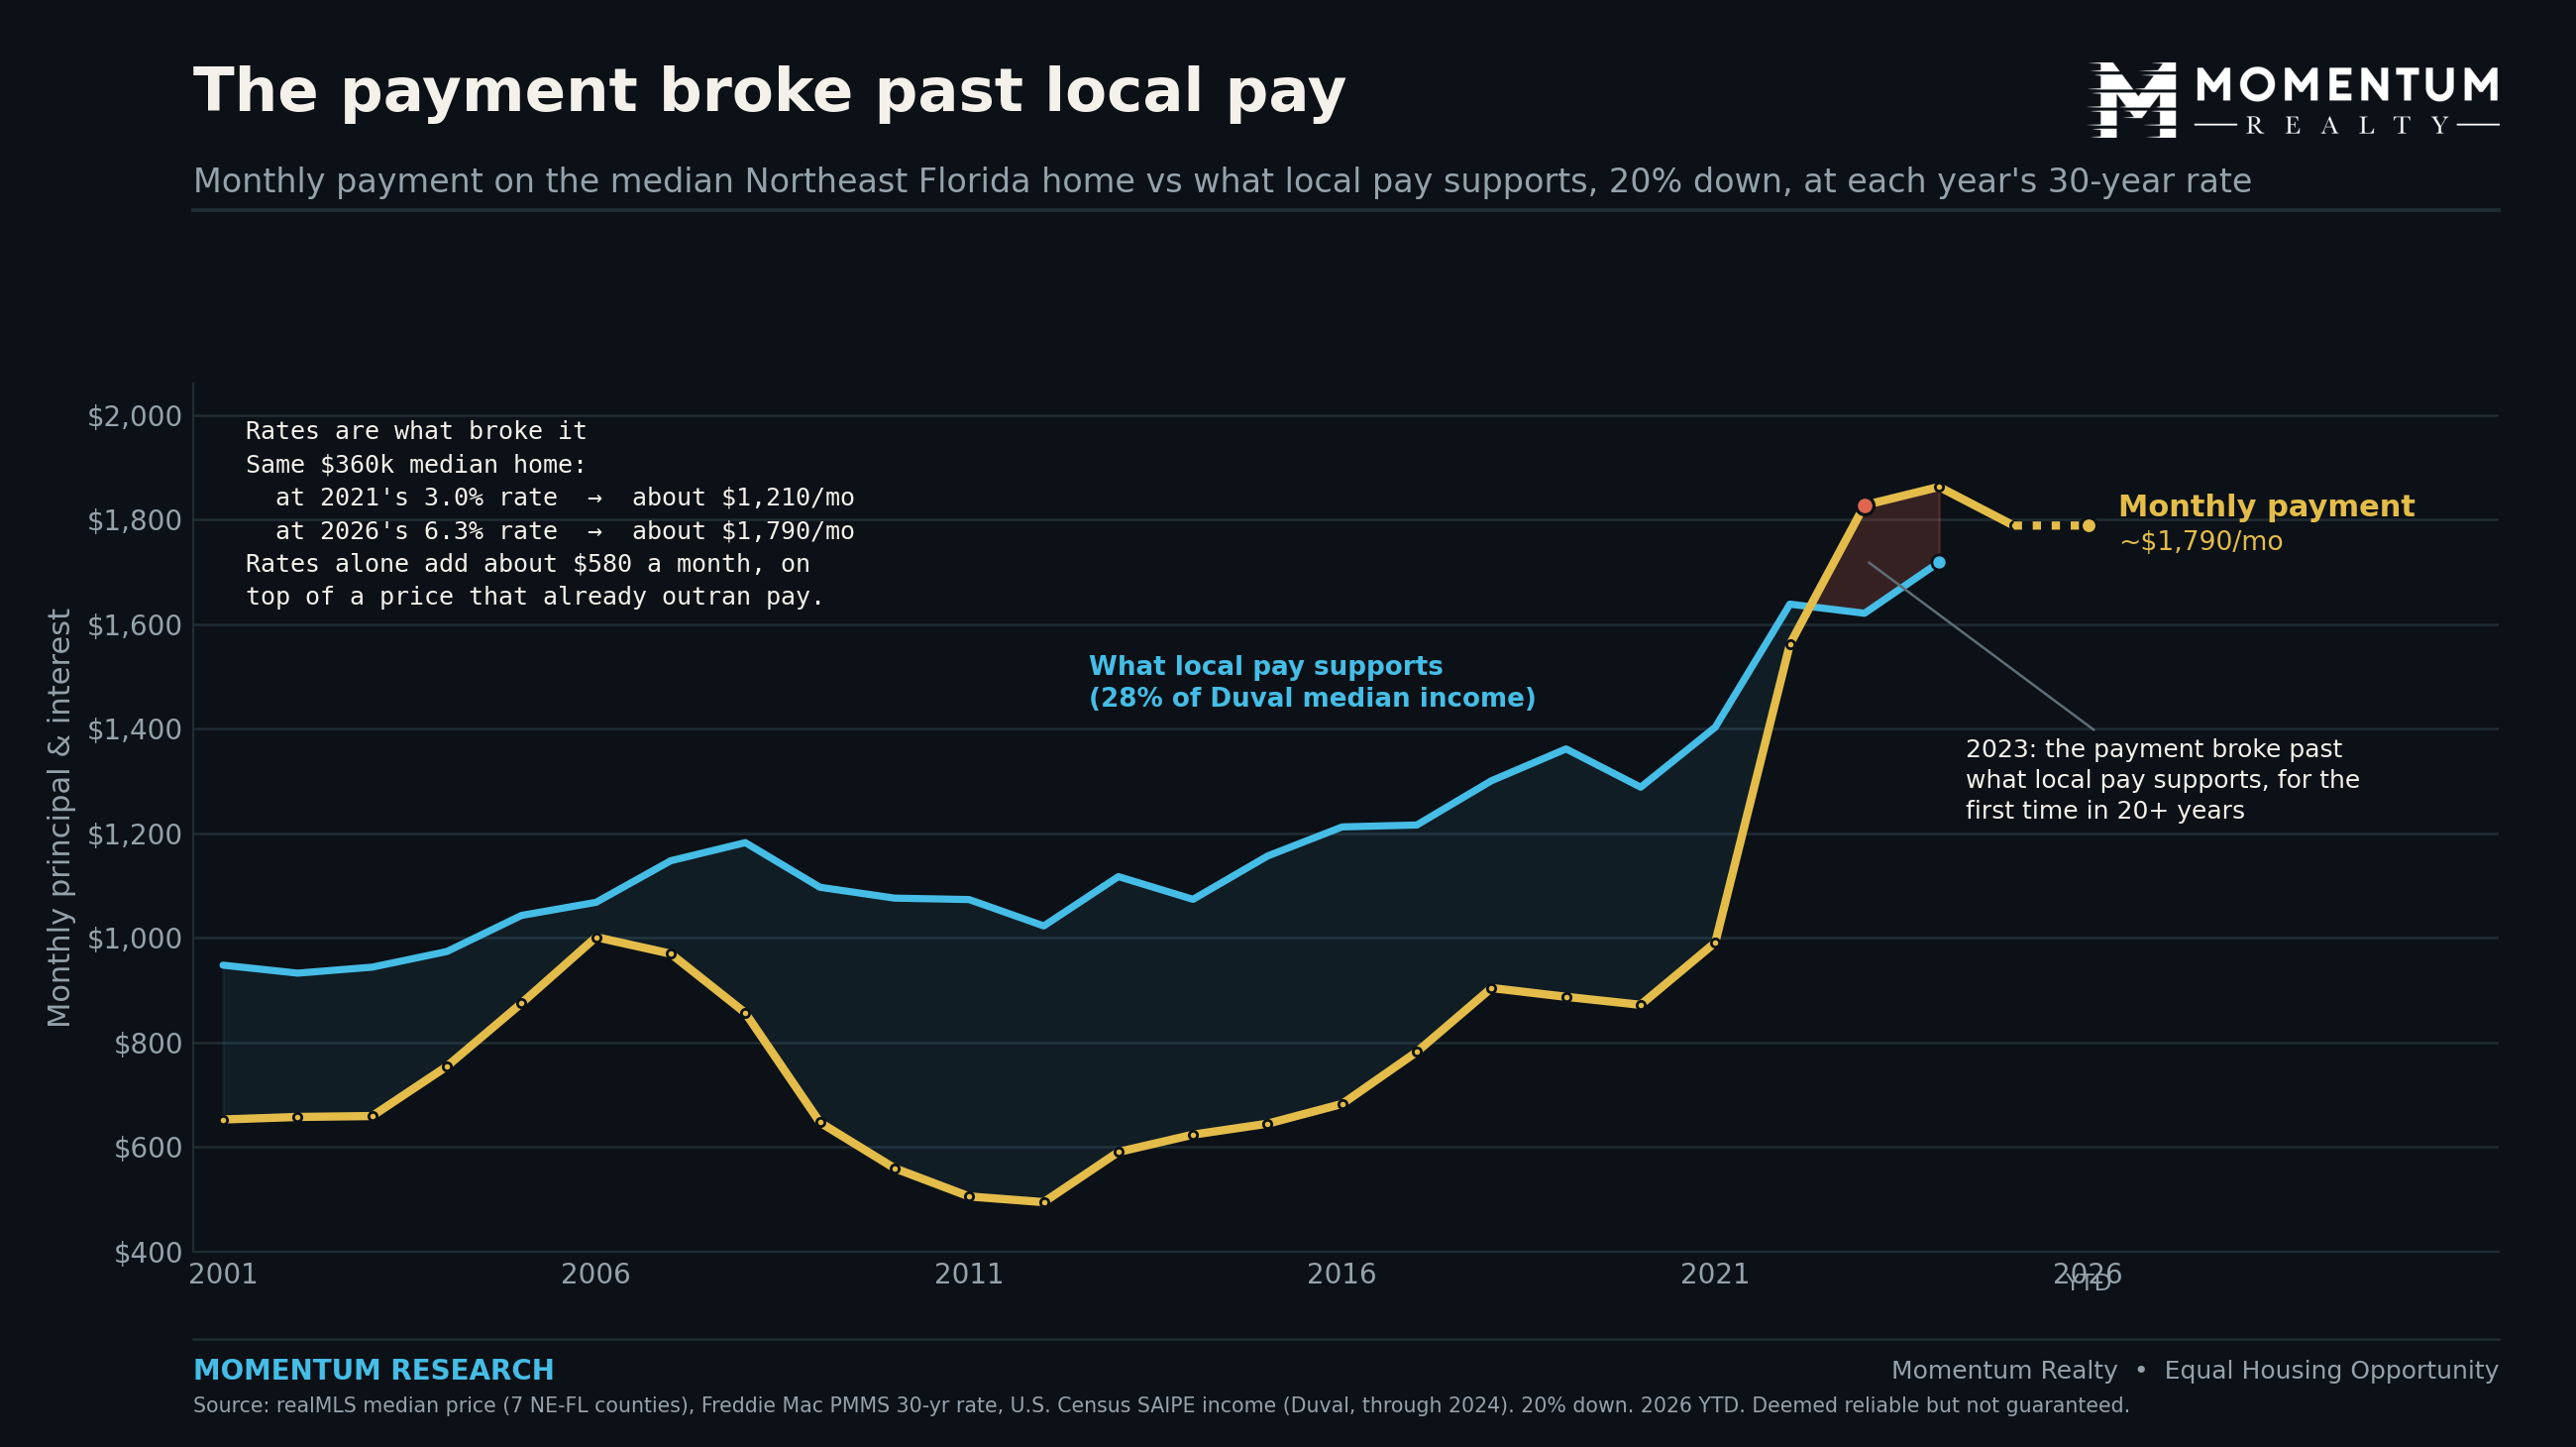
Prices outrunning wages is only half the squeeze. The other half is the mortgage rate, and when you stack the two together the monthly payment is where it actually breaks. The chart above is the monthly principal and interest on the median Northeast Florida home each year, 20 percent down, at that year's average 30 year rate.
Look at what low rates hid. In 2011 the median home ran about $505 a month. By 2021 prices had more than doubled to about $295,000, yet the payment was only about $990, because the rate had fallen to a record low near 3 percent. Cheap money absorbed the higher prices. Then rates snapped back. By 2026 the median home is about $360,000 at a rate around 6 percent, and the payment is about $1,790, roughly double the 2021 figure for a home that costs only about 22 percent more.
The cleanest way to see the rate layer is to hold the house still. Take today's $360,000 median home. At 2021's 3 percent rate the payment would be about $1,210 a month. At 2026's rate it is about $1,790. That is roughly $580 a month added by rates alone, on the exact same house, on top of a price that already outran local pay. Prices stretched affordability. Rates broke it. It is also why a rate buydown or a price adjustment moves a payment sensitive buyer more than almost anything else right now.
Set that payment against what local pay can carry and the break is even clearer. Hold the payment to about 28 percent of the median Duval County income, a common affordability line, and for more than twenty years the median home fit underneath it. In 2023, for the first time in our record, the payment crossed above it, and it has stayed there. That is the moment the median home stopped being affordable on the median local paycheck.
Why it matters if you are buying or selling
For buyers, price per foot is the fairest way to compare two homes of different sizes, or to weigh a new build against an existing home. A $400,000 listing at 2,000 square feet works out to $200 a foot, while a $360,000 listing at 1,600 square feet is $225 a foot. The cheaper sticker price is the more expensive home per foot. For sellers, it is a reality check on a list price. If comparable homes are trading near $200 a foot and yours is priced at $240, the market will notice. As we covered when Northeast Florida home sales stopped falling, the market is active again, but buyers are underwriting price carefully. For the full picture, see our Jacksonville housing market data hub.
How agents can use this data
With a buyer comparing two homes: put both on a price per foot basis. A lower asking price can hide a higher cost per foot once you account for size. It is the single fairest way to compare listings that are not the same size.
With a buyer worried about buying at the top: point to the plateau. Price per foot has held near $200 for four years rather than still climbing. The last time it ran up this fast, in 2006, it round-tripped all the way back. This run leveled off instead of spiking further.
With a seller setting a price: anchor the list price to the going rate per foot for comparable homes, backed by the trend line, rather than to what a neighbor happened to ask. The per-foot number is harder to argue with.
On social or with press: the chart carries it. One line: a square foot of Northeast Florida home costs about $201 today, up from $73 in 2001, for a house that is basically the same size.
Keep it about homes and the market, never about who lives where. Cite the source line below if you quote the numbers, and never present them as guaranteed.
People also ask
How much does a square foot cost in Northeast Florida?
In 2026 the median closed home sale in the realMLS footprint (Duval, St. Johns, Clay, Nassau, Baker, Putnam, and Bradford) traded at about $201 per square foot, up from about $73 in 2001, per Momentum Research analysis of realMLS closings.
Has price per square foot gone down in 2026?
No, it is roughly flat. Price per square foot plateaued near $200 to $205 after 2021: about $200 in 2022, $205 in 2024, and $201 in 2026. That is a plateau rather than a decline, per realMLS closing records.
Why has price per square foot risen so much?
The typical home that sold barely changed in size, about 1,680 square feet in 2001 versus about 1,794 in 2026, so the increase reflects the rising price of the space itself rather than buyers purchasing larger homes, per Momentum Research analysis of realMLS data.
The takeaway
Price per square foot cuts through the noise about home prices by holding size constant. In Northeast Florida it says the space itself costs about $201 a foot in 2026, nearly triple the $73 of 2001, for a home that is barely any larger. It also says the post 2021 market found a ceiling near $200 rather than continuing to climb or crashing the way the 2000s bubble did.
And it names the affordability crisis for what it is: prices that ran roughly three times as fast as local pay since 2011, a market that increasingly clears on purchasing power imported from higher cost metros, and local buyers doing the math against a local paycheck. For how buyers are paying for that space, see the financing mix behind these sales.
Data reflects closed sales in the realMLS footprint and is deemed reliable but not guaranteed. This is general information, not investment advice.
Momentum Research. Equal Housing Opportunity.
This article was compiled with the help of automated tools from realMLS closing records and may contain errors. Information is deemed reliable but not guaranteed. It is for general information only and is not financial, investment, legal, or tax advice. Verify all facts independently before relying on them. Source: Momentum Research analysis of realMLS closed sales, Duval, St. Johns, Clay, Nassau, Baker, Putnam, and Bradford counties, median price per square foot, 2001 to 2026. Household income: U.S. Census Bureau Small Area Income and Poverty Estimates (SAIPE), median household income, Duval County, through 2024.