
Almost every housing market in America runs on the same rough rule: the farther out you go, the less a home costs per square foot. You trade minutes for space. Northeast Florida does not work that way, and the size of the exception is larger than we expected.
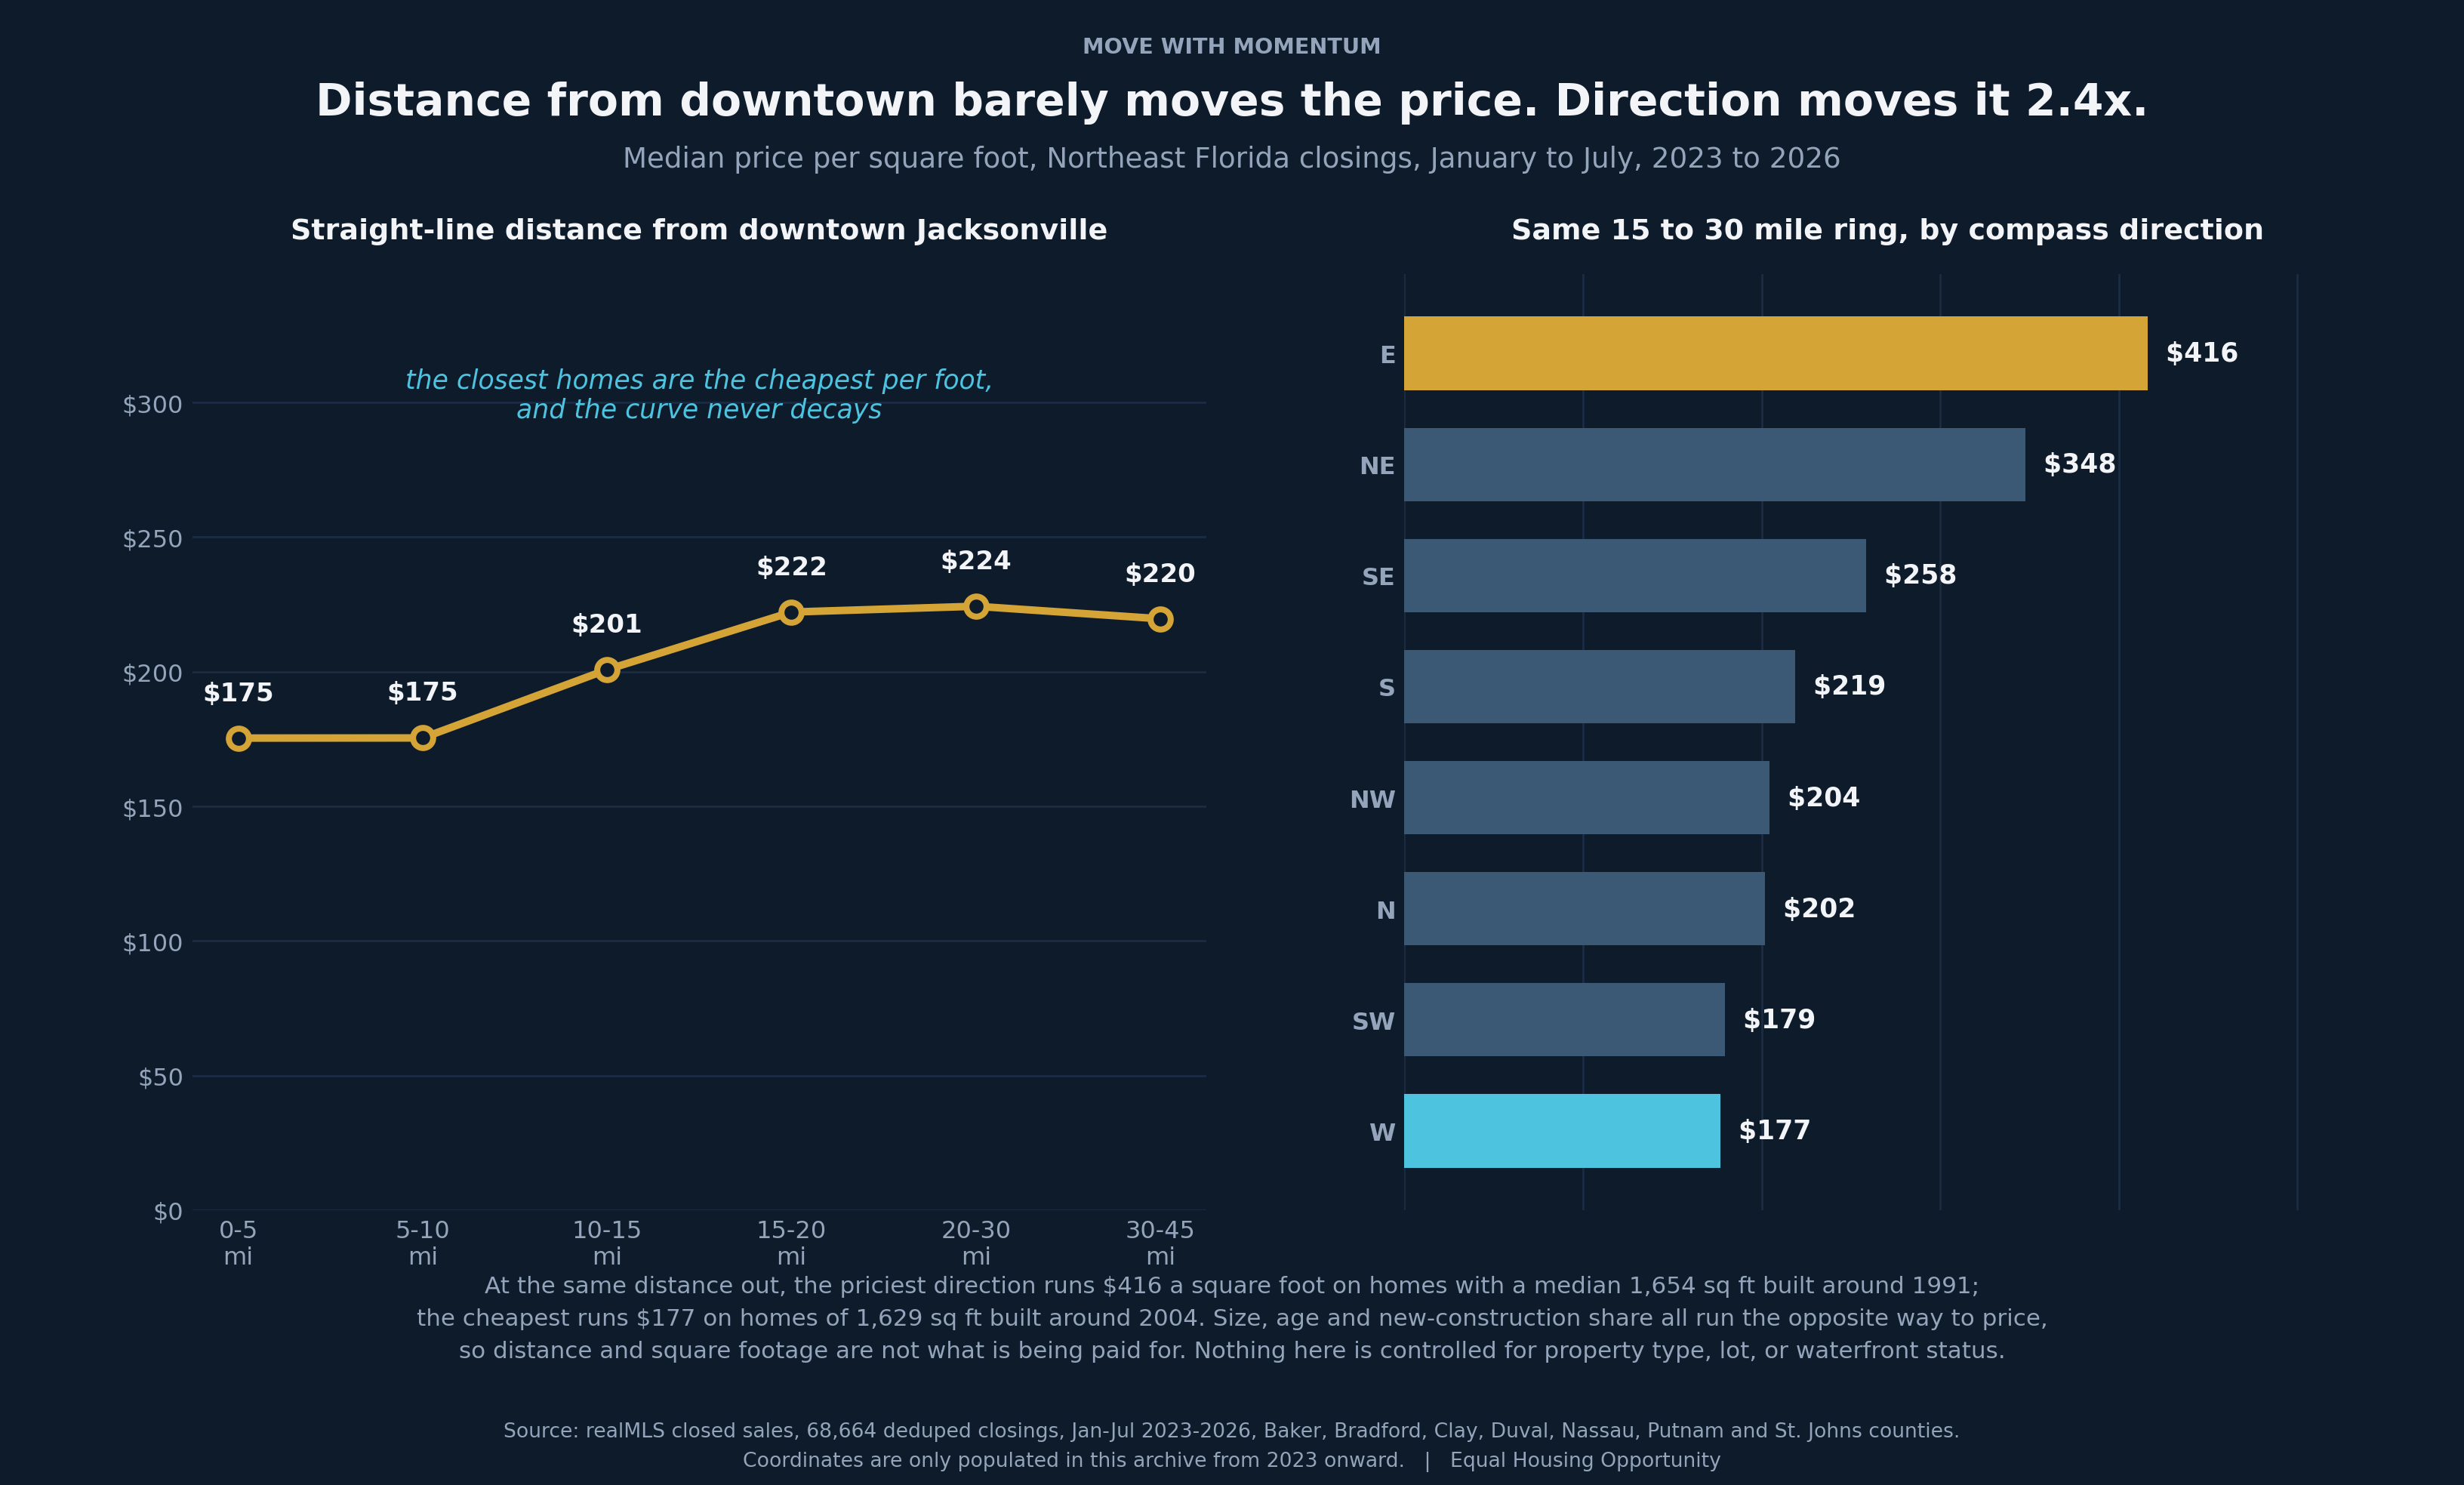
We measured the straight-line distance from downtown Jacksonville to every closed sale in the seven-county realMLS footprint that carried usable coordinates, then took the median price per square foot in each distance band. If the usual rule held, that line should slope down. It does the opposite, and then it flattens.
Six miles out and twenty-six miles out cost about the same
Inside five miles of downtown, the median closing ran $175 a square foot. From five to ten miles, also $175. Ten to fifteen, $201. Fifteen to twenty, $222. Twenty to thirty, $224. Thirty to forty-five, $220.
Read that as a curve and there is no decay in it anywhere. The nearest band is the cheapest per foot on the board, the figure rises through the middle distances, and then it simply stops moving. A home 26 miles from downtown and a home 16 miles from downtown carry, on the median, the same price per square foot.
The shape is not a one-year accident. Running the same bands separately for each year gives 2023 at $176, $177, $201, $217, $221, $227; 2024 at $181, $177, $206, $227, $230, $218; 2025 at $171, $175, $198, $224, $224, $213; and 2026 at $172, $172, $198, $222, $221, $221. Four years, same flat shape, no drift.
Point the same ruler in a different direction and the price more than doubles
So we held distance still. Take only the closings that fall in a 15 to 30 mile ring around downtown, 25,692 of them, and sort them by compass bearing instead. Every home in this group is roughly the same distance out. The medians:
East, $416 a square foot. Northeast, $348. Southeast, $258. South, $219. Northwest, $204. North, $202. Southwest, $179. West, $177.
That is a spread of about 2.4 times between the top and the bottom of a single ring. The east side of the ring is drawn from closings in Jacksonville Beach, Atlantic Beach and Ponte Vedra Beach; the west side from Macclenny, Glen St. Mary and Baldwin. Same drive-time band from the same downtown point, and the per-foot figure is not in the same universe.
This is also stable. East ran $404, $404, $428 and $428 across 2023, 2024, 2025 and 2026. West ran $169, $183, $178 and $178. The gap opens in every single year we can measure.
Everything that usually explains price runs backwards here
The obvious objection is that the expensive side must have bigger or newer homes. It does not. This is the part of the finding we found hardest to argue with.
At 15 to 30 miles out, the $416 group had a median 1,654 square feet, a median year built of 1991, and 6.4% of its closings flagged as new construction. The $177 group had a median 1,629 square feet, a median year built of 2004, and 18.5% new construction.
So the expensive side is marginally smaller, thirteen years older, and has roughly a third as much new construction. Every structural variable that normally pushes price per foot up is pointing the wrong way. Whatever the market is paying for out there, it is not floor area and it is not recent construction. The one physical difference that separates those two groups is the Atlantic coastline.
It is worth putting alongside our earlier finding that the regional median price per square foot has roughly tripled since 2001 while the median home barely changed size. The regional number is real, but it averages across a geography that is not remotely uniform.
What this does not prove
Nothing here is a controlled comparison, and we are not going to pretend otherwise.
Property type mix is not held constant, and that matters most on the east side, where attached and oceanfront-adjacent stock is a meaningful share of closings. Lot size is not in this dataset at all. Neither is waterfront status, which is very likely doing a large amount of the work in the east and northeast figures and which we simply cannot isolate. Straight-line distance is not drive time either, and in a city built around a river with a limited number of crossings, those two things come apart badly.
The window is also short. Latitude and longitude are only populated in our closed-sales archive from 2023 onward, which is the same field artifact we have flagged before on concession amounts and listing remarks. That gives four years, not the twenty-five we normally work with, so treat the levels as well measured and any trend claim as unavailable.
What survives all of that is narrow and, we think, solid: at equal distance from a fixed point, the per-foot figure varies by more than two times, and the structural variables we can measure do not explain it.
How agents can use this data
Stop pulling comparable sales on a radius. A one-mile or three-mile radius is the default in most tools, and in this market it will happily hand you a comparable sale from a bearing that trades at twice or half the subject property's per-foot figure. Constrain comps by corridor, municipality or county line before you constrain them by distance.
Re-frame the commute conversation. When a buyer says they will move farther out to get more house, the honest answer here is that distance alone will not do it. Moving from the east side of the ring to the south or southwest side will, and that is a direction conversation, not a mileage one. Show them the ring.
Set the per-foot expectation before the first showing. A buyer anchored on a regional average of roughly $200 a square foot is going to be shocked by an east-side list price and confused by a west-side one. Giving them the bearing-specific figure up front removes a whole category of wasted showings.
Use it when a seller cites a neighboring sale. Sellers reasonably point at recent nearby closings. If that closing sits on a different bearing, the per-foot comparison is not transferable, and this data gives you an objective, dated way to say so without making it personal. As always, cite the source and the date range rather than presenting the figure as your own opinion, and note that these are medians across many property types.
People also ask
Does living farther from downtown Jacksonville make a home cheaper?
Not in any reliable way. Across 68,664 Northeast Florida closings from January to July 2023 through 2026, the median price per square foot ran $175 within five miles of downtown and $220 at 30 to 45 miles out. The closest band was the cheapest per foot, and the figure never falls away with distance. Direction is the far stronger signal: at a fixed 15 to 30 mile ring the median ranged from $177 to $416 a square foot depending only on the compass bearing.
Why is price per square foot so different on opposite sides of the same ring?
The measurable differences run opposite to price. At 15 to 30 miles out, the $416 side had a median 1,654 square feet, a median build year of 1991 and 6.4% new construction. The $177 side had 1,629 square feet, a median build year of 2004 and 18.5% new construction. Smaller, older and less new construction on the expensive side means size, age and newness are not what is being paid for. The one physical feature that separates them is the Atlantic coastline.
Should I search for homes by radius or by area?
A radius filter treats every direction as equivalent, and in Northeast Florida it is not. Two homes the same distance from downtown can differ by more than two times per square foot, so a mile-radius search will mix budgets that have nothing to do with each other. Searching by corridor, county or municipality keeps the comparison meaningful. The same caution applies to any comparable sales pulled on a radius.
The takeaway
Miles from downtown is close to useless as a pricing signal in Northeast Florida. The compass bearing from downtown is one of the strongest signals in the dataset. If you are budgeting, searching, pricing or pulling comps on distance alone, you are using the weaker of the two variables, and the market has been consistent about that in every year we can measure.
It also sits oddly next to the other supply-side finding we published this month, that finished builder inventory sits about three times longer than resale. Both point the same way: the regional averages in this market are hiding more than they show.
Method and limits
Source is realMLS closed sales for Baker, Bradford, Clay, Duval, Nassau, Putnam and St. Johns counties, deduplicated on listing identifier plus close date. The window is fixed at January through July of each year, 2023 through 2026, so that the partial current year cannot manufacture a trend.
Records were required to carry latitude, longitude, close price and living area, to fall inside Northeast Florida geographic bounds, and to sit between 400 and 10,000 square feet and $25,000 and $5,000,000. That leaves 68,664 usable closings, of which 25,692 fall in the 15 to 30 mile ring.
Distance is great-circle distance from a fixed downtown Jacksonville reference point at 30.3322, -81.6557, and bearing is the initial great-circle bearing from that same point, binned into eight 45 degree octants. Distance bands require at least 100 closings and octants at least 200 to be reported. Coordinates are not populated in this archive before 2023, so no earlier comparison is possible.
Figures are medians, not averages, and nothing is controlled for property type, lot size, waterfront status or condition. Data provided by realMLS and deemed reliable but not guaranteed. Equal Housing Opportunity.