
Every seller arrives at the same fork. The comps say somewhere around four hundred thousand dollars. So is it $399,900, or is it $400,000?
Northeast Florida has quietly changed its answer over the last twenty-six years, and the change is large enough to see without any statistics at all. We took every resale closing in the seven realMLS counties, kept only those originally listed between $200,000 and $400,000, and sorted them by the shape of the first asking price. Holding the price band fixed matters here, because a rising market on its own would make round numbers more common; fixing the band takes that explanation off the table.
Half of resale sellers now land on a multiple of $5,000
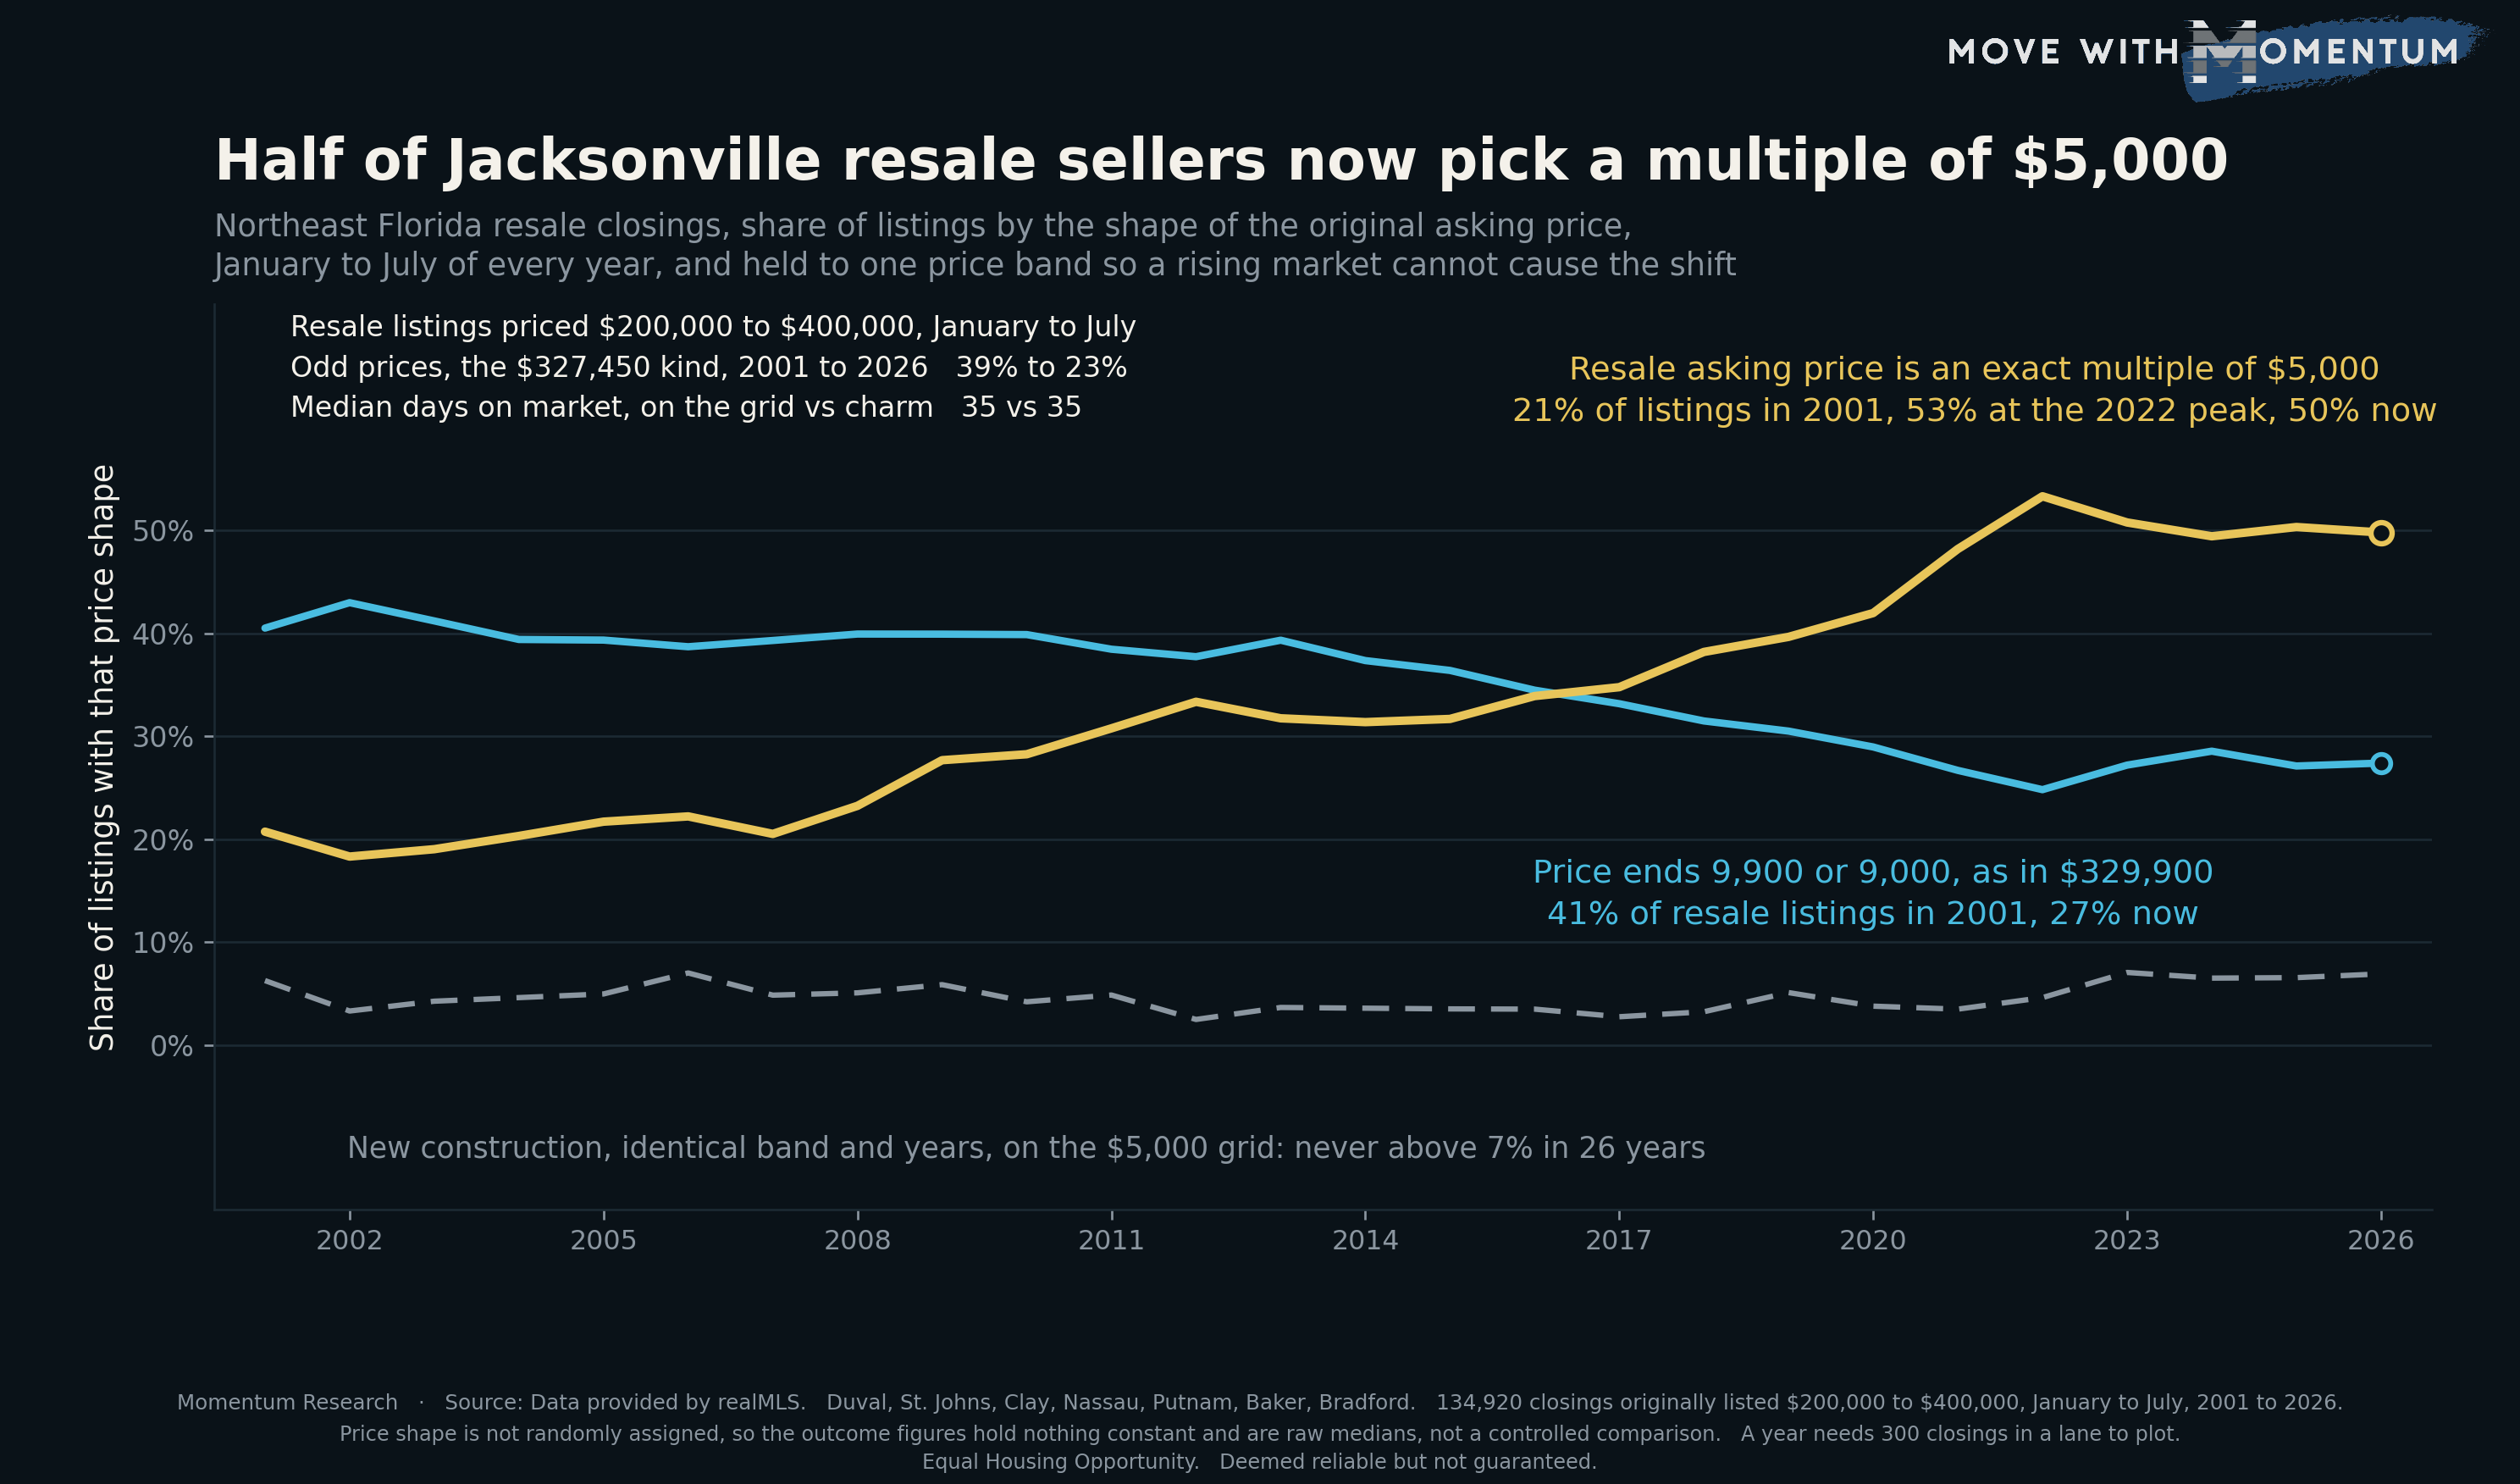
An asking price that is an exact multiple of $5,000 accounted for 20.7% of resale listings in that band in 2001. It reached 42.0% by 2020, peaked at 53.3% in 2022, and sits at 49.8% today. That is roughly two and a half times the 2001 share, inside a band that has not moved.
The detail underneath is that $5,000, not $10,000, is the real grid. Among 2026 resale listings in the band, the single most common ending was $X5,000 at 27.5%, ahead of $X0,000 at 22.3%. Sellers did not simply round harder; they converged on a finer, shared step.
The charm price used to be the default
The other half of the picture is what the grid replaced. A price ending 9,900 or 9,000, the $329,900 that every seller recognises, was the most common shape in this market for the first fifteen years of the record. It was 40.5% of resale listings in 2001 and stayed near 40% through 2011. It then fell every year to a low of 24.8% in 2022, and has recovered only slightly, to 27.4% now.
The third group fell furthest. Genuinely odd prices, the $327,450 kind that comes out of an appraisal or a per-square-foot calculation rather than a decision, went from 38.8% of listings to 22.8%. Sellers stopped publishing prices that look computed.
New construction never joined, and that is the control
This is the part that makes the finding hard to explain away. Run exactly the same measurement on new construction, in the identical price band, over the identical years, using the identical field, and there is no trend at all. Builder listings landed on the $5,000 grid between 2.5% and 7.0% of the time in every one of the twenty-six years, and they are at 6.9% today.
Builders price to a base plan plus lot premiums plus options, which produces numbers like $412,990. That mechanism has not changed, so the builder line is flat, and it is flat across precisely the period when the resale line more than doubled. Whatever moved resale sellers did not move the side of the market that prices by formula.
The frenzy is the inflection point
The resale line does not climb evenly. It is roughly flat from 2001 to 2008, drifts up through the 2010s, and then jumps: 42.0% in 2020, 48.2% in 2021, 53.3% in 2022. The steepest two years are the two years when homes in this market were going under contract in a median seventeen days.
Since then it has come back down a little and flattened, holding between 49% and 51% for four straight years. The charm price recovered about two and a half points over the same stretch. So the honest description is a step that has partly, but not fully, reversed, and not a trend still running. We have described a similar shape in per-foot pricing by home size, and the same caution applies: a level that moved once is not a direction.
The price shape did not change the outcome
The obvious question is whether any of it works. Across 2023 to 2026, in the same band and the same fixed window, the three price shapes produced results that are difficult to tell apart:
- Exact multiple of $5,000: median 35 days on market, closing at 96.4% of the original asking price.
- Ending 9,900 or 9,000: median 35 days, closing at 96.5%.
- Everything else: median 37 days, closing at 96.8%.
Two days and four tenths of a percentage point separate the extremes, on sample sizes of 11,159, 6,135 and 4,971 closings. The grid moved a long way. The result did not move with it.
That is a raw comparison and it holds nothing constant, which is the honest limit on it. Sellers do not pick a price shape at random, so the three groups differ on county, age, size and condition as well as on the ending. The finding is that there is no visible gap in the medians, not that the ending has been proven irrelevant.
Why the grid probably won
We can measure what sellers did. We cannot measure why from this data, so what follows is an explanation, not a finding.
The most commonly offered reason is search filters. Buyers on portals set a maximum price, and those controls move in fixed steps. A home asking $402,000 is invisible to every buyer whose ceiling is $400,000, while a home asking exactly $400,000 is the last one they see. That reasoning predicts bunching on the round thresholds rather than just below them, and bunching on the thresholds is what the ending distribution shows. It is consistent with the data. It is not demonstrated by it.
How agents can use this data
Four concrete uses, all of them about how homes are priced rather than about who lives anywhere:
- Retire the $X9,900 argument as a closing argument. If a seller wants $400,000 and you want $399,900, this data does not give either of you a market-time or price advantage to point at. Spend the meeting on the level instead of the ending, because the level is where the measurable difference lives.
- Check the price against the filter steps before you publish. Whatever number you land on, know which portal bracket it falls into. A price a few thousand dollars over a round threshold buys nothing and can cost visibility, and that is a decision worth making deliberately rather than by rounding habit.
- Read an odd asking price as information. Only about a fifth of resale listings still carry a computed-looking number. When one does, it often signals a price derived from an appraisal, a payoff figure or a per-foot calculation, which tells you something useful about how the seller got there before you ever call.
- Do not apply resale norms to builder inventory. Builders have priced on a different system for twenty-six years running. A $412,990 base price is not an opening position in the sense a resale asking price is, and reading it as one will mislead a buyer.
If you cite any of this with a client, cite it with the source and the date attached: Momentum Research analysis of realMLS closings, January to July 2001 through 2026, published August 29, 2026.
What this measurement does not do
Four limits, all of them load-bearing. First, the outcome comparison is uncontrolled, as described above. Second, this measures the original asking price only, so it says nothing about what happens after a price cut, which we have looked at separately in the context of market time. Third, the analysis is confined to one price band on purpose, and the shares would differ in a band where $5,000 is a larger or smaller fraction of the price. Fourth, OriginalListPrice is present on 99.2% or more of qualifying closings in every year of the record except 2003, where it is 78.3%; that single year should be read with more caution than the rest, and it is not near either end of the series.
People also ask
Should I list my house at $399,900 or $400,000 in Jacksonville?
Northeast Florida closings from 2023 through 2026 do not show a measurable difference. Resale homes listed at an exact multiple of $5,000 closed in a median 35 days at 96.4% of the original asking price; homes listed at a number ending 9,900 or 9,000 closed in a median 35 days at 96.5%. That is the same market time and less than half a percentage point of price. The comparison is not controlled for county, age, size or condition, so it is not proof that the ending does not matter, but there is no visible advantage in the raw medians either way.
What is the most common listing price ending in Jacksonville?
Among resale listings originally priced between $200,000 and $400,000 that closed January through July 2026, the most common ending was $X5,000 at 27.5% of listings, followed by $X0,000 at 22.3%, $X9,900 at 14.1% and $X9,000 at 13.3%. Together those four endings account for about 77% of resale asking prices in that band.
Do builders price new construction homes differently?
Yes, and the gap is large and long-running. Over the identical price band and the same 26 years, new construction listings landed on an exact multiple of $5,000 between 2.5% and 7.0% of the time in every single year, against about 50% for resale today. Builders typically price to a plan and a lot premium, which produces figures such as $412,990 rather than $410,000.
Method and limits
Source: data provided by realMLS. Closed residential sales in the authoritative counties of Duval, St. Johns, Clay, Nassau, Putnam, Baker and Bradford. Records are deduplicated on listing id plus close date. 134,920 closings whose original asking price fell between $200,000 and $400,000, across the fixed January to July window, 2001 through 2026.
Price shape is assigned from OriginalListPrice in a fixed priority order. A price that is an exact multiple of $5,000 is counted on the grid. Otherwise a price ending 9,000 or 9,900, where the thousands digit is a nine, is counted as a charm price. Everything else is counted as other. Each closing lands in exactly one category and none is double counted.
Every year uses the same January to July window, chosen because 2026-08-13 is the most recent close date in the current pull and July is therefore the last complete month. The unfixed calendar-year view was also run and the finding survives it. The band of $200,000 to $400,000 is held constant across all twenty-six years specifically so that price inflation cannot produce the shift; the all-price view was also run and moves in the same direction. A year needs 300 closings in a lane to be plotted.
Outcome figures cover 2023 through 2026 only. Days on market is the MLS field, clipped to 0 through 730. Close-to-original is close price divided by original list price. Both are reported as medians and neither is controlled for any property characteristic.
All figures on this page are per Momentum Research analysis of data provided by realMLS and are deemed reliable but not guaranteed. Equal Housing Opportunity.