
Everyone knows the housing market has a busy season. In Northeast Florida there are really two, and they land on almost opposite ends of the calendar. To show it, we pulled 25 years of closed sales across the six realMLS counties, Baker, Clay, Duval, Nassau, Putnam, and St. Johns, and laid every month from 2001 through 2026 into three heat maps: existing homes, new construction, and the whole market together.
Each cell is the raw number of closed sales that month, and the color compares that month to its own year's average, so green means a month ran above that year's pace and pink means below. That growth-neutral coloring lets a slow month in a busy year and a busy month in a slow year sit side by side and still be readable.
Existing homes: a June market
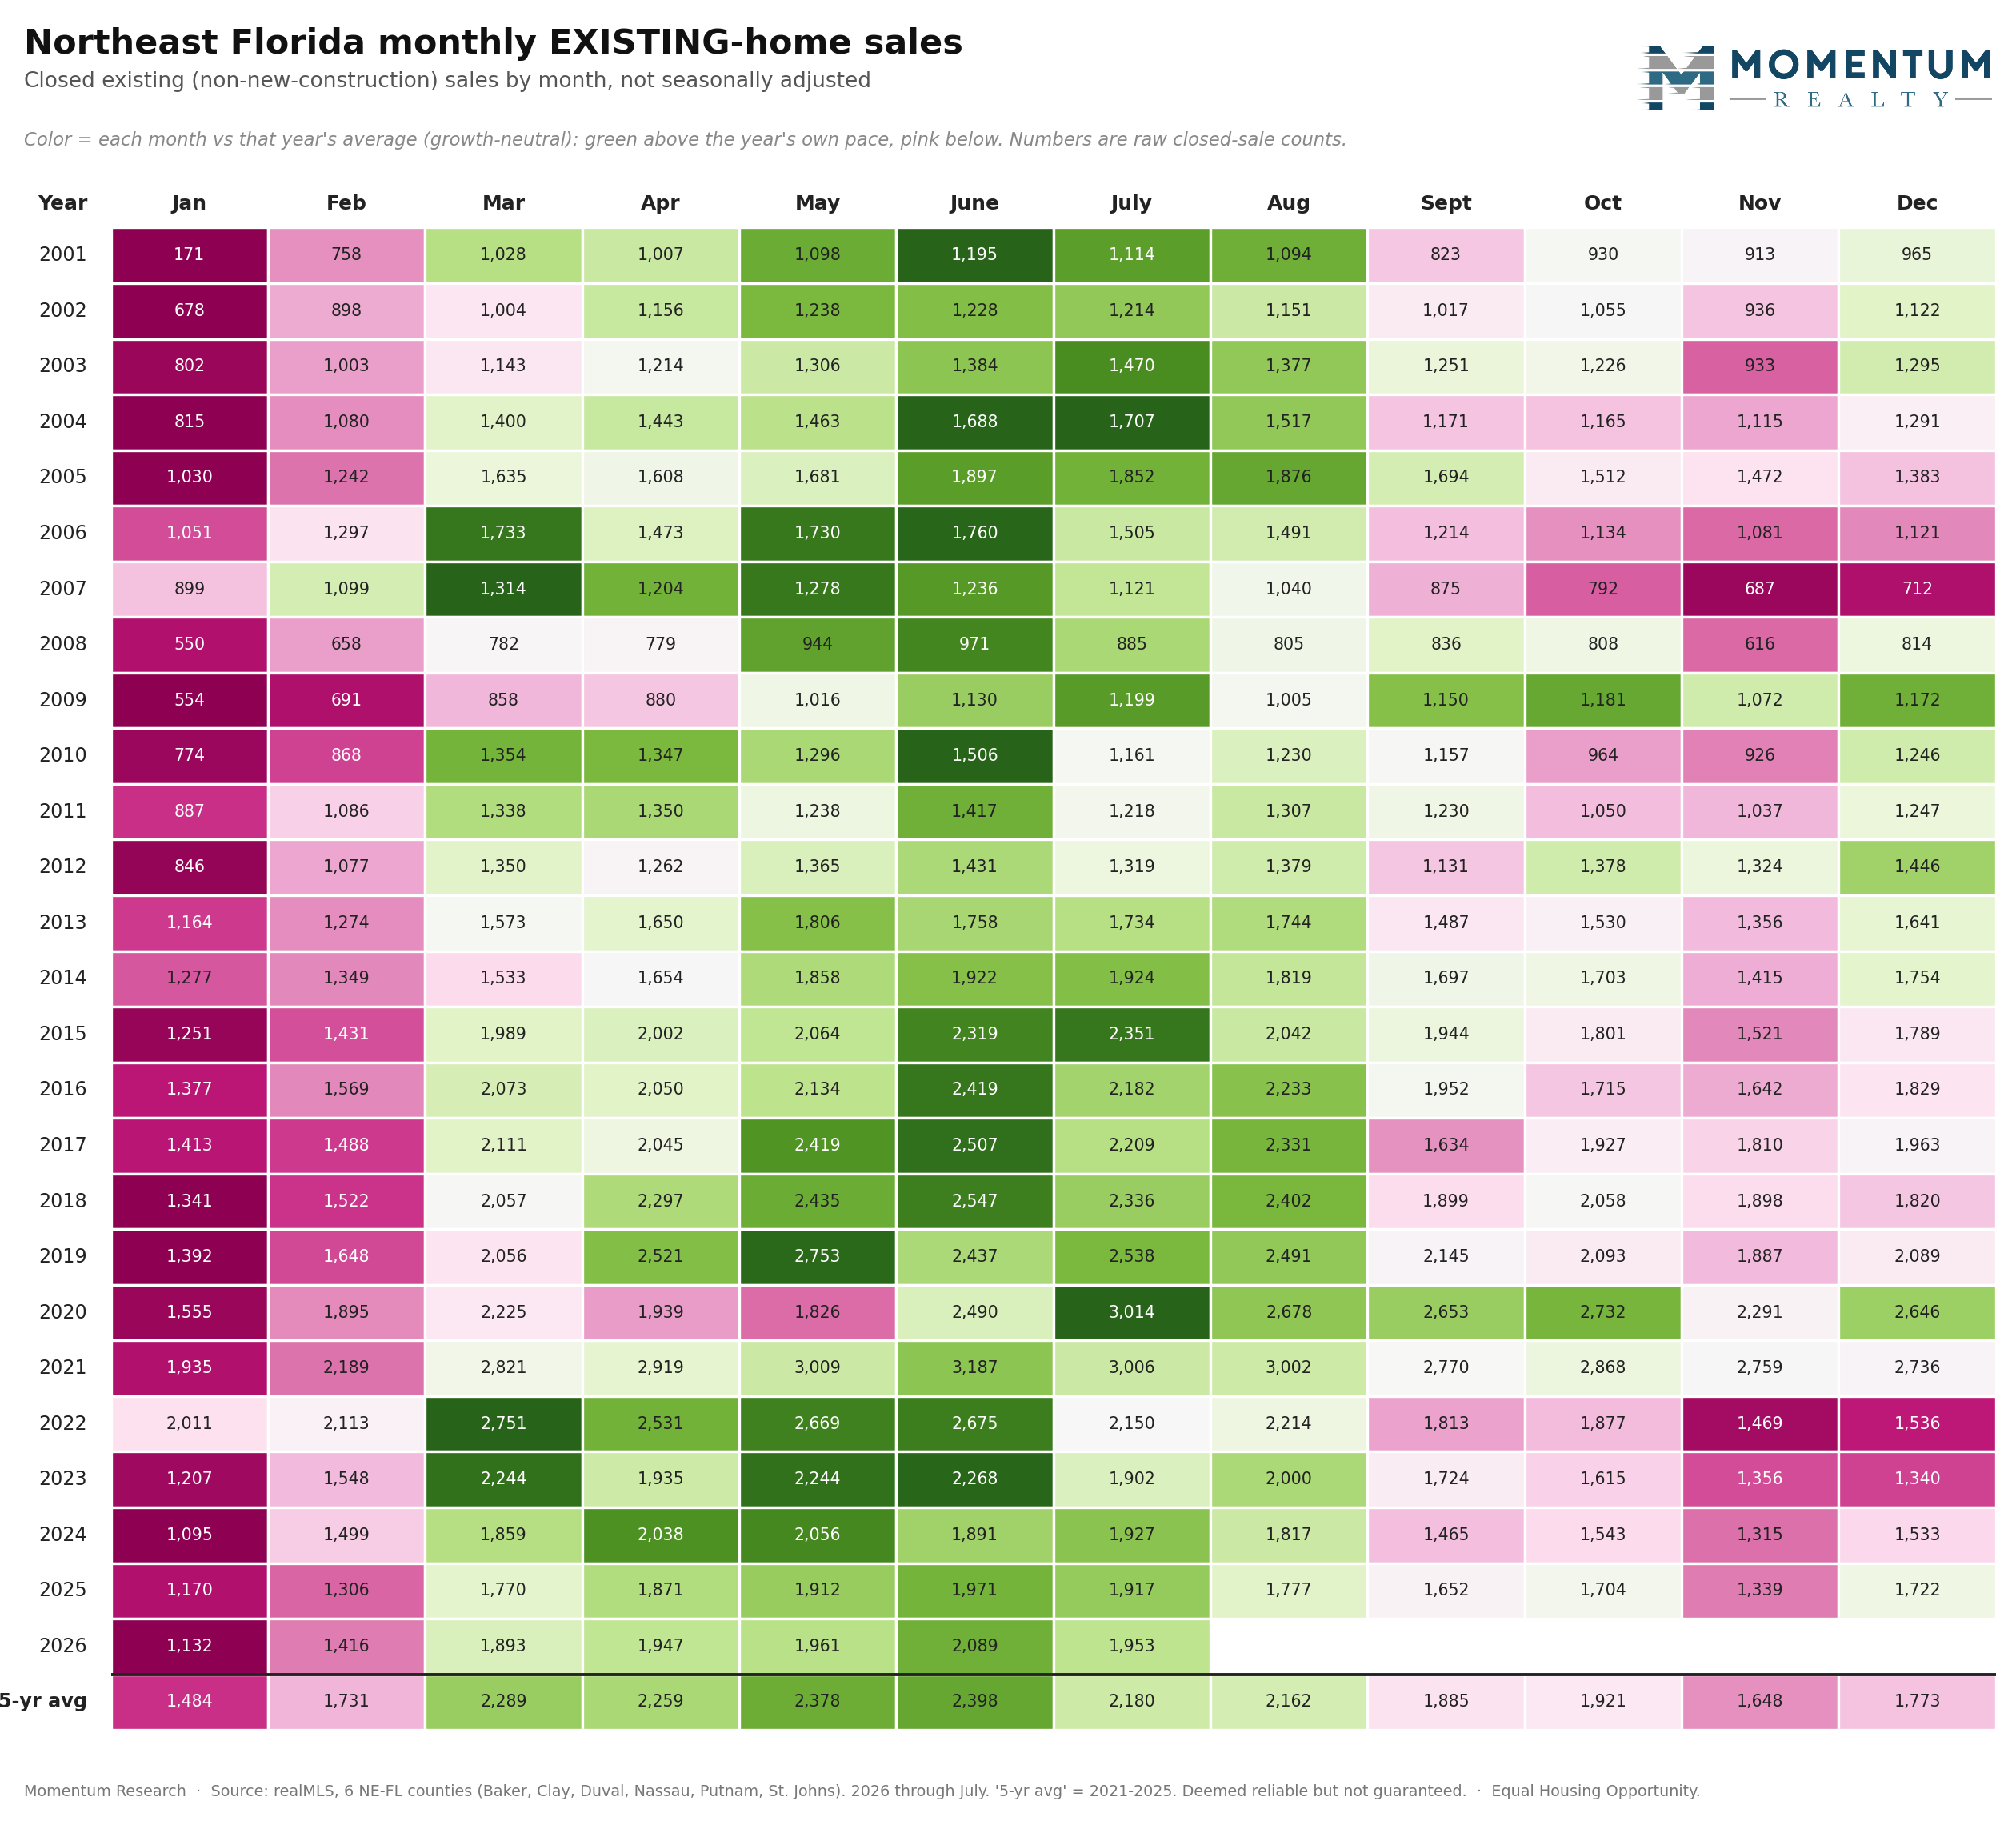
Resale follows the pattern most people picture. The green concentrates in a spring-to-summer band, year after year, with June the strongest month on the five-year average at about 2,398 closings and May close behind. January is the reliable low, often less than half of June. The engine is the school calendar: buyers who want to be settled before the fall term shop in spring, and because a June closing usually reflects an April or May contract, the real shopping peak sits a month or two ahead of the closing peak. For how fast homes move once listed, see our days-on-market breakdown.
New construction: a December market
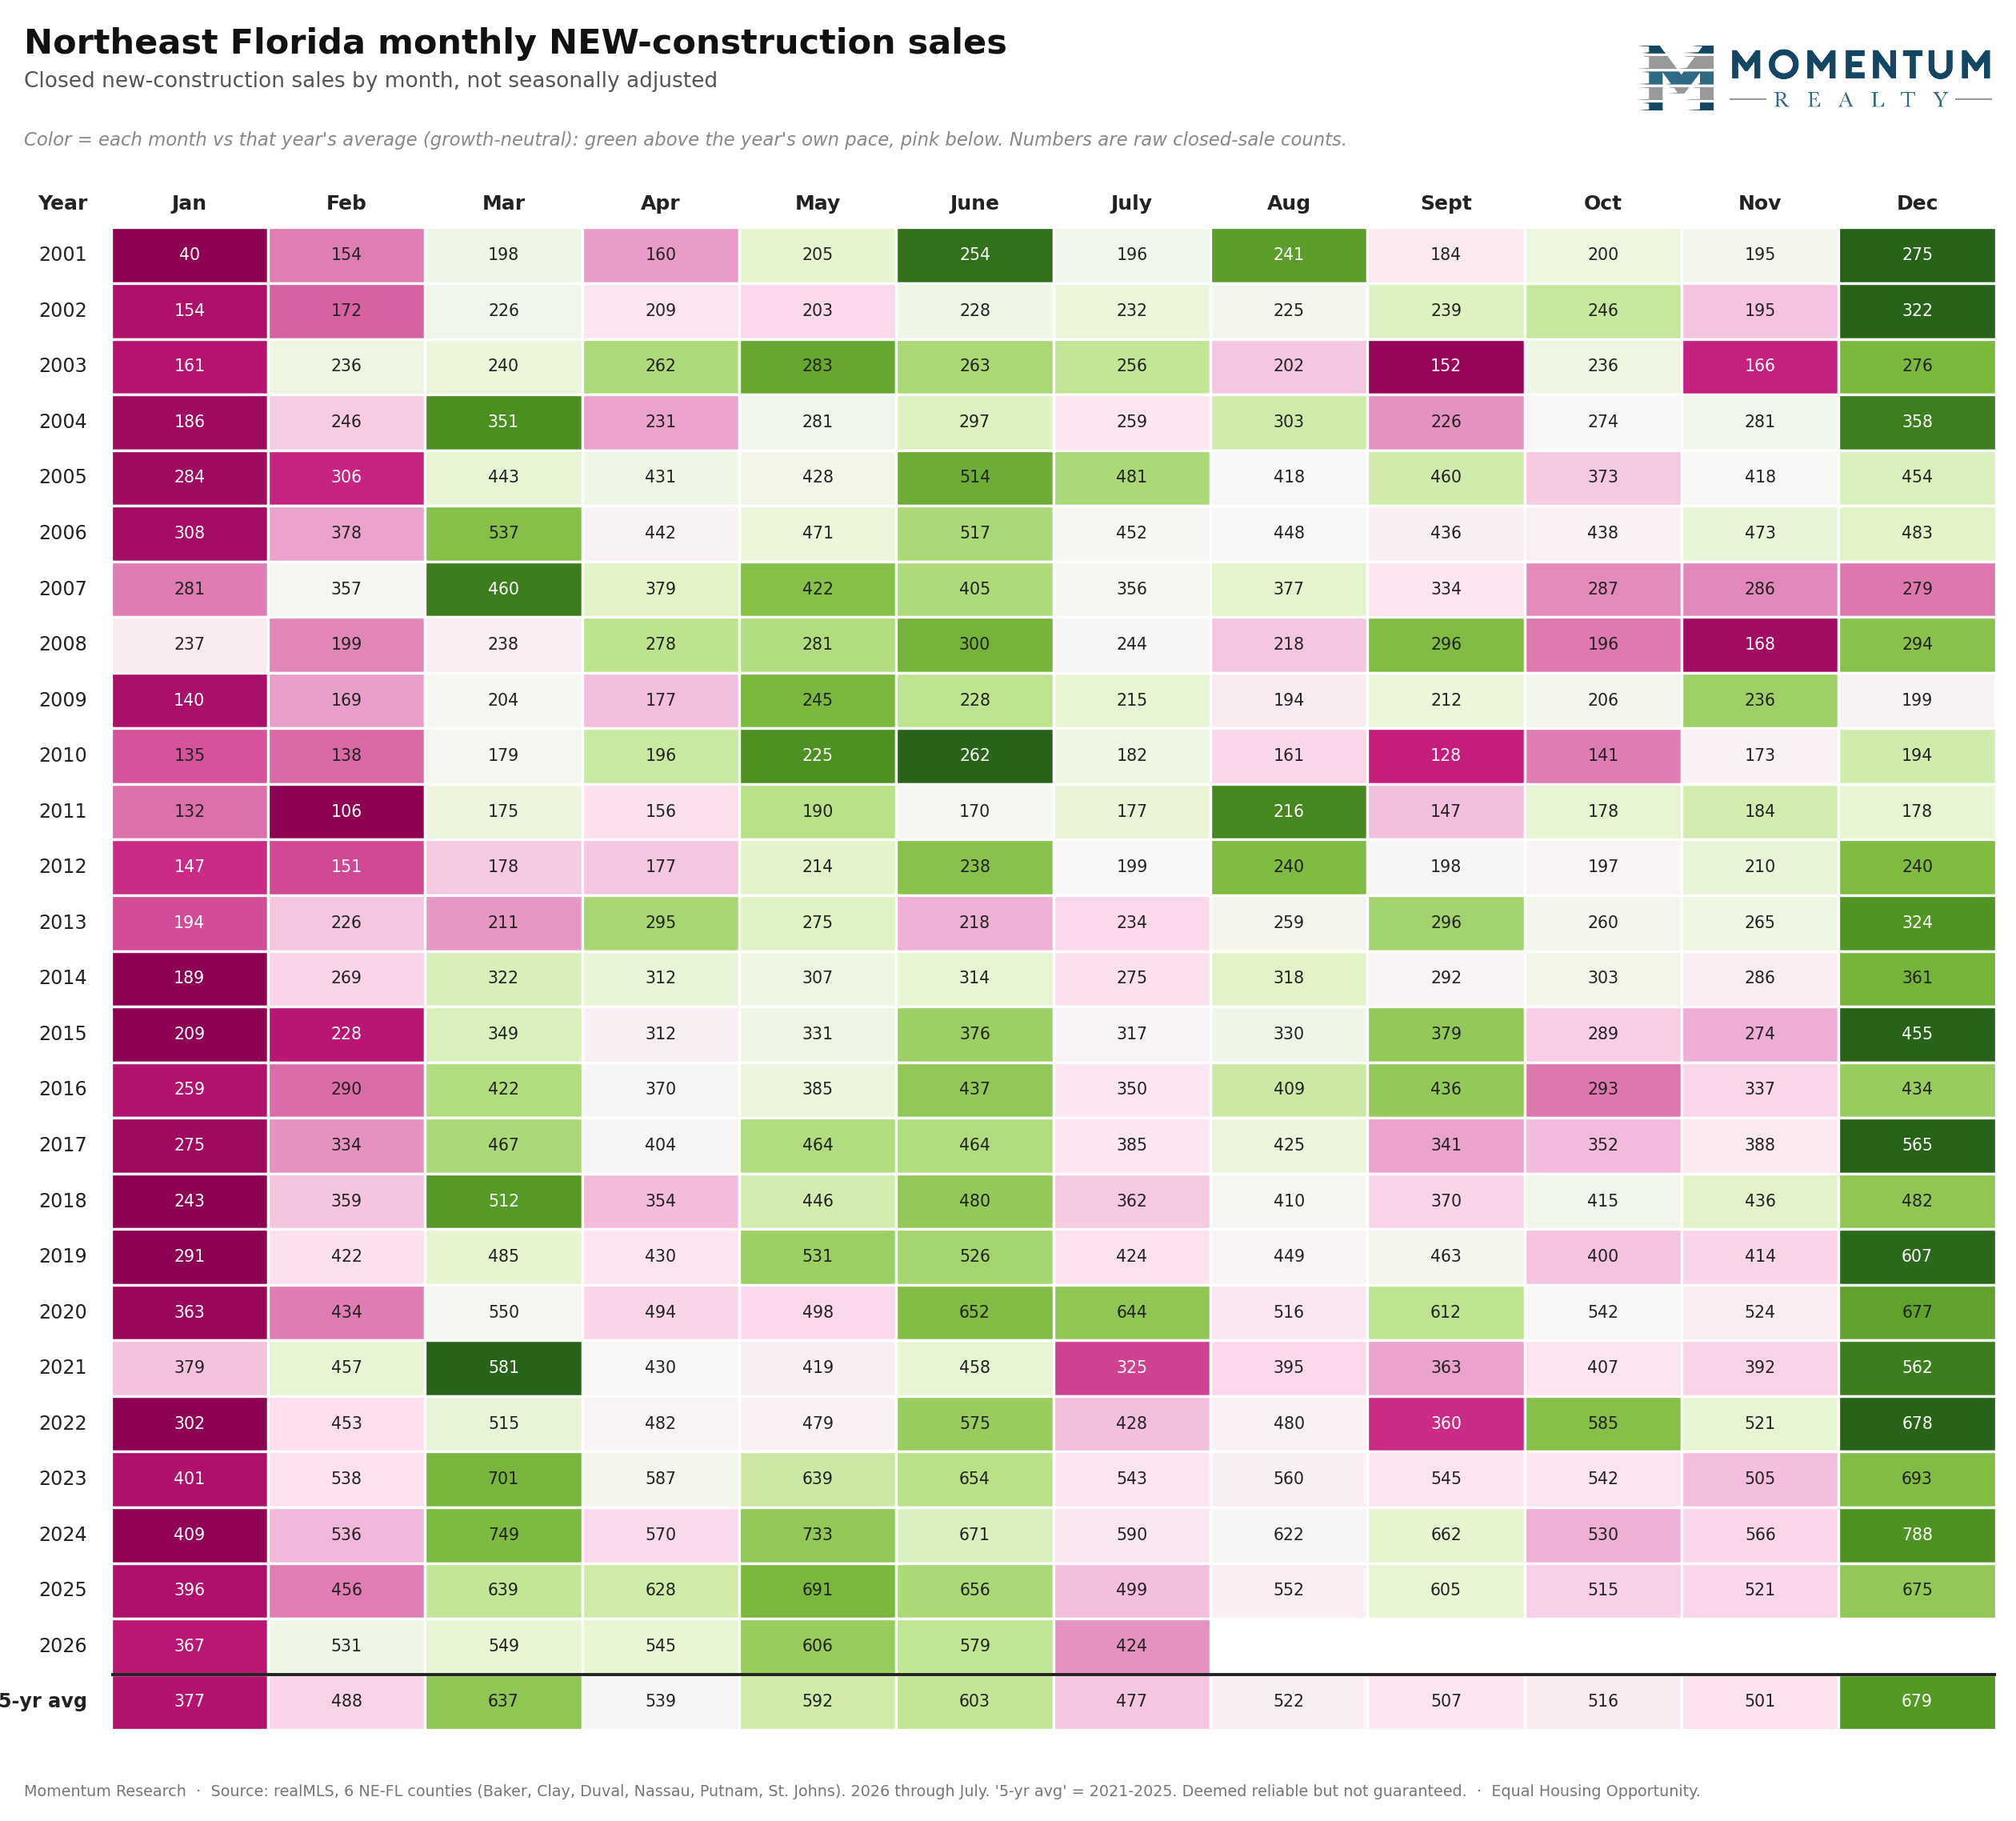
New homes flip the script. Read down the December column and it is dark green in nearly every year, the busiest new-home month on the calendar and about 679 closings on the five-year average, well above January's 377. The reason is the builder's fiscal calendar: public homebuilders push to close as many homes as possible before their fiscal year ends, and those year-ends are staggered across the fall, with D.R. Horton closing September 30, Toll Brothers October 31, Lennar and KB Home November 30, and PulteGroup and much of the rest December 31. That staggering keeps new construction elevated across the whole fourth quarter instead of spiking on one date, and it is why a buyer shopping a builder in the fall often meets the most motivated seller of the year.
The whole market together
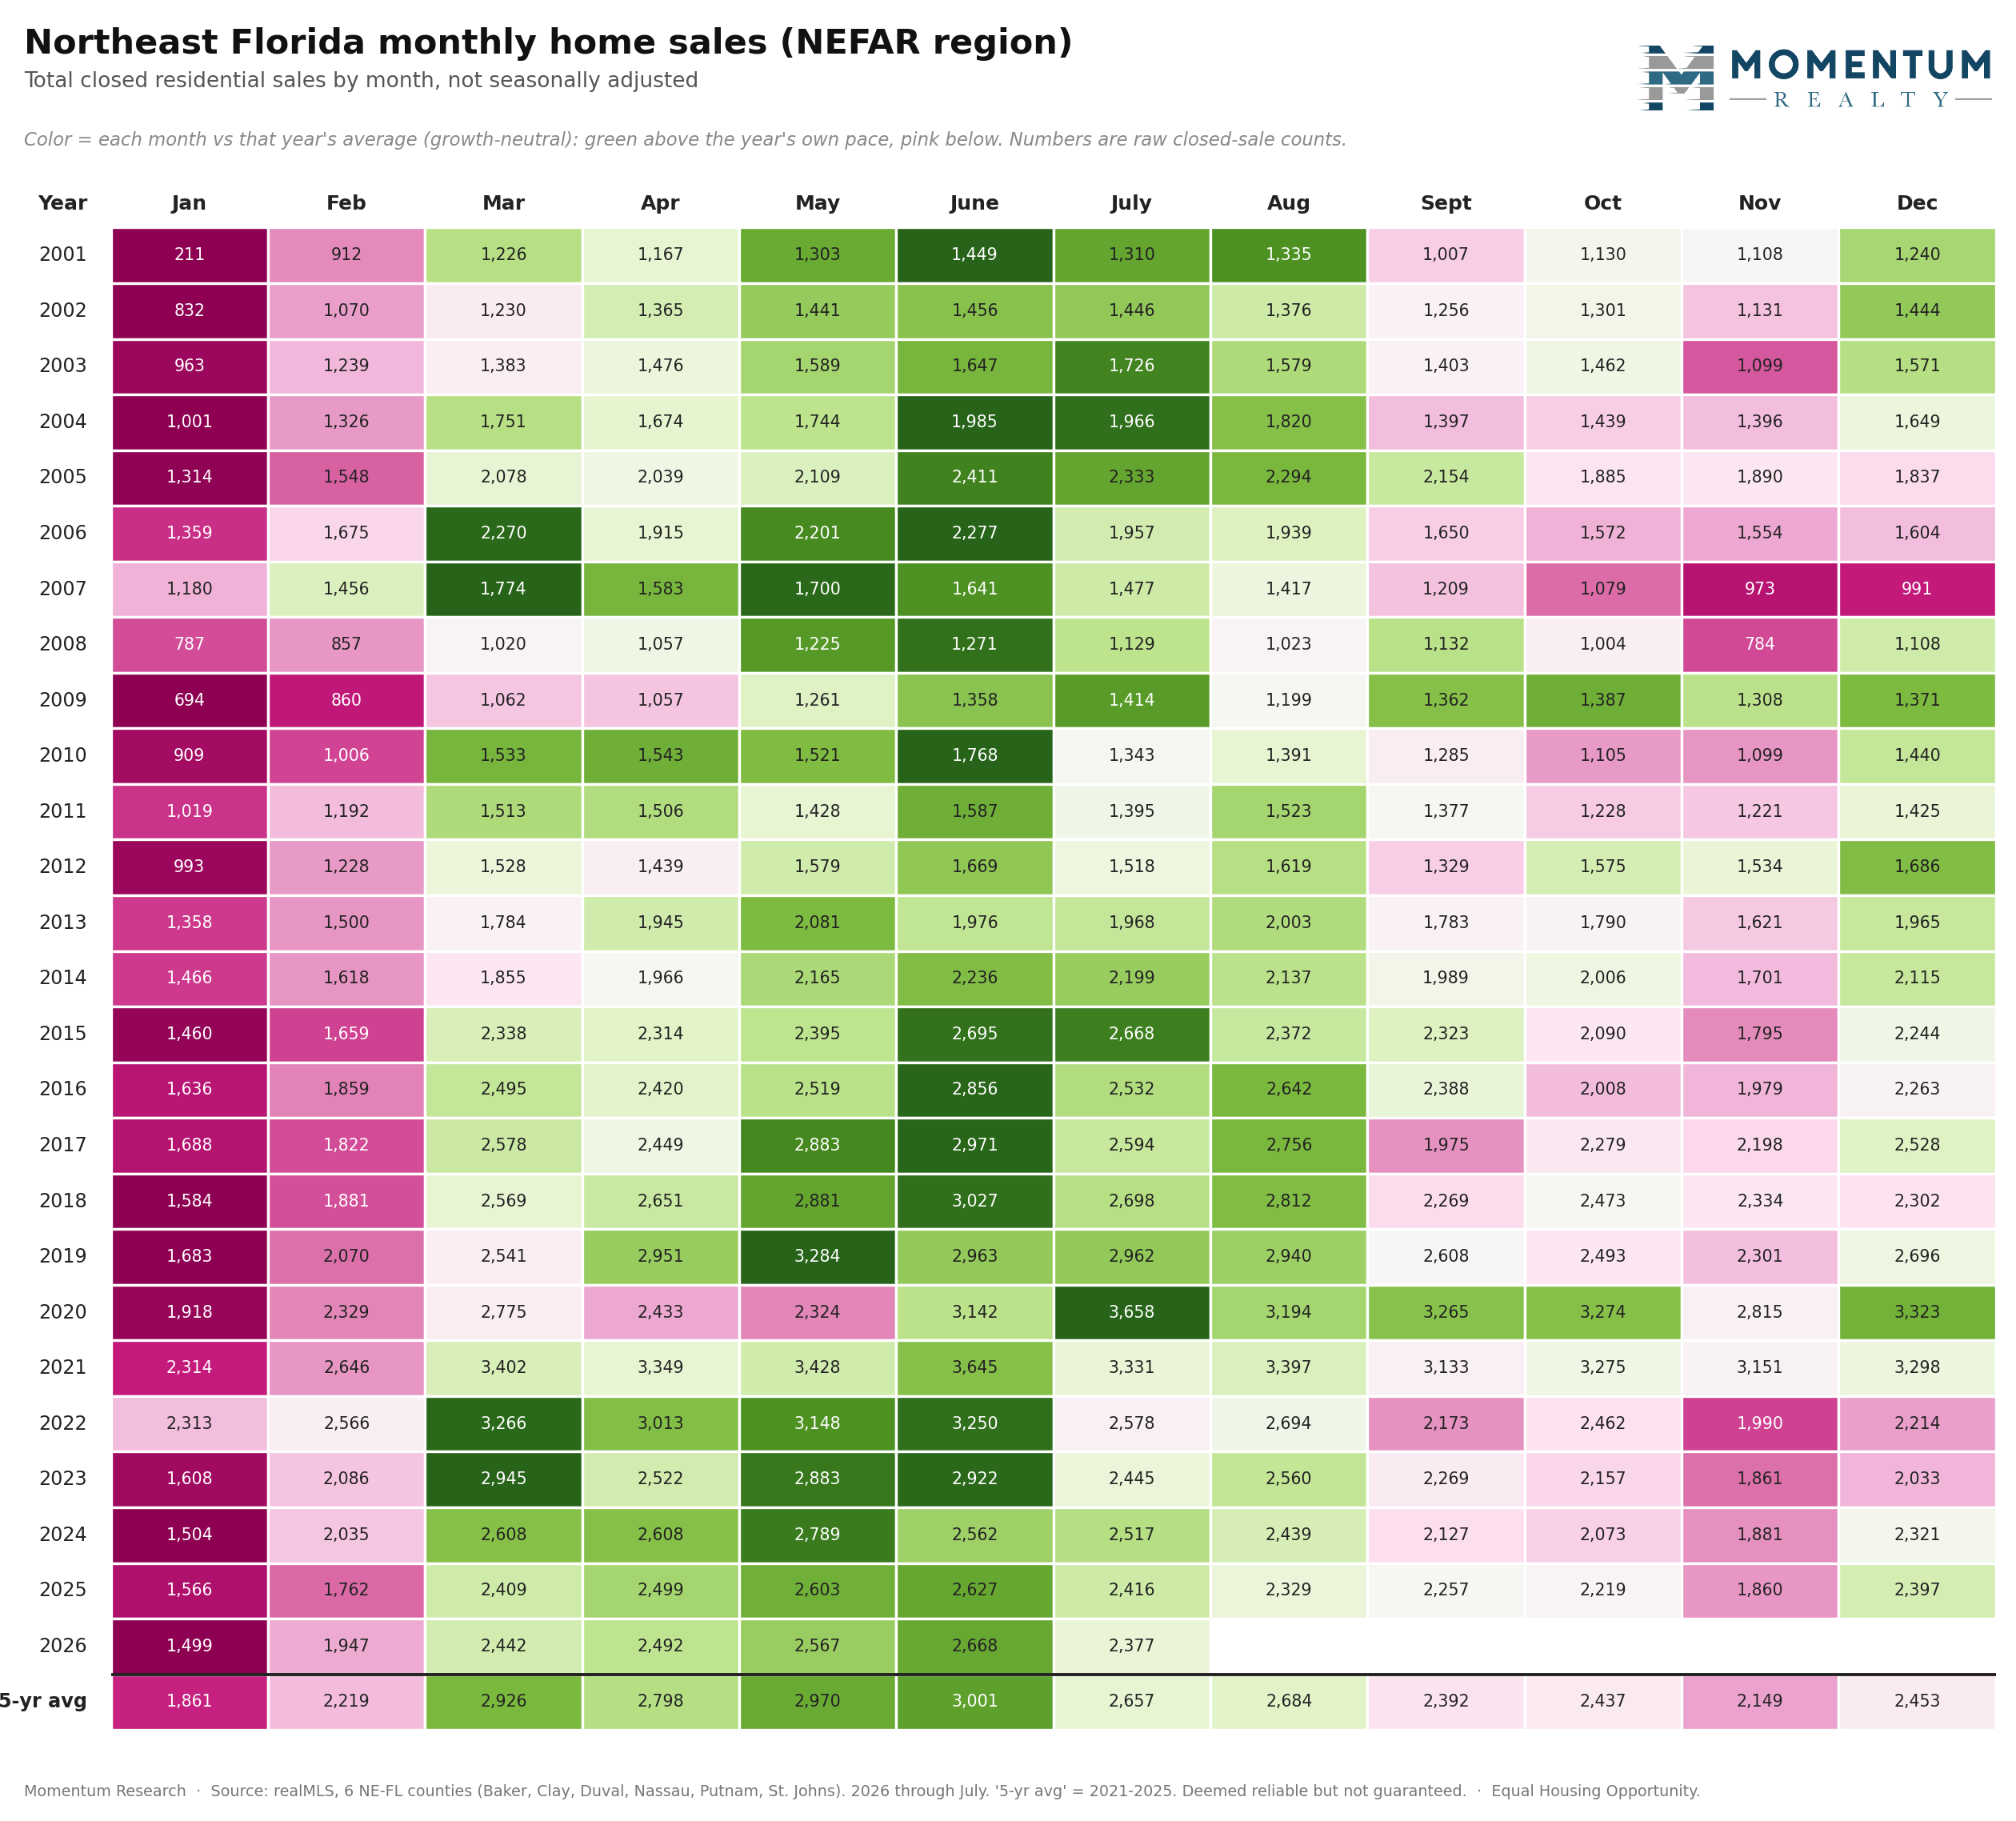
Blend the two together and resale wins on sheer size, so the total market, the full NEFAR region, keeps the resale shape: a spring and early-summer peak around June, about 3,001 closings on the five-year average, and a January floor near 1,861. The all-market map also shows the bigger cycles at a glance: the deep-green boom years of 2004 to 2006, the pale, pink-heavy rows of the 2008 to 2011 downturn, and the return to strong spring bands from 2015 on. It is the timing companion to the price map in our Jacksonville housing market data hub.
How agents can use this data
With a resale seller: aim for the June closing peak, which means listing in late winter to early spring when buyer traffic is heaviest and existing-home demand runs about 60 percent above the January floor. The calendar is a free tailwind if you use it.
With a new-construction buyer: point them at the fall. Builders close their fastest in December to hit fiscal year-end, and their year-ends are staggered from September to December, so October and November shopping to close by year-end often lands on the strongest incentives.
With a resale buyer who wants less competition: the winter trough means fewer buyers bidding, though also fewer homes listed. It is a slower, more negotiable window for the buyer willing to shop off-season.
On social or with press: the heat maps carry it. One line: in Northeast Florida, existing homes sell fastest in June and new construction peaks in December, so the two markets run on nearly opposite calendars.
Keep it about the homes and the market timing, not about who lives where. Cite the source line below if you quote the numbers, and never present them as guaranteed.
People also ask
When do existing homes sell most in Northeast Florida?
Across 25 years of realMLS data for the six Northeast Florida counties, existing-home closings peak in late spring and early summer, with June the strongest month on the five-year average, roughly 60 percent above the January low. January is consistently the slowest month for resale.
When do new-construction homes sell most in Northeast Florida?
New-construction closings peak in December almost every year, as builders push to close by their fiscal year-end. On the five-year average December is the single busiest new-home month, and new construction stays elevated across the whole fourth quarter because builder fiscal year-ends are staggered from September to December.
How far back does this Northeast Florida home-sales data go?
The heat maps cover monthly closed sales from 2001 through July 2026 in the six-county realMLS footprint (Baker, Clay, Duval, Nassau, Putnam, and St. Johns), shown separately for existing homes, new construction, and the total NEFAR region. Data is deemed reliable but not guaranteed.
The takeaway
Twenty-five years of monthly sales say there is no single best month to move in Northeast Florida, because resale and new construction keep different calendars. Existing homes peak in June and fade into winter; new homes peak in December as builders race to their fiscal year-end; and the total market follows resale to a June high. Match your timing to your side of the market: list a resale in late winter to ride the spring peak, or shop a new build in the fall to catch a builder chasing its annual number. When you are ready to put a number to your own home, start a real, comps-based valuation on our home value page. Data reflects closed sales in the realMLS footprint and is deemed reliable but not guaranteed. This is general information, not investment advice.
Momentum Research. Equal Housing Opportunity.
This article was compiled with the help of automated tools from realMLS closing records and may contain errors. Information is deemed reliable but not guaranteed. It is for general information only and is not financial, investment, legal, or tax advice. Verify all facts independently before relying on them. Builder fiscal year-end dates are per company SEC filings and investor disclosures. Source: Momentum Research analysis of realMLS closed sales, Baker, Clay, Duval, Nassau, Putnam, and St. Johns counties, monthly closed sales 2001 to 2026 for existing homes, new construction, and the total NEFAR region, colored versus each year's own average.