
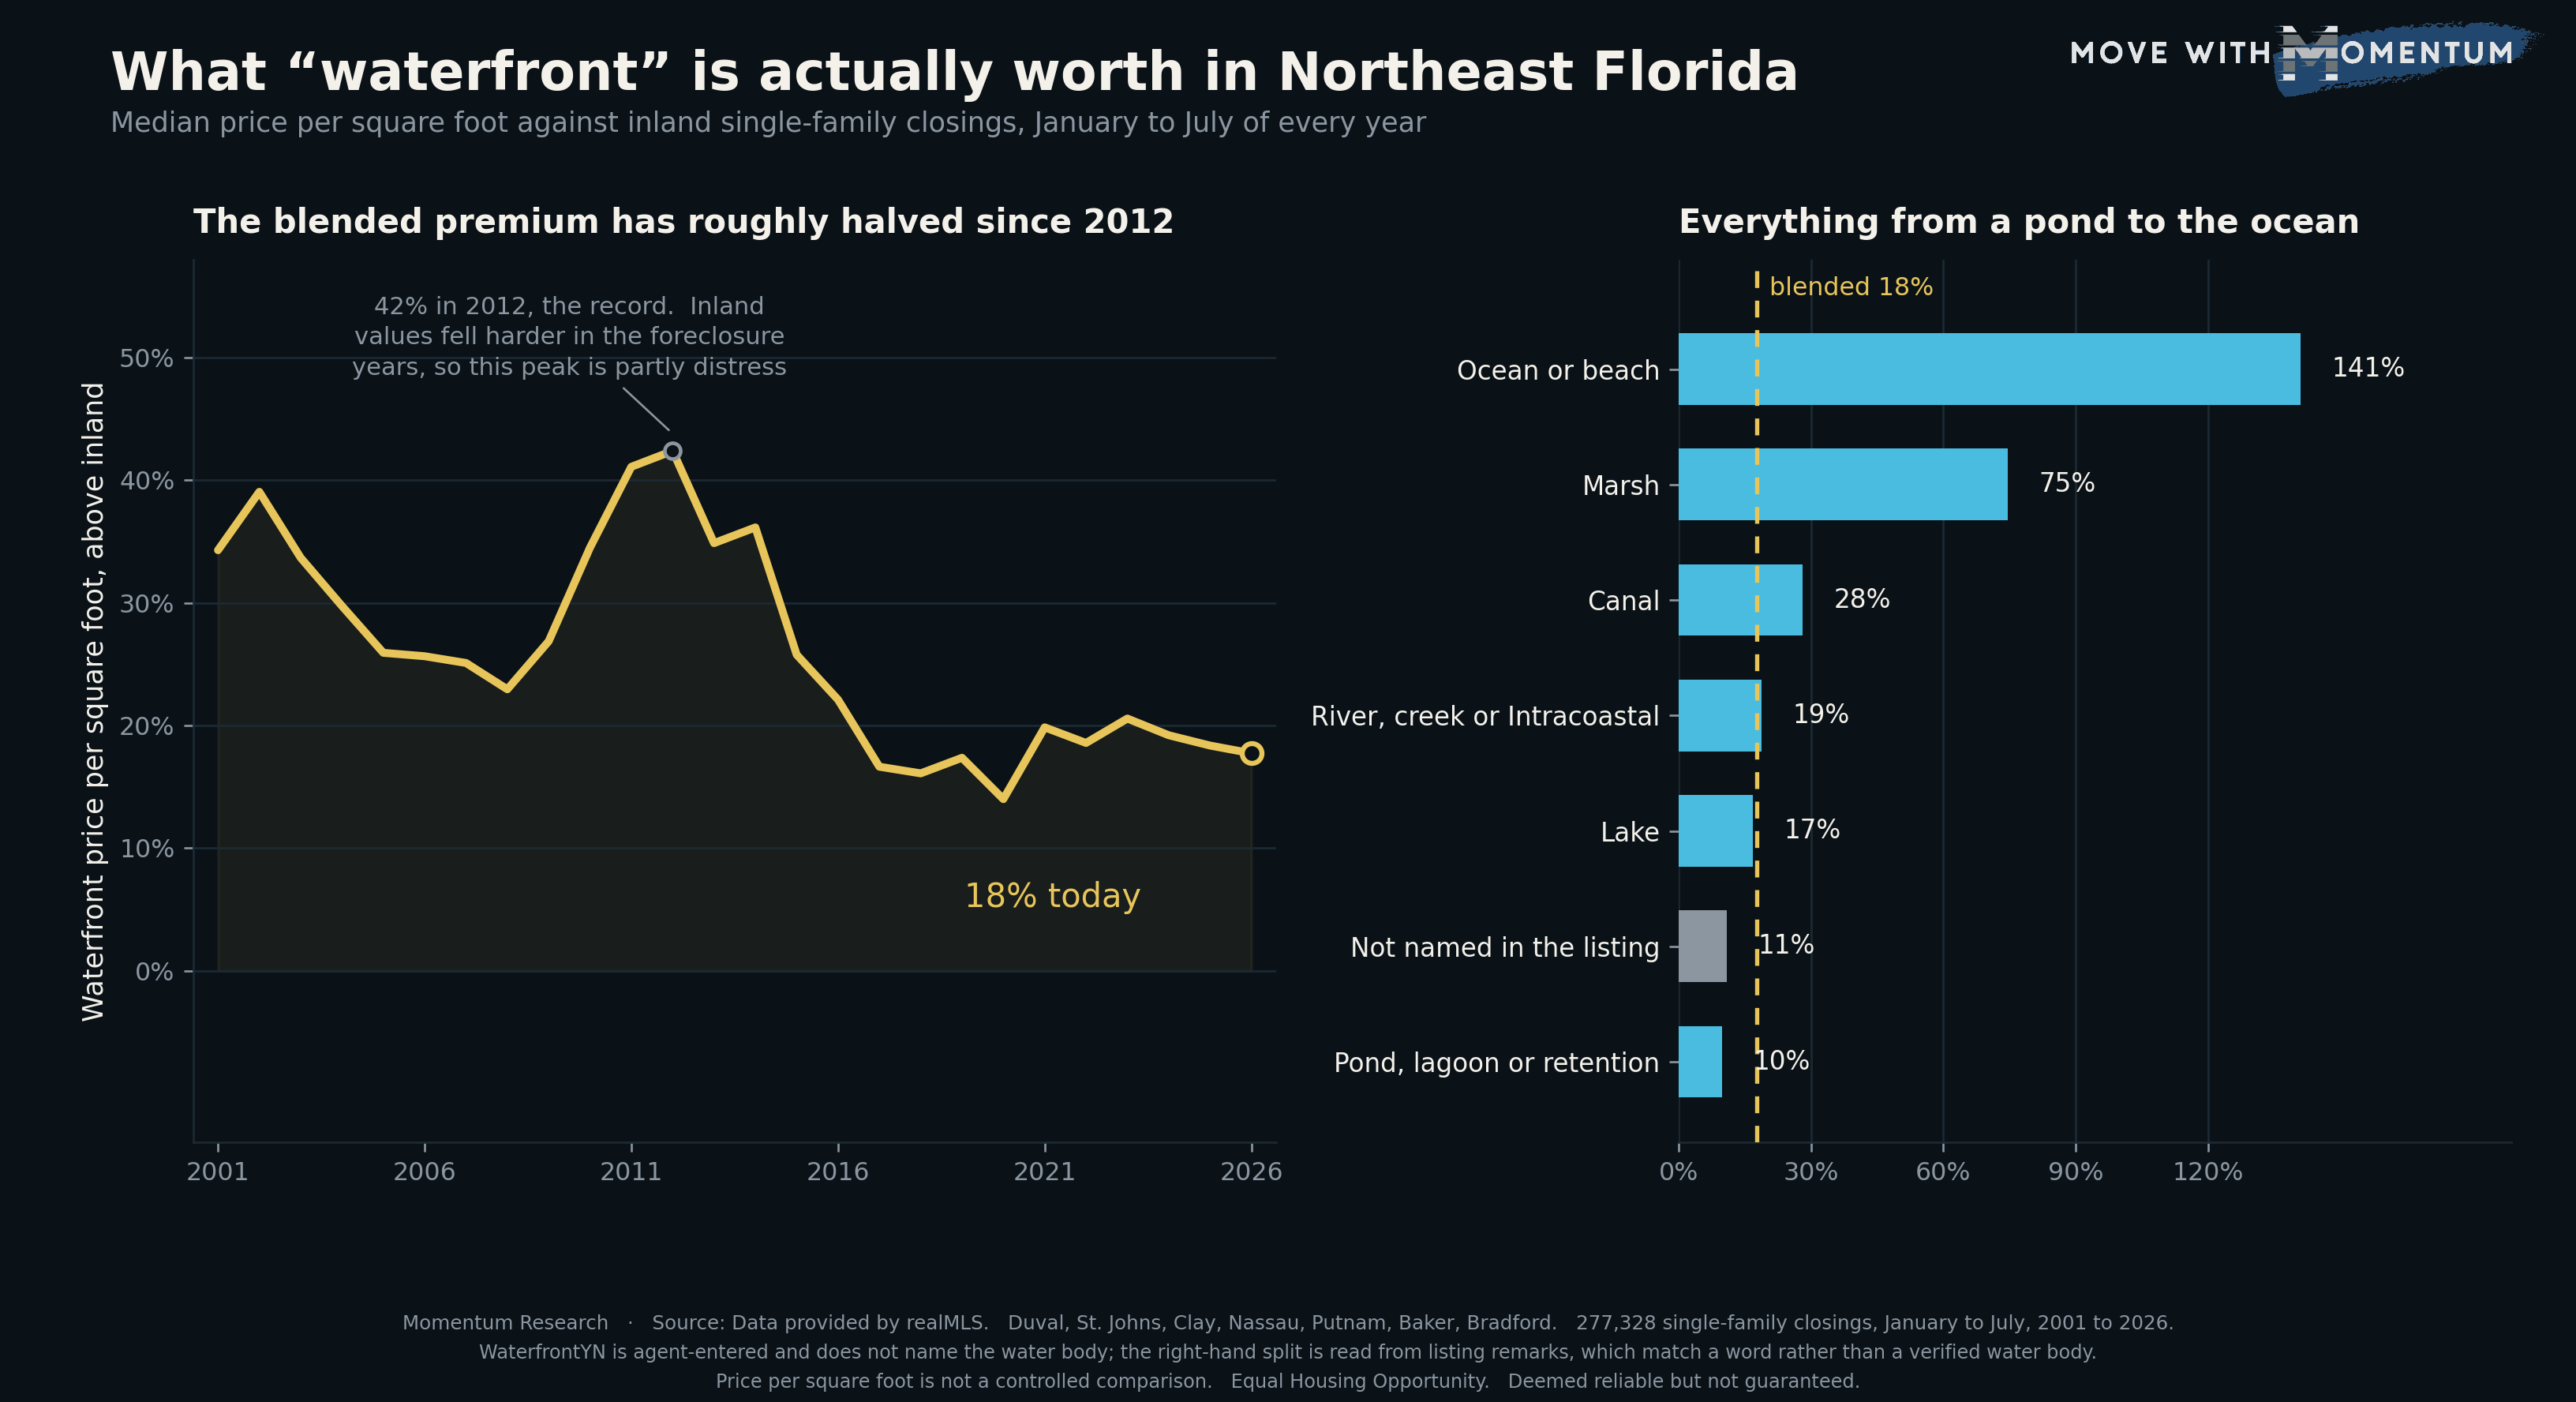
There is a number that gets quoted constantly in this market: waterfront is worth about twenty percent more. Measured across every single-family closing in the seven realMLS counties from January to July of this year, that number is right. A waterfront home closed at a median $239 per square foot against $203 inland, a premium of 17.7%.
It is also one of the least useful numbers we have ever put on this page, and this edition is about why.
The blended premium has roughly halved since 2012
Running the same calculation on a fixed January to July window for all 26 years gives a series that falls a long way. The waterfront premium was 34.3% in 2001, dipped to 23.0% in 2008, spiked to a record 42.4% in 2012, and has been below 21% every year since 2015. It sits at 17.7% today.
The 2012 peak needs a caveat before anyone builds a story on it. Inland values fell harder than waterfront values in the foreclosure years, so the gap widened because the bottom lane collapsed, not because waterfront gained. Inland closed at $76 per square foot in 2012 against $108 for waterfront; by 2026 inland has nearly tripled to $203 while waterfront has roughly doubled to $239. The durable movement is the decline from 25.8% in 2015 to 17.7% now.
Meanwhile the share sold as waterfront hit a 26-year high
The second series on this data is the one that makes the first series make sense. Waterfront homes were 9.0% of closings in 2009, the low of the record. In January to July 2026 they were 15.1%, the highest share in 26 years, and the share has risen in four of the last five years.
So more homes are selling as waterfront, and waterfront is worth less relative to inland than at any point before 2017 apart from 2020. Those two facts reconcile in one obvious way, and the rest of this piece tests it: the word is covering more ground than it used to.
One word, a range from 10% to 141%
The MLS records waterfront as a single yes or no box. It does not say what the water is. Reading the listing remarks on this year's waterfront closings and sorting each one into a single category, most specific water first, produces a range that a blended figure completely erases.
- Ocean or beach, 7.1% of waterfront closings: $489 per square foot, a 141% premium, median close price $1,200,000.
- Marsh, 4.0%: $354 per square foot, a 75% premium, median close price $1,000,000.
- Canal, 2.1%: $260 per square foot, a 28% premium.
- River, creek or Intracoastal, 20.8%: $241 per square foot, a 19% premium.
- Lake, 16.1%: $237 per square foot, a 17% premium.
- Pond, lagoon or retention, 19.0%: $223 per square foot, a 10% premium.
- Water not named in the listing, 30.9%: $225 per square foot, an 11% premium.
Half of everything selling as waterfront in Northeast Florida this year is either explicitly a pond or lagoon, or does not name its water at all, and those two groups close at a premium of roughly ten percent. The ocean lots that give the word its reputation are 7.1% of the category.
Newer waterfront carries almost no premium
If the dilution reading is right, the premium should survive on older waterfront stock and fade on newer stock, because the retention ponds and lagoons sit inside master-planned subdivisions built in the last decade. Comparing each build era against inland homes of the same era, that is exactly the pattern.
Waterfront homes built before 1990 closed at a 46.9% premium over inland homes of the same era. Built 1990 to 2004, 14.3%. Built 2005 to 2014, 13.8%. Built 2015 or later, 10.2%. The oldest waterfront stock still carries roughly the premium the whole category carried in 2001; the newest carries about a fifth of it.
The county pattern says the same thing
The 2026 premium by county runs Putnam 49.1%, Duval 19.4%, Nassau 17.2%, St. Johns 8.7% and Clay 3.1%. That ordering looks strange until you notice it tracks where the master-planned inventory is rather than where the expensive water is. St. Johns and Clay carry the region's newest large subdivisions, and they are the two counties where waterfront is worth the least relative to their own inland stock, even though St. Johns has the highest waterfront price per square foot of any county at $265. For more on how much county lines move price here, see our work on home prices by direction from downtown.
Waterfront no longer takes longer to sell
One more series moved. Waterfront homes used to sit on the market noticeably longer than inland homes: a median 49 days against 41 in 2001, and 94 against 68 in 2012. In January to July 2026 the two are 36 days and 35 days, effectively the same. A category that once behaved like a specialty product now clears at the pace of the general market, which is what you would expect if a large share of it now is general-market housing that happens to back onto water.
What this does not prove
Several things, and they matter.
The water-type split is read from listing remarks with pattern matching. That matches a word, not a verified water body: a listing that mentions a community lagoon while sitting on a canal is counted as a lagoon, and the 30.9% that name no water are genuinely unknown rather than assumed to be ponds. We have run this method before and the same limit applied then.
Public remarks are only populated in this feed from 2023, so the water-type split cannot be run historically. We cannot show that the pond share rose over 26 years; we can show that the blended premium fell, that the waterfront share rose to a record, that newer waterfront carries far less premium than older waterfront today, and that the category currently spans a 14-fold range. The dilution reading is the best explanation of those four facts, not a measured trend in itself.
Price per square foot is not a controlled comparison. Waterfront homes in this data are larger than inland homes, and the county mix inside the waterfront lane shifted from Duval-heavy to St. Johns-heavy across the window. That shift works against the finding, since St. Johns is the region's priciest county, so a rising St. Johns weight should have pushed the blended premium up rather than down.
Two rival explanations were tested and failed. New construction is not the cause: the waterfront lane is less new-construction-heavy than the inland lane (16.9% against 22.6% this year), and removing new construction from both sides leaves the same shape, 37.4% in 2001 falling to 21.0% in 2026. County mix is not the cause either: holding county constant by looking only at Duval gives 25.1% in 2001, a 54.0% peak in 2012, and 19.4% now. Controlling for size by looking only at homes of 1,600 to 2,600 square feet gives a smaller premium throughout, 19.2% in 2001 against 11.8% now, but the same direction.
How agents can use this data
Four concrete uses, all of them about the property rather than the people who live there.
Stop pricing off a blended waterfront comp. If a seller's last agent told them waterfront is worth twenty percent, and the home backs onto a retention pond in a 2019 subdivision, this data says the market is paying closer to ten. Pull comps that match the water type and the build era, not the checkbox.
Read the checkbox as a search filter, not a valuation input. A buyer filtering on waterfront in Northeast Florida is looking at a pool where roughly half the results are pond or unnamed water. That is worth saying out loud before the first showing, and it makes the ocean, marsh and canal lots easier to justify when you get to them.
Name the water in the listing remarks. Nearly a third of waterfront closings this year did not, and that group closed at an 11% premium, near the bottom of the range. This data cannot prove naming the water causes a higher price, since the homes that name it may simply have better water. It does show that the listings which do not name it are being valued as though they have the least valuable kind.
Use the age split when setting expectations on older waterfront. Pre-1990 waterfront is the one lane still carrying a premium near the historical level. Sellers of that stock often assume their home is dated relative to the new subdivisions; on a per-foot basis this market is paying them 46.9% over inland homes of the same age.
Cite the source and the window whenever you use these figures with a client: Momentum Research analysis of realMLS closed sales, January to July 2026, seven counties, deemed reliable but not guaranteed.
People also ask
How much more do waterfront homes cost in Jacksonville?
Across January to July 2026 closings in the seven realMLS counties, a waterfront single-family home closed at a median $239 per square foot against $203 inland, about 18% more. That blended figure is close to useless on its own, because the premium depends almost entirely on what the water is. Splitting the same closings by the water named in the listing, the median premium ran about 10% for a pond, lagoon or retention lot, 17% for a lake, 19% for a river, creek or Intracoastal lot, 28% for a canal, 75% for a marsh and 141% for an ocean or beach lot.
Is a retention pond considered waterfront in a Florida listing?
In this feed, yes. The waterfront field is a single yes or no box entered by the listing agent, and it does not distinguish an oceanfront lot from a retention pond behind a subdivision lot. About 19% of Northeast Florida waterfront closings in January to July 2026 described a pond, lagoon or retention area in the listing remarks, and a further 31% did not name the water at all. Those two groups carried median premiums of roughly 10% and 11% over inland, against 141% for ocean or beach.
Has the waterfront premium in Northeast Florida gone down?
The blended premium has fallen from a record 42% in 2012 to about 18% in 2026, measured on a fixed January to July window every year. Two cautions belong with that. The 2012 peak is partly a distress artifact, because inland values fell harder in the foreclosure years, so the more durable comparison is the decline from about 26% in 2015. And the share of closings sold as waterfront rose over the same period to 15.1% in 2026, the highest in the 26-year record, so part of the decline reflects a wider mix of property being sold under the same label rather than the same property repricing.
The takeaway
Waterfront in Northeast Florida has not become worth less. Ocean lots closed at $489 per square foot this year, two and a half times the inland median, and that is a wider gap than the category has shown in most of the last decade. What has changed is the word. A single checkbox now spans a 10% premium and a 141% premium, half the category is pond or unnamed water, and the newest waterfront stock is worth about a fifth of the premium the oldest stock carries. Anyone quoting one waterfront number for this region is averaging a retention pond and the Atlantic Ocean. For the wider picture on prices and market time across the region, see our Jacksonville housing market data and our work on price per square foot in Northeast Florida.
Method and limits
Source: data provided by realMLS. Closed single-family residential sales in the authoritative counties of Duval, St. Johns, Clay, Nassau, Putnam, Baker and Bradford. Records are deduplicated on listing id plus close date. 277,328 closings across the fixed January to July window, 2001 through 2026.
Price per square foot is close price divided by living area. Records with a living area below 300 or above 15,000 square feet, or a close price below $10,000, are excluded. Condominiums, townhouses and manufactured homes are excluded so the comparison runs across one property type. A year needs 150 waterfront and 1,000 inland closings to be plotted, and a water-type lane needs 40 closings to be reported, which is why the canal lane is reported and no smaller lane is.
Waterfront status is the MLS WaterfrontYN field, entered by the listing agent and not independently verified. Water type is assigned from public remarks by pattern matching, in a fixed priority order running ocean, marsh, canal, river or Intracoastal, lake, then pond or lagoon, so every closing lands in exactly one category and none is double counted. Public remarks are only populated in this feed from 2023, which is why the water-type split is shown for the current year only.
Every year uses the same January to July window, chosen because July is the last complete close month in the current pull. Three limits carried from above: the comparison is not controlled for county, age, lot or build type; the 2012 peak is partly a distress artifact of inland values falling harder; and the water-type split matches a word in the remarks rather than a verified water body.
All figures on this page are per Momentum Research analysis of data provided by realMLS and are deemed reliable but not guaranteed. Equal Housing Opportunity.