
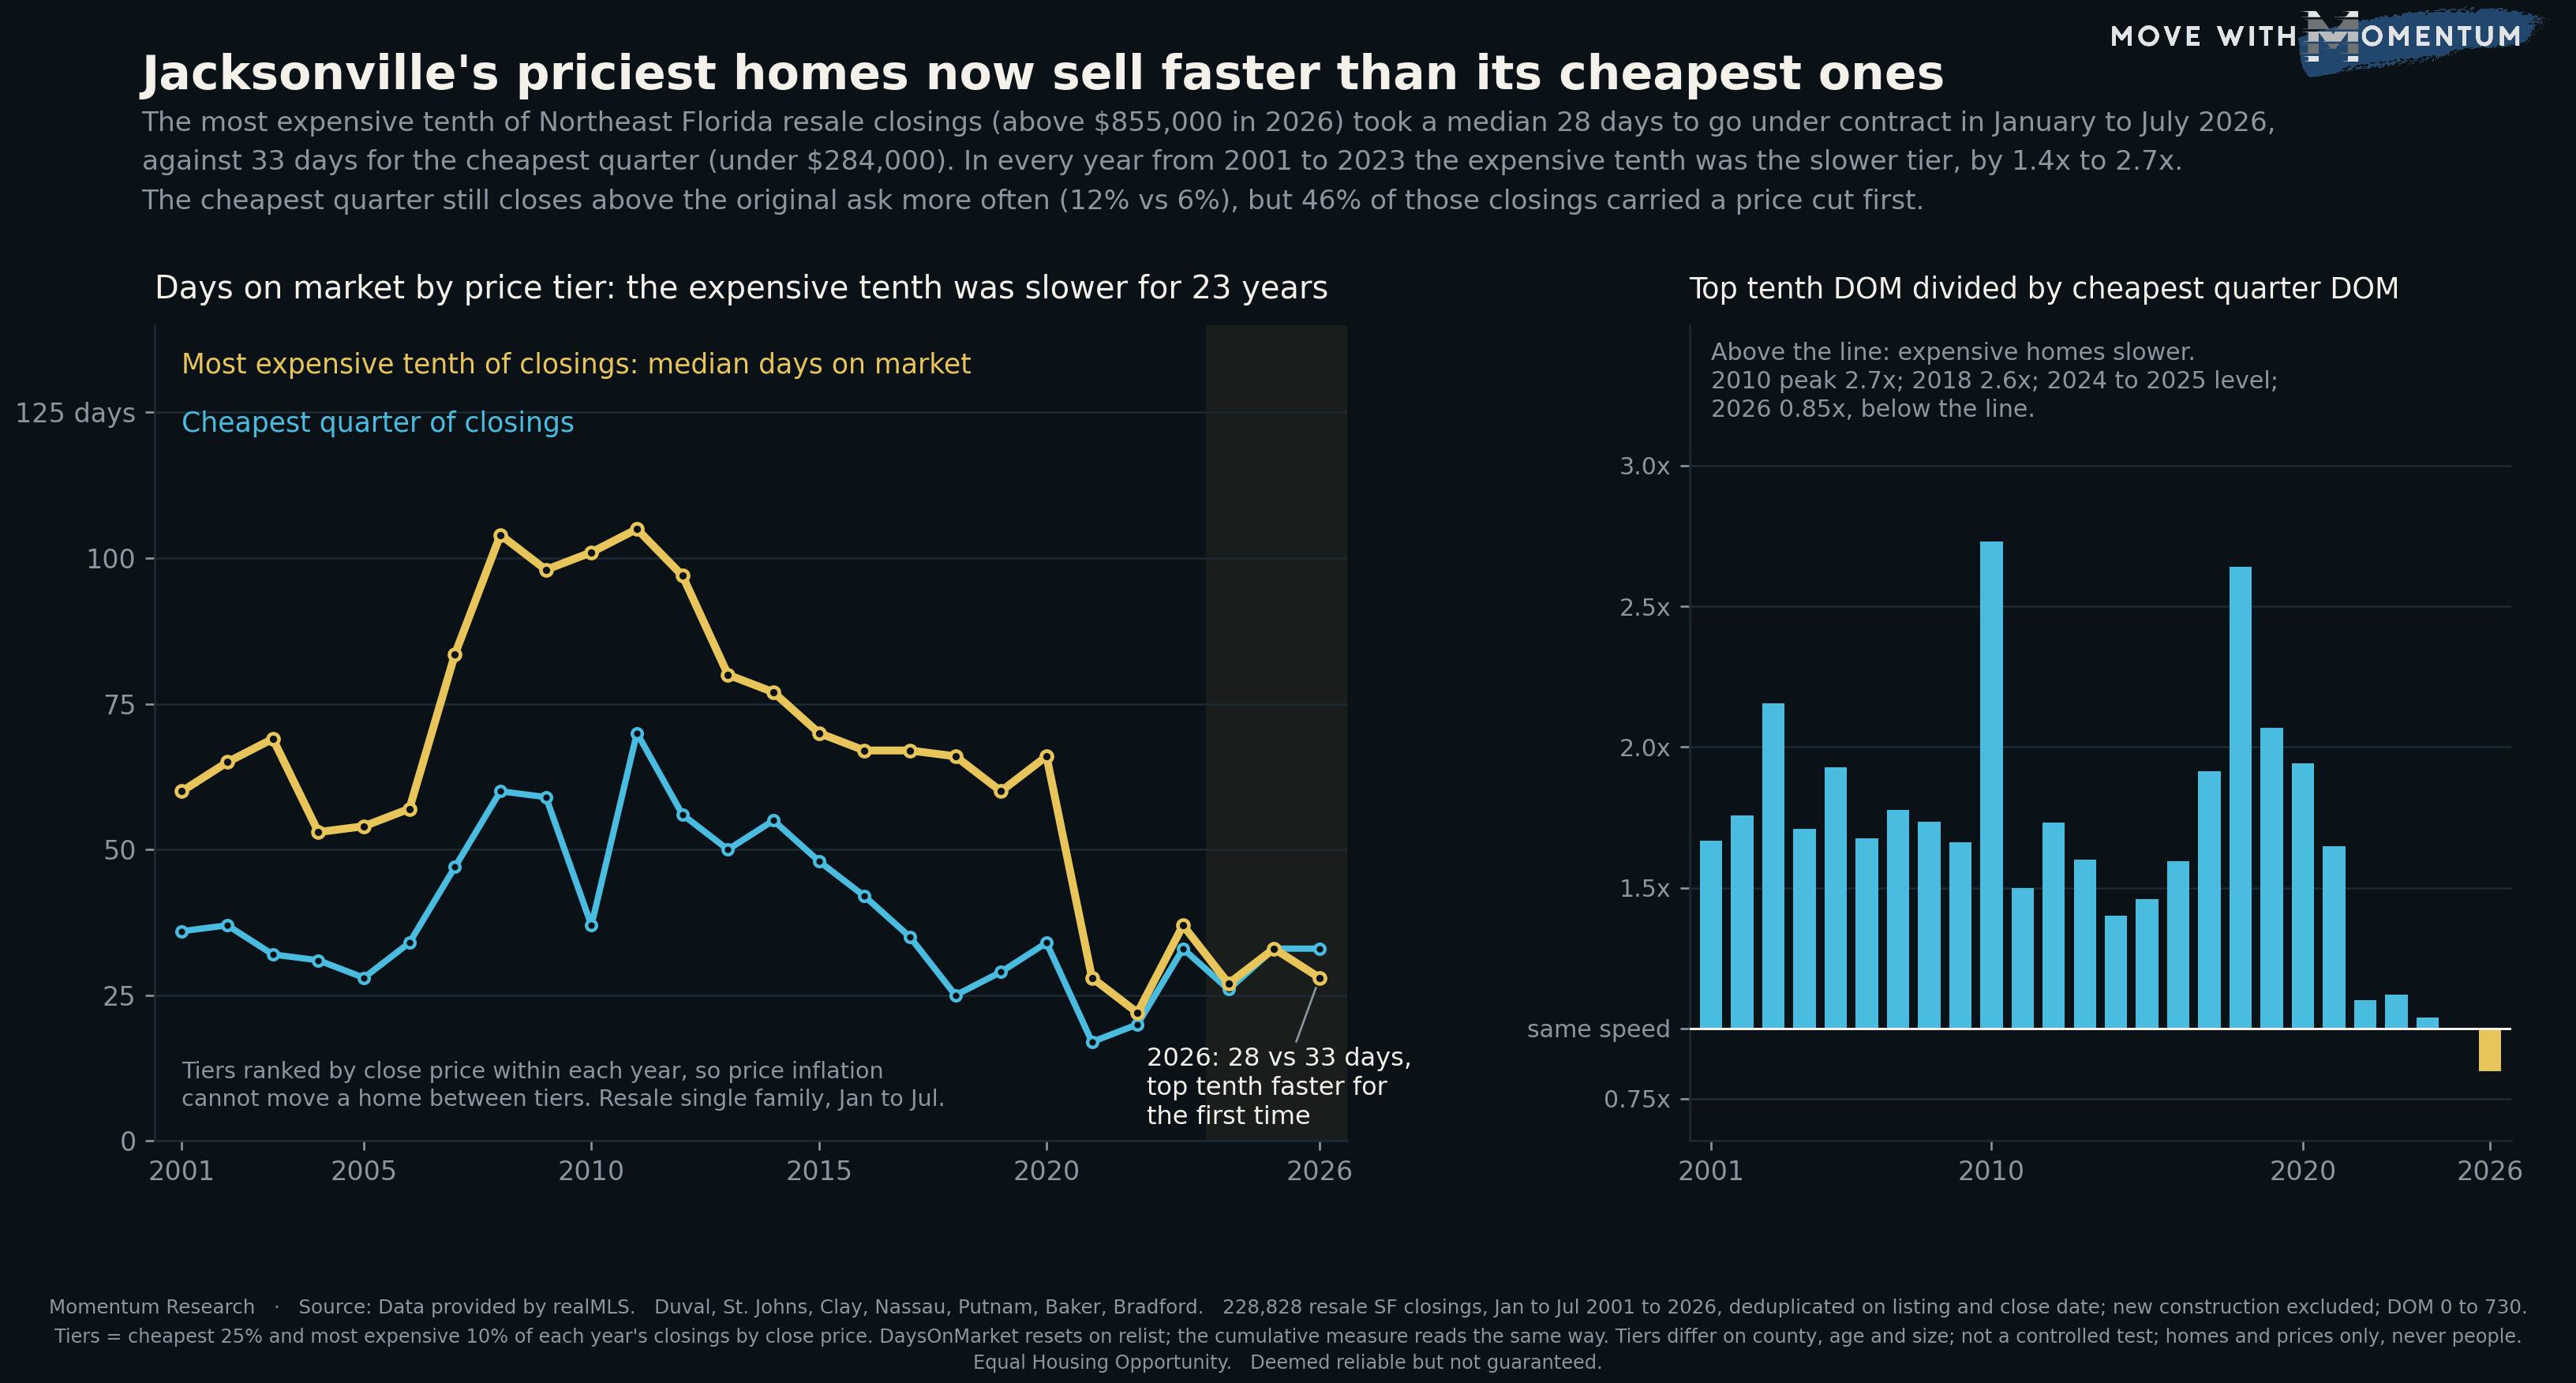
For as long as this archive runs, the rule in Northeast Florida has been that the expensive house waits. Fewer buyers can afford it, fewer lenders will write it, and a seller at the top of the market has usually been able to sit. Every year from 2001 to 2023, the most expensive tenth of resale single family closings in the seven realMLS counties took longer to go under contract than the cheapest quarter, by anywhere from 1.4 to 2.7 times. In the first seven months of 2026 that rule broke. The top tenth took a median 28 days. The cheapest quarter took 33. It is the first year in twenty-six that the priciest tier of the market has been the faster one.
A note on method, because this piece depends on it. Every closing is ranked by its close price against the other closings of its own year, so the "top tenth" in 2001 means homes above $275,000 and in 2026 it means homes above about $855,000. That keeps price inflation from moving a home between tiers. Every year uses January through July so a partial 2026 is compared with the same seven months of each earlier year, and new construction is excluded throughout because builder listings tend to enter the MLS at or near contract, which would flatter whichever tier they landed in.
Twenty-three years of the luxury lag
The left panel of the chart is the whole story in two lines. The gold line, the most expensive tenth, sits above the cyan line, the cheapest quarter, in every year from 2001 to 2023. In 2001 the gap was 60 days against 36. In the crash it widened to 101 against 37 in 2010, the widest ratio in the record at 2.7x, and the expensive tier did not get back under 70 days until 2015. In 2018, a strong year for the cheap end of the market, the ratio hit 2.6x again (66 days against 25). Even in the 2021 frenzy, when everything sold in about two weeks, the expensive tenth was still the slower tier at 28 days against 17.
Then the lines converge. In 2022 the ratio fell to 1.1x (22 against 20). In 2023 it was 1.12x. In 2024, 1.04x. In 2025, 1.00x: 33 days each. And in 2026 the gold line crosses under: 28 against 33, a ratio of 0.85. The right panel shows the same thing as one bar per year. Twenty-four bars above the line, one (2025) sitting on it, and one, the last, below it.
The fast end and the slow end
Medians can hide the shape, so here is the distribution. In 2026, 38.7% of top-tenth closings went under contract within fourteen days of listing. For the cheapest quarter the figure was 32.3%. That is also a first: in 2001 the same two numbers were 20.0% and 28.9%, in 2010 they were 8.5% and 29.2%, and in 2018 they were 15.1% and 36.6%. The quick sale used to belong to the cheap house. This year it belongs to the expensive one.
The mean tells the same story as the median (58 days for the top tenth against 61 for the cheapest quarter), and so does cumulative days on market, which does not reset when a listing is withdrawn and relisted: 30 against 37.
What the cheap end is still winning
None of this says the bottom of the market is weak on price. The cheapest quarter of 2026 closings still went above the original asking price more often than the top tenth, 12.2% against 5.7%, and it captured a median 94.2% of the original ask against 95.5%. Those are ordinary readings for both tiers.
What changed is how the cheap house gets to its closing. 46.4% of cheapest-quarter closings in 2026 carried at least one price cut before they sold, against 34.3% of the top tenth. That is the highest cut share for the cheap tier since the 2009 to 2012 stretch, and the ordering is reversed from the last strong market: in 2018 it was 27.2% for the cheap tier and 44.4% for the expensive one. So the cheap house is sitting longer and cutting more, then still often closing at or above whatever it was last listed for. The price cut field is only reliable from 2004 in this archive (the two list-price fields are not distinct before then), so the cut series is read from there.
The rivals we tested
County mix. The top tenth has drifted toward St. Johns County, from 37% of the tier in 2001 to 56% in 2026, and the cheapest quarter is still three-quarters Duval. If St. Johns homes simply sell faster, that alone could produce the crossing. It does not: inside Duval alone the 2026 ratio is 0.75 (24 days against 32), and inside St. Johns alone it is 0.67 (26 against 38). Clay is level at 1.03. Nassau still shows the old pattern at 1.52, on a thin sample of 55 top-tier closings.
Relisting. DaysOnMarket resets when a listing is pulled and relisted, and an expensive home that has been relisted twice could read as fast when it is not. CumulativeDaysOnMarket does not reset, and it reads 30 against 37 in 2026, the same direction.
Partial year. Every year is measured on the same January to July window. We also ran the full calendar years for 2023, 2024 and 2025, and there the top tenth was still a little slower (ratios of 1.29, 1.14 and 1.18), which is why 2024 and 2025 are described here as level in the seven-month window and not as inverted. The 2026 reading stands on the seven months that exist, and the full-year figure will be worth checking in January.
Age of the stock. The cheapest quarter is old and has been old the whole time: a median year built of 1957 to 1962 in every year of the series. The top tenth has gotten newer, from a median build year of 1992 in 2001 to 2004 in 2026. That is composition, not control; the data cannot separate the effect of price from the effect of age, and this piece does not try.
New construction. Excluded throughout. The builder share of closings is highest in the middle and upper tiers, and builder days on market is a different animal from resale days on market.
What the data cannot tell you
This is a comparison of two groups of homes sorted by their own close price and nothing more. It does not identify a cause. Rates, the buyer pool at each price, insurance costs on older homes, the share of cash purchases at the top and the condition of the stock at the bottom are all candidate explanations and none of them is in the record. The tiers differ on county, age, size and condition, and nothing here is controlled for any of them. Nothing on this page describes any person or household; it describes homes and the prices and timelines attached to them.
How agents can use this data
Four uses, all about pricing and timing property, none about anyone's choice of where to live:
- Reset the timeline expectation at the top of the market. A seller above $850,000 who is told to expect a long marketing period is being given the 2015 to 2020 answer. The 2026 median is 28 days, with 39% of those homes under contract inside two weeks. Price it on today's comps and today's clock.
- Budget the price cut at the bottom. Nearly half of sub-$285,000 closings this year had at least one reduction before they sold, and the median took 33 days. A seller in that band should hear the cut probability up front rather than three weeks in.
- Read days on market by tier, not for the region. The regional median for resale single family this year is 32 days, and it is nearly the same across all four tiers for the first time. That is the number to quote when a client asks whether "expensive homes sit," because the old gap that made that true has closed.
- Check the county before the tier. The inversion holds inside Duval and St. Johns and does not hold in Nassau. A comp set drawn across the whole region will mix two different clocks.
If you use any of these figures with a client, cite the source and the date: Momentum Research analysis of data provided by realMLS, January to July 2026. Market data moves, and a number without a date attached invites an argument you do not need to have.
What this measurement does not do
This is a days-on-market comparison of MLS-recorded resale single family closings sorted into price tiers within each year. It is not a controlled test and it does not identify a cause. It only sees homes sold through the MLS. Related work on the same archive looks at how the whole distribution of days on market has split between very fast and very slow sales, and at how far below the original asking price homes in each price band really close.
People also ask
How long do luxury homes take to sell in Jacksonville?
In January to July 2026 the most expensive tenth of resale single family closings in the seven realMLS counties, homes that closed above about $855,000, took a median 28 days to go under contract, and 38.7% of them did so within two weeks. That is faster than the cheapest quarter of closings (33 days, 32.3% inside two weeks) for the first time in the 26-year record. Inside Duval alone the top tenth took 24 days against 32; inside St. Johns 26 against 38.
Do expensive homes take longer to sell than cheap ones?
Historically yes, by a wide margin. From 2001 to 2023 the most expensive tenth of Northeast Florida resale closings took 1.4 to 2.7 times as many days on market as the cheapest quarter, with the widest gaps in 2010 (101 days against 37) and 2018 (66 against 25). The two tiers were level in the first seven months of 2024 and 2025, and in 2026 the expensive tier is the faster one. The data does not say why; it only shows that the old pattern has stopped holding.
Are cheap homes in Jacksonville selling below asking price?
The cheapest quarter of 2026 resale closings (under about $284,000) still closed above the original asking price more often than the top tenth, 12.2% against 5.7%, and captured a median 94.2% of the original ask against 95.5%. What changed is the road to the closing: 46.4% of those cheapest-quarter closings had at least one price cut before they sold, against 34.3% of the top tenth. In 2018 that read 27.2% and 44.4%, the other way around.
Method and limits
Source: data provided by realMLS. Closed resale single family sales in the authoritative counties of Duval, St. Johns, Clay, Nassau, Putnam, Baker and Bradford. Records are deduplicated on listing id plus close date. Closings under $10,000, listings flagged NewConstructionYN and DaysOnMarket values outside 0 to 730 are excluded. 228,828 closings remain across the fixed January to July window, 2001 through 2026; 9,959 of them in 2026.
Tiers are defined within each year: the cheapest quarter is every closing at or below that year's 25th percentile of close price, and the most expensive tenth is every closing above the 90th percentile. In 2026 those cutoffs are about $284,000 and $855,000. Days on market is the realMLS DaysOnMarket field; the cumulative check uses CumulativeDaysOnMarket. A price cut means the final list price was below the original list price; the two fields are not distinct in this archive before 2004, so the cut share is read from 2004 on. Above-ask means close price above original list price, computed on closings where the ratio falls between 0.4 and 1.6. Every figure is a median unless labelled a share or a mean.
The 2024 and 2025 full-calendar ratios (1.14 and 1.18) sit above the January to July ratios for those years (1.04 and 1.00), so seasonality is part of what the fixed window is holding constant; the 2026 inversion is stated for the seven months that exist. Nothing is controlled for county, age, size, condition or financing. Cause is not identified.
Related reading on the same archive: what a private pool adds to a Jacksonville home's price and the ongoing Jacksonville housing market tracker.
All figures on this page are per Momentum Research analysis of data provided by realMLS and are deemed reliable but not guaranteed. Equal Housing Opportunity.