
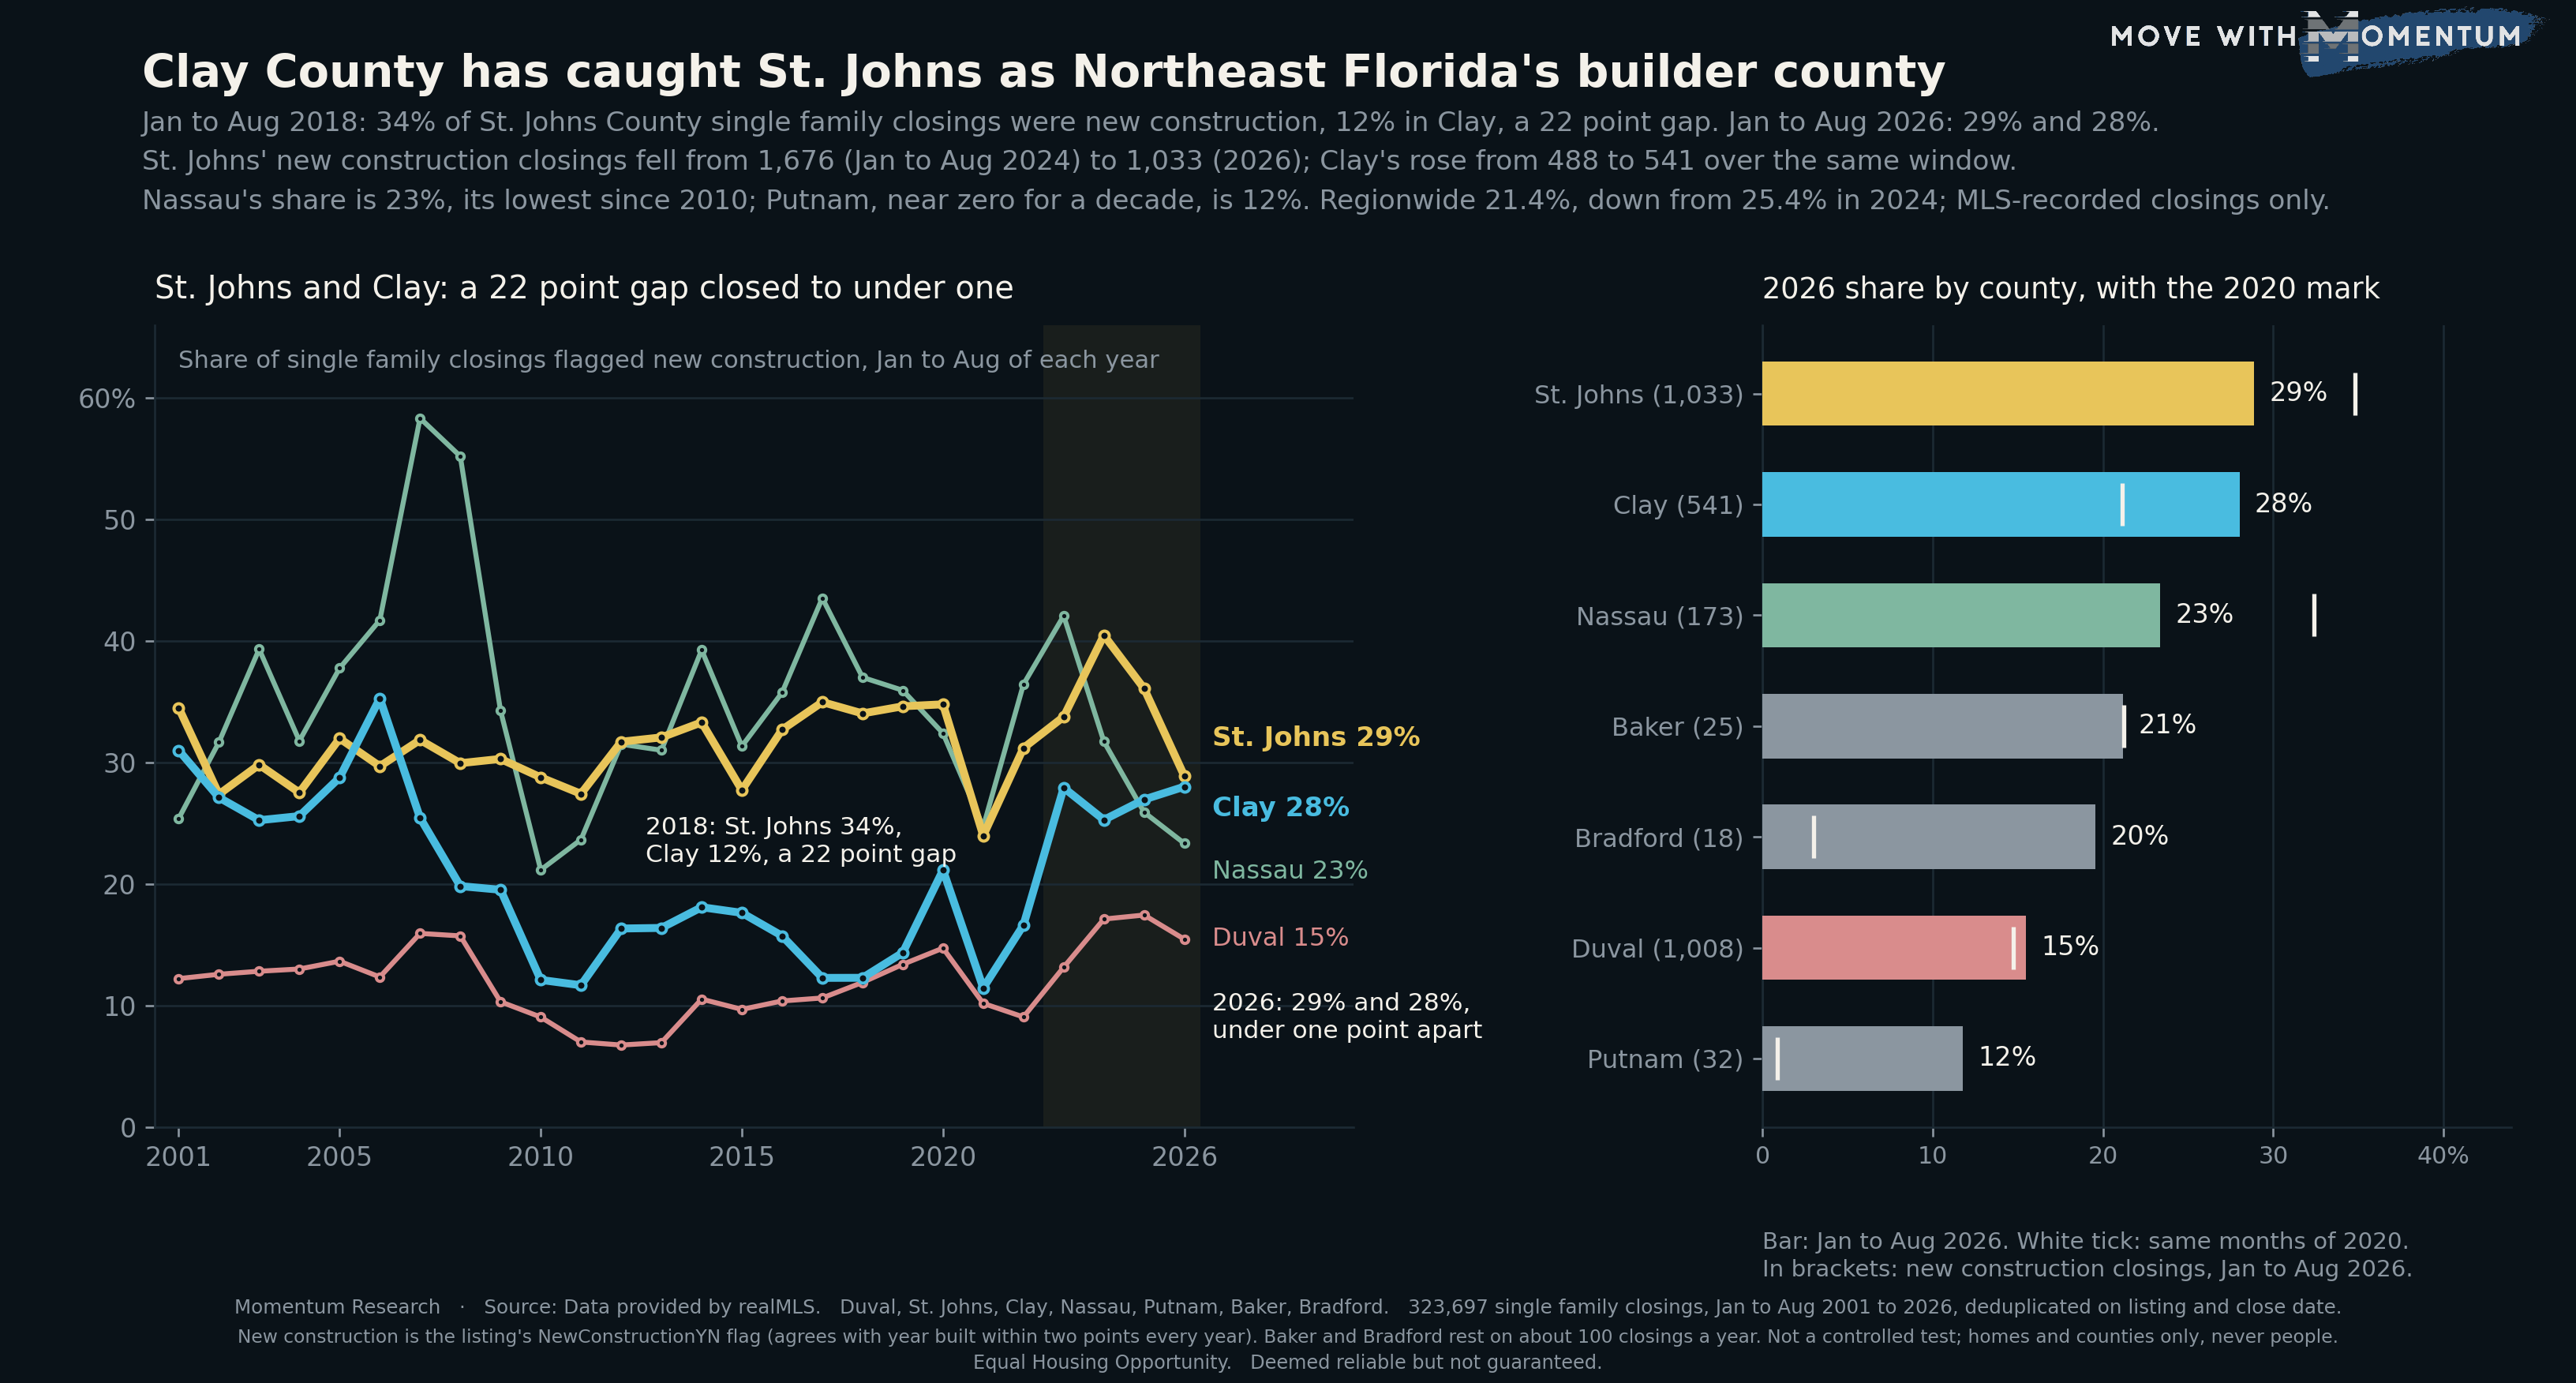
For most of the past fifteen years the question "where are the new homes closing in Northeast Florida" had a one-word answer: St. Johns. In January to August 2018, 34% of the county's single family closings were flagged new construction, against 12% in Clay County next door, a 22 point gap. This piece re-runs that count for every county and every year since 2001, and the 2026 read is the first since 2002 where the answer is two words. St. Johns is at 28.9%, Clay at 28.0%, a gap of under one point.
The move came from both directions. St. Johns' new construction closings fell from 1,676 in January to August 2024 to 1,033 in the same months of 2026, a 38% drop, while Clay's rose from 488 to 541. Nassau, which was the highest-share county in most years of the series, has fallen to 23%. Putnam, near zero for a decade, has settled at 10 to 13%. And regionwide the builder share is 21.4%, off its 2024 peak.
The 22 point gap
The left panel of the chart plots the share of each county's single family closings flagged new construction, January through August of every year so that the eight months of 2026 are compared with the same eight months of each earlier year. The gold line is St. Johns. It sits between 27% and 35% in every year from 2001 to 2023, dips to 24% in 2021 when a surge of resale closings diluted the builder share everywhere, and peaks at 40.5% in 2024, the highest read for St. Johns, Clay or Duval in the series.
The cyan line is Clay. It starts the series close to St. Johns (31% in 2001, 35% in 2006), then falls through the 2008 to 2011 downturn to about 12% and stays between roughly 12% and 21% from 2010 through 2022. In 2017 the St. Johns lead was 22.7 points (35.0% against 12.3%); in 2018, 21.8 points; in 2019, 20.3. The gap first narrowed in 2023 (33.8% against 27.9%), reopened to 15 points in 2024 when St. Johns spiked, and closed in 2026.
Both lines moved
Share is a ratio, so it pays to look at the counts. St. Johns' new construction closings in January to August ran 1,409 (2019), 1,545 (2020), 1,268 (2023), 1,676 (2024), 1,304 (2025) and 1,033 (2026). The 2026 count is the lowest in that run and 38% below 2024, on a resale base that also shrank (2,896 resale closings in 2020, 2,543 in 2026). Clay's ran 344 (2019), 519 (2020), 616 (2023), 488 (2024), 530 (2025) and 541 (2026), on a resale base that fell from 1,935 to 1,390. Clay's share rose because its builder count held while its resale count fell by more than a quarter; St. Johns' share fell because its builder count fell faster than its resale count.
The composition of the region's builder closings shifted with it. In January to August 2020, St. Johns held 41% of the seven counties' new construction closings, Duval 36% and Clay 14%. In 2026 it is St. Johns 37%, Duval 36% and Clay 19%. No single community is driving Clay's number: its largest new construction subdivision in the 2026 window accounts for 13% of the county's builder closings, against 9% for the largest in St. Johns.
Nassau down, Putnam up
The green line is Nassau, and for most of the series it was the highest-share county on the chart: 58% in 2007, 44% in 2017, 42% in 2023. It read 32% in 2024, 26% in 2025 and 23% in 2026, its lowest since 2010, as its new construction closings fell from 430 (2023) to 173. One subdivision accounts for 27% of Nassau's 2026 builder closings, so this is a county whose share moves with a small number of communities.
Putnam is not on the line chart but is on the ranked bars. From 2009 to 2022 its new construction share was under 4% in every year and under 2% in most of them (three builder closings in all of January to August 2020). Since 2023 it has read 9.9%, 11.4%, 13.3% and 11.8%, on 32 to 44 closings a year. Small numbers, but a decade of near zero followed by four years above 10% is a change in kind, not noise.
Duval, the rose line, is the largest county by volume and the steadiest by share: between 7% and 18% in every year of the series, 15.5% in 2026 on 1,008 new construction closings. Baker (21%) and Bradford (20%) sit high on the 2026 ranking, but on 25 and 18 builder closings respectively; their shares should be read as small-count figures.
Prices on either side of the line
In January to August 2026 the median new construction closing in Clay was $368,000 against a $355,000 resale median; in Duval, $334,667 against $332,000. In St. Johns the order flips: the median builder closing was $550,000 and the median resale $585,000, and Nassau reads $494,090 against $457,750. This is not a like-for-like premium (size, lot and location are not controlled), but it says the builder product closing in Clay and Duval sits near the middle of each county's resale price range, while in St. Johns it sits below it. The regional new-home price premium has been examined separately on this archive.
The rivals we tested
Flag reliability. New construction is the listing's NewConstructionYN field. As a check, the share of closings whose year built is the close year or the year before tracks the flag within about two points in every year of the series (21.4% against 21.4% in 2026), so the flag is not an artifact of how agents fill in the form.
Partial year. Every year is measured on January through August, the last complete month, so 2026 is compared with the same eight months of each earlier year. Builder closings have a different seasonal pattern from resale closings, which is exactly why a fixed window matters here.
Denominator. A county's share can rise because resale closings fell. Clay's did (1,935 to 1,390 since 2020), so the counts are reported alongside the shares throughout. Clay's 2026 builder count (541) is also above its 2020 count (519), so the share gain is not purely a resale effect.
Single community. The top subdivision share of each county's builder closings is computed for every year. Clay's largest in 2026 is 13% of its builder closings; Nassau's is 27%, which is why Nassau's line is the jumpiest on the chart.
MLS coverage. This is the share of MLS-recorded closings. Builders sell many homes without ever entering them in the MLS, and the share of builder sales that get entered can change over time and differ by county. The figures here are the MLS view of the market, not a count of every new home sold.
What the data cannot tell you
This is a count of closings by county and by a new construction flag. It says nothing about any county beyond those figures, nothing about who lives anywhere, and nothing about whether any home is a good or bad purchase. It does not say why builders are closing more homes in one county than another; land supply, permitting, lot prices, builder decisions and the resale pipeline all move the ratio, and none of them are in the data.
How agents can use this data
Four uses, all about pricing and searching for property, none about anyone's choice of where to live:
- Update the comp set for Clay County listings. Roughly 28 in every 100 single family closings in Clay this year is a builder closing, up from 12 in 100 in 2018. A resale pricing analysis in Clay that ignores new construction comps is now missing more than a quarter of the closings; the same analysis in Duval is missing about one in seven.
- Expect fewer builder comps in St. Johns than the last two years supplied. St. Johns' builder closings are down 38% from the 2024 window. A comp search that leaned on new construction closings in 2024 will find a thinner set in 2026, and the median builder closing there ($550,000) now sits below the resale median ($585,000).
- Treat the Nassau share as community-driven. One subdivision is 27% of the county's 2026 builder closings. A Nassau new construction comp should be checked for which community it came from before it is applied to a home elsewhere in the county.
- Put Putnam builder closings on the map. There were three in January to August 2020 and 32 in the same months of 2026, with a median close price of $296,250. That is a comp category that did not exist in the county five years ago.
If you use any of these figures with a client, cite the source and the date: Momentum Research analysis of data provided by realMLS, January to August 2026. Market data moves, and a number without a date attached invites an argument you do not need to have.
What this measurement does not do
This is a count of MLS-recorded single family closings by county and new construction flag. It is not a controlled test and it does not identify a cause. Related work on the same archive looks at how each county's share of the region's closings has shifted, and at how long standing builder inventory takes to sell against resale.
People also ask
Which Northeast Florida county has the most new construction home sales?
By count, St. Johns County: 1,033 single family closings flagged new construction in January to August 2026, against 1,008 in Duval and 541 in Clay. By share of the county's own closings, St. Johns (29%) and Clay (28%) are within one point of each other, followed by Nassau (23%), Baker (21%), Bradford (20%), Duval (15%) and Putnam (12%). Baker and Bradford record about 100 closings a year in the window, so their shares move on small counts. These are MLS-recorded closings only; builder sales that never enter the MLS are not counted.
What share of Jacksonville home sales are new construction in 2026?
Across the seven realMLS counties, 21.4% of single family closings in January to August 2026 carried the new construction flag, down from a 25.4% peak in the same months of 2024 and 23.9% in 2025, and about level with 2020 (21.3%). The low point of the series was 2021, at 14.1%, when a surge of resale closings diluted the builder share. In Duval County alone the 2026 share is 15.5%, with 1,008 new construction closings.
Has Clay County ever had a higher new construction share than St. Johns?
Yes, once in the 26-year series: in January to August 2006 Clay read 35% and St. Johns 30%. The two counties were within four points of each other in 2001, 2002, 2004 and 2005. From 2010 to 2022 St. Johns led by 10 to 23 points every year, peaking at a 22.7 point gap in 2017 (35.0% against 12.3%). The gap was 5.8 points in 2023, 15.2 in 2024, 9.1 in 2025 and 0.9 in 2026.
Method and limits
Source: data provided by realMLS. Closed single family sales in the authoritative counties of Duval, St. Johns, Clay, Nassau, Putnam, Baker and Bradford. Records are deduplicated on listing id plus close date. 323,697 closings across the fixed January to August window, 2001 through 2026; 13,249 of them in 2026.
New construction is the listing's NewConstructionYN flag. A county's share is its flagged closings divided by all its single family closings in the window. The year-built check counts closings whose YearBuilt is the close year or the year before; it tracks the flag within about two points in every year. Top subdivision share is the largest SubdivisionName among a county's flagged closings, divided by that county's flagged closings. Medians are of ClosePrice. Baker and Bradford record about 100 closings a year in the window.
Nothing is controlled for size, age, lot, location within the county or financing. Cause is not identified. Builder sales that never enter the MLS are not counted, and the share of builder sales entered in the MLS may differ by county and year. Counties are described by their closing counts and shares only.
Related reading on the same archive: how many ZIP codes still have a median resale price under $300,000 and the ongoing Jacksonville housing market tracker.
All figures on this page are per Momentum Research analysis of data provided by realMLS and are deemed reliable but not guaranteed. Equal Housing Opportunity.