
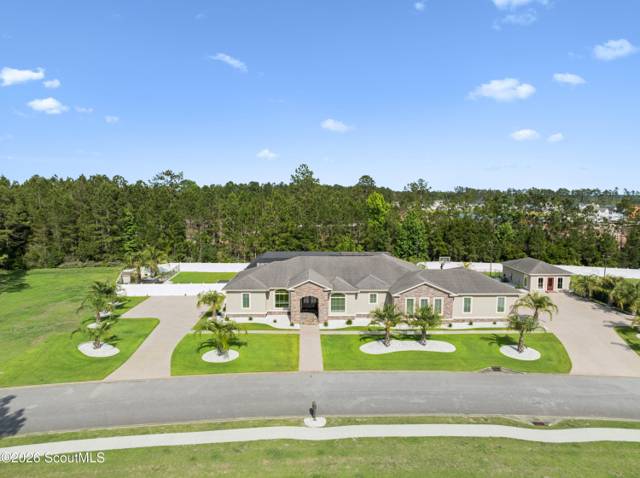
Glynn County
Housing Market
Median sale price $457,311, with homes going under contract in about 116 days, 250 homes on the market.
Momentum
Your exact situation run against today's numbers: true comps, negotiation targets, and the off-market homes portals never show.
Selling instead? See what your home is worth today →

Housing Market Analyst
Inventory sits at 10.0 months of supply — heavy by the 3-to-6-month balanced benchmark, and 23% of listed homes are already under contract. sellers are still collecting 96.3% of asking. Taken together, the data leans toward buyers — leverage is real for those ready to use it.
Who has leverage right now
Leverage scores are derived from the Momentum Score (supply, demand, speed, pricing power, and trend). Right now the data favors buyers.
- Negotiating power — buyers gain ground as 23% of inventory sits under contract.
Derived from current Glynn County data, not a prediction or guarantee. Markets move; talk to an agent before acting on any single reading.
One inventory number hides four different markets
Months of supply = active listings ÷ monthly sales pace, bucketing communities by their recent median. 3–6 months is the balanced band.
Where Glynn County is hot — and where it isn't
Each dot is a community (54 shown, sized by sales volume rank). Click any dot to open its full neighborhood guide.
The read on Glynn County
The median sale price across Glynn County currently stands at $457,311. Buyers are paying a median of $237 per square foot. The typical home goes under contract in about 116 days. Homes are selling for about 96.3% of their original asking price.
There are 250 active listings on the market, with 67 more already under contract. With 300 closed sales over the trailing 12 months (250 listings divided by 300 / 12), that works out to 10.0 months of supply — a buyer-leaning market by the 3-to-6-month balanced band.
Weighing supply, demand, speed, pricing power, and trend together, the Momentum Score for Glynn County is 34 of 100 — soft market territory. This page recalculates every day as new MLS data lands, so the numbers above reflect the market as of November 19, 2026.
Where the market is heading
Median price · daily recalculation
The calls we’re making from today’s data
The most crowded shelf in the market. Sellers here are competing hardest — which means overpaying in this band is the most avoidable mistake in Glynn County right now.
The tightest band — sellers in this range hold the most leverage, and buyers should walk in with financing done and terms clean.
Buyers: ask for concessions — rate buydowns and repair credits are back on the table. Sellers: presentation and the first two weekends decide your outcome; price accordingly.
Generated from today’s data by Momentum’s analysis engine and reviewed on a rolling basis by our broker team.
Neighborhoods on the move
| Carriage Gate PlantationBrunswick | $457K | 18 |
| Old TownBrunswick | $455K | 17 |
| Hampton PlantationSt. Simons Island | $1.12M | 10 |
| St. Simons HeightsSt. Simons Island | $625K | 10 |
| The Lakes at North GlynnBrunswick | $339K | 9 |
| Sea PalmsSt. Simons Island | $895K | 53 days |
| Hampton PlantationSt. Simons Island | $1.12M | 70 days |
| Oak Grove IslandBrunswick | $524K | 102 days |
| Carriage Gate PlantationBrunswick | $457K | 116 days |
| Country WalkBrunswick | $449K | 122 days |
Cities in Glynn County
ZIP codes
Most active communities
Put this data to work
The questions people actually ask
Should I buy a house in Glynn County right now?
The data says conditions currently favor buyers in Glynn County — the Momentum Score reads 34/100 with 10.0 months of supply. For buyers that means preparation over hesitation: well-priced homes still move fast, but there is more room to negotiate than a year ago. The right timing always depends on your rate, your equity, and how long you plan to stay — not just the market.
Which Glynn County neighborhoods are most competitive?
Measured by speed of sale, the fastest-moving tracked communities right now are Sea Palms (53 days); Hampton Plantation (70 days); Oak Grove Island (102 days) — homes there go under contract well ahead of the market-wide pace of 116 days.
Glynn County housing market FAQ
How is the housing market in Glynn County right now?
As of November 19, 2026, the Glynn County housing market favors buyers: the median sale price is $457,311, 250 homes are for sale against 300 sales in the last 12 months, which is 10.0 months of supply, and the typical home goes under contract in about 116 days.
How much is a house in Glynn County?
The median home sold for $457,311 in Glynn County over the last 12 months, about $237 per square foot; asking prices on the 250 current listings run from well below to well above that, and the community pages linked below show what each neighborhood actually sells for.
Is it a good time to sell a house in Glynn County?
By the numbers, sellers in Glynn County are getting 96.3% of asking price and going under contract in about 116 days with 10.0 months of supply. Under three months of supply generally favors sellers, three to six is balanced, and over six favors buyers. Whether it is a good time for you depends on what you paid and where you are going next, which is a conversation with an agent, not a chart.
What is the median home price in Glynn County?
The median sale price in Glynn County is currently $457,311, based on MLS sales data updated November 19, 2026.
Is Glynn County a buyer's or seller's market right now?
The data currently favors buyers. Glynn County scores 34 of 100 on the Momentum Score, with 10.0 months of housing supply. Conditions change; this page updates daily.
How long do homes take to sell in Glynn County?
The typical home in Glynn County goes under contract in about 116 days, per current MLS data.
How many homes are for sale in Glynn County?
There are approximately 250 active listings in Glynn County as of November 19, 2026.
Momentum agents use this intelligence every day to price listings and write winning offers across Glynn County. Talk through what the numbers mean for your move.
Every number on this page is computed directly from licensed Georgia MLS feeds, recorded public sales and public records — nothing is manually adjusted or estimated by hand. Medians use recorded closed sales; supply figures use the MLS listing counts from the last data refresh (date below); the Momentum Score methodology is summarized .
Analyst oversight: Jon Brooks — Co-Founder, Momentum Realty · CEO, Momentum Research · Housing Market Analyst · methodology reviewed quarterly · Last data refresh: November 19, 2026 at 12:58 PM ET
Statistics on this page are computed automatically from licensed MLS feeds and public data sources (public records) and summarized without manual review. Figures are estimates based on recent recorded activity, are deemed reliable but not guaranteed, and should be verified with a licensed agent before making decisions. This page does not constitute an appraisal or an automated valuation of any specific property. Momentum Realty is licensed in Florida and Georgia. Equal Housing Opportunity.
Get the Golden Isles Market Pulse every month
One email when the new edition is out: median price and the same-home change, days on market, months of supply, price cuts and what failed to sell, computed from MLS closed records. See the current edition. Unsubscribe any time.
<a href="https://movewithmomentum.com/market/glynn-county-ga">Glynn County, GA Housing Market: Median $472K — Momentum Realty</a>