

Port Tampa City Map
Homes for Sale in Tampa, FL
All 3,764 homes for sale in Tampa, FL · median $435,000 · 54 homes for sale in 33613 · Hillsborough County homes for sale
True comps, carrying-cost math, and listings before the portals.
Market Heat
As of October 2026, Port Tampa City Map in Tampa, FL has 19 homes for sale and 7 pending, asking from $265,000 to $899,000 (median $625,000). Over the 12 months ending 2026-09-20, 65 recorded sales closed at a median of $535,000, $272 per square foot, a median 46 days on market, sellers accepting 94% of original asking (-13% versus the prior year). Homes listed or recently sold were built 1946 - 2026 with 3 new construction; 5 of 38 report an HOA (median $61/mo); 22 of the 38 geocoded homes sit in a FEMA special flood hazard zone (median elevation 6 ft). At the median price and Hillsborough County's FY2025-26 rate of 15.73 mills, annual property tax runs about $8,410 ($7,790 with the full homestead exemption).
Last 30 days in Port Tampa City Map: 5 new listings (median asking $789,000), 7 under contract right now, 6 closed sales (median $504,500). As of October 24, 2026, Listings courtesy of Stellar MLS as distributed by MLS GRID.
Homes For Sale Right Now in Port Tampa City Map
Live MLS inventory for Port Tampa City Map. Every active listing, what is under contract right now, and the last 12 months of closed sales, refreshed twice a day. Closed comps beat an algorithm's guess every time.
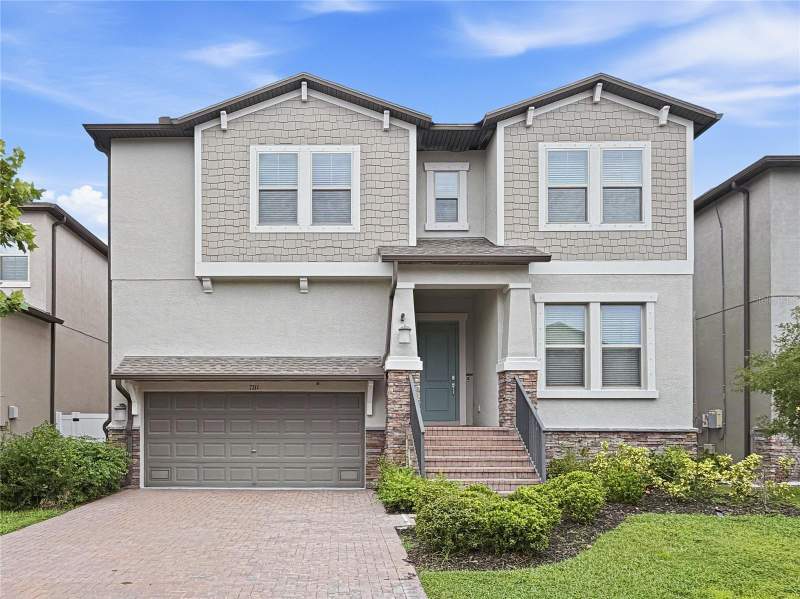 Active · 27 daysTop listing
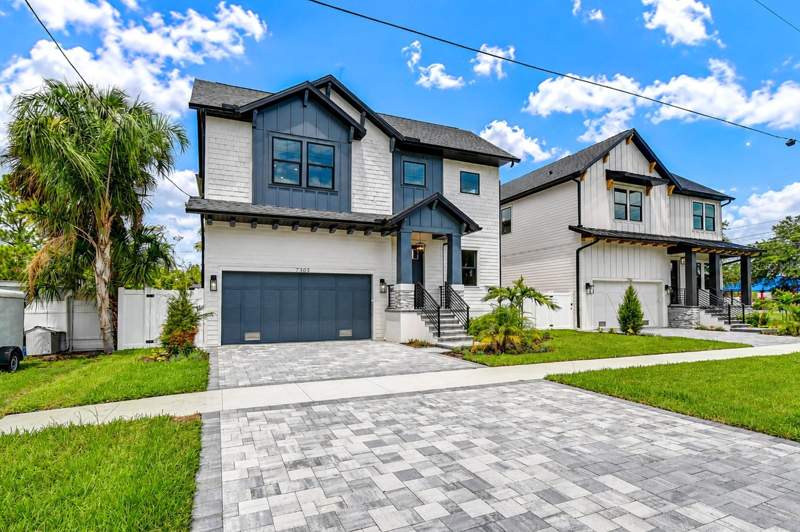 Active · 90 days
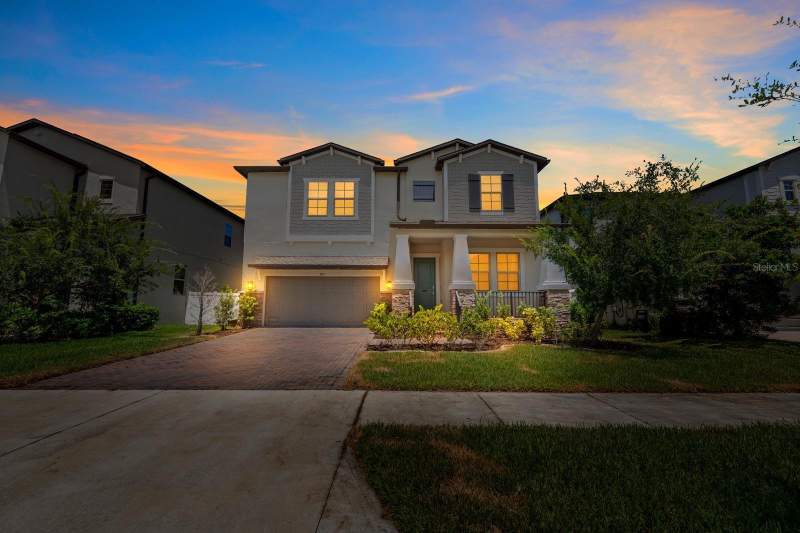 Active · 84 days
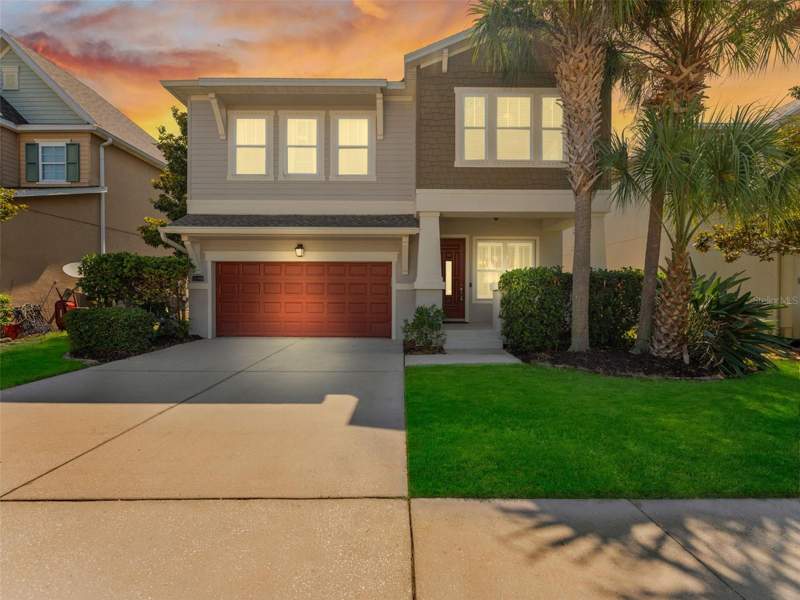 Active · 149 days
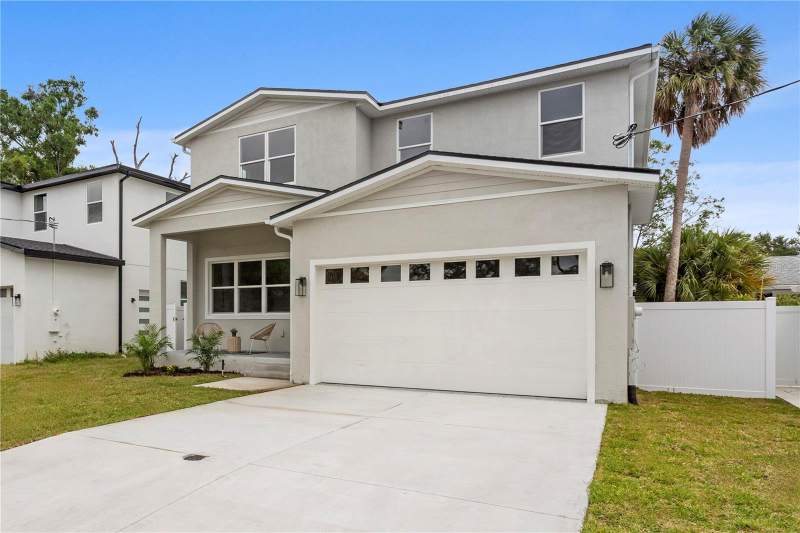 Active · 174 days
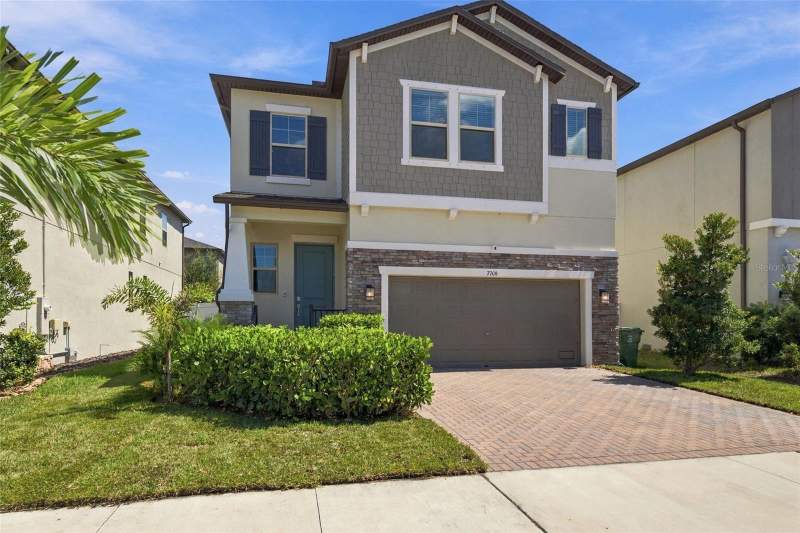 Active · 20 days
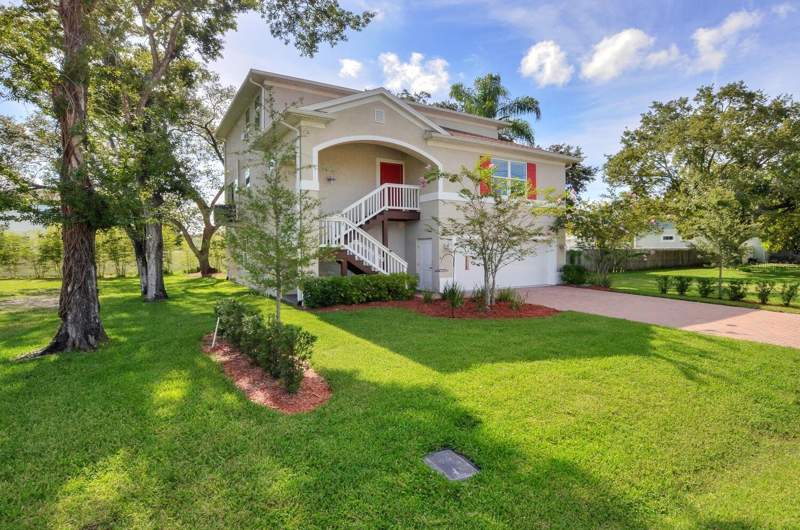 Active · 24 days
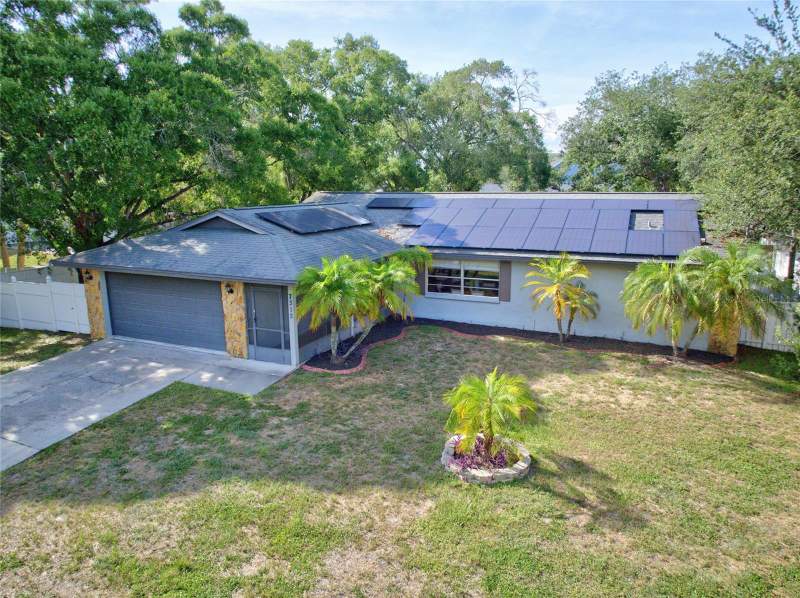 Active · 106 days
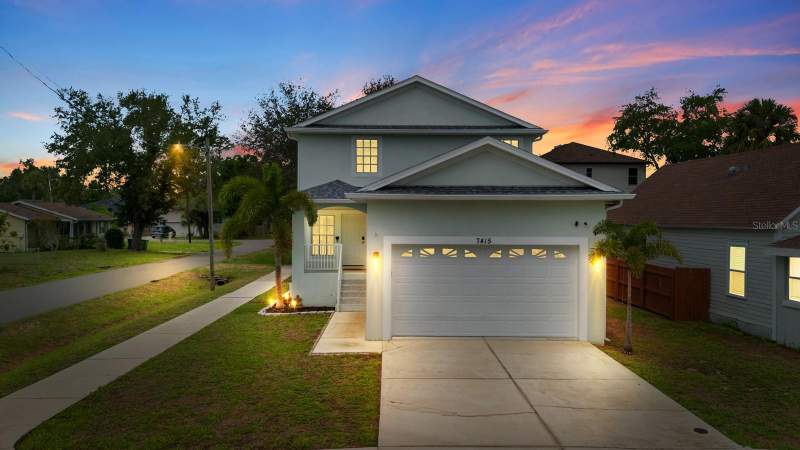 Active · 140 days
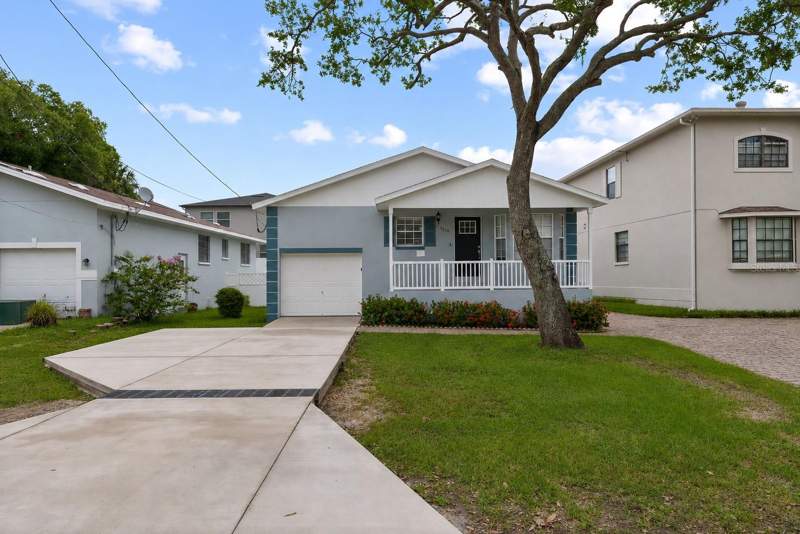 Active · 61 days
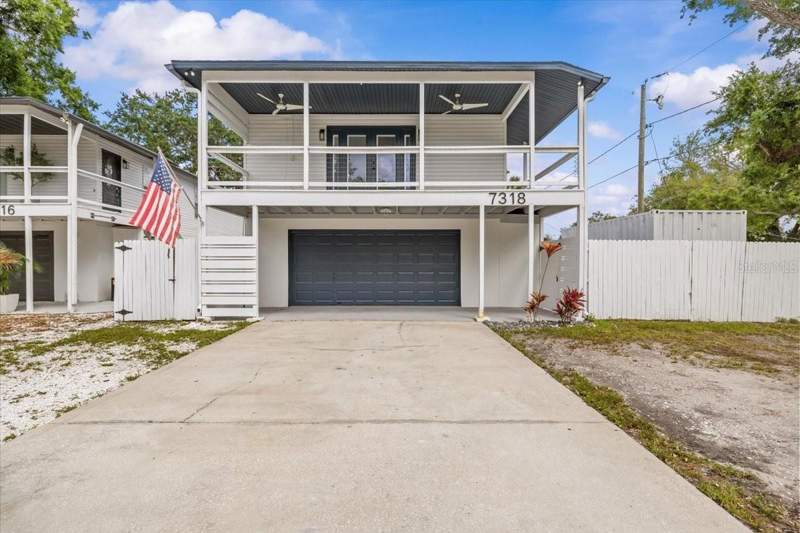 Active · 47 days
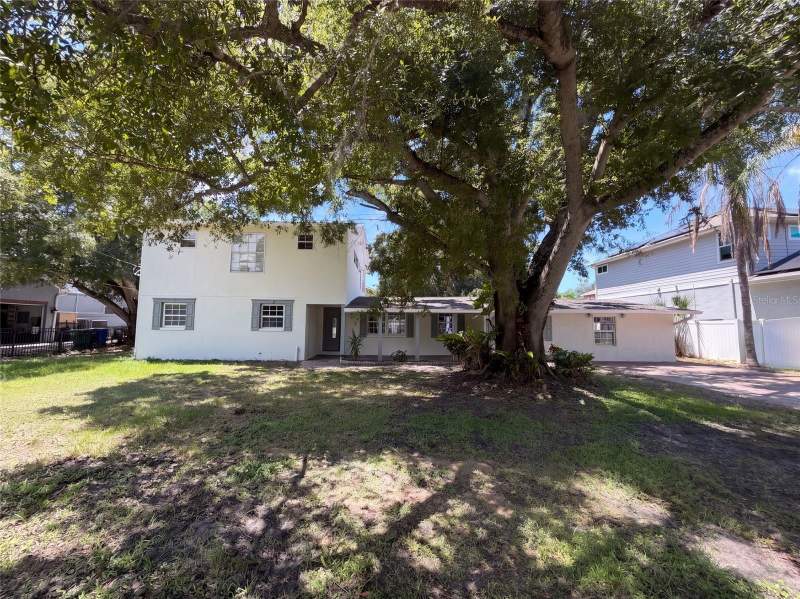 Active · 61 days
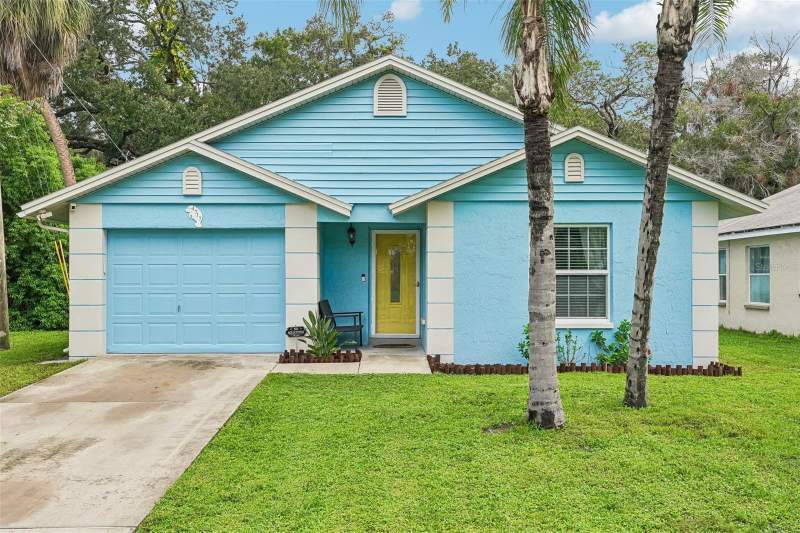 Active · 59 days
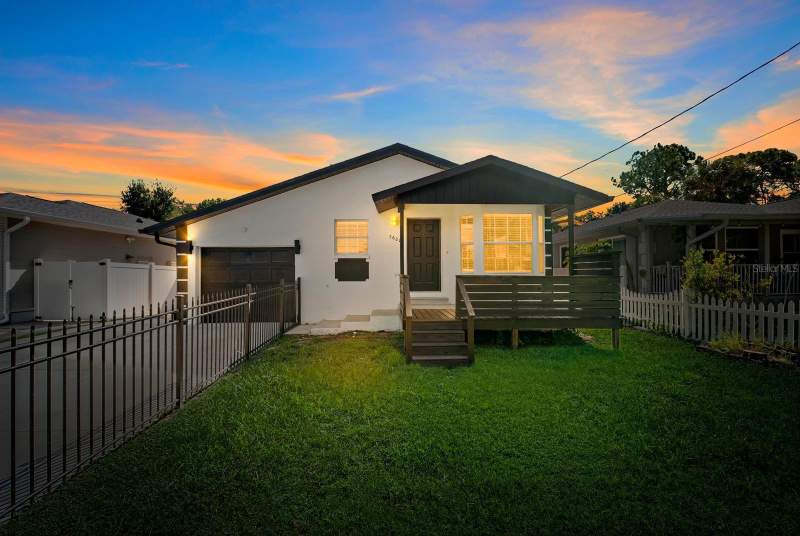 Active · 30 days
Active and pending Port Tampa City Map listings as of 2026-10-23, priced high to low. Based on Stellar MLS data distributed by MLS GRID for the period 2005 through 2026. Tap any home to ask about it.
Port Tampa City Map right now
🟡 Balanced market. 3.2 months of supply and 25% of the inventory already under contract put buyers and sellers on roughly even footing.Why it matters: months of supply is how long today's inventory would last at today's sales pace; under-contract share is the portion of homes for sale that already have a buyer.Momentum Research analysis of Stellar MLS records, as of September 20, 2026. Confidence: Very High (28 active and pending listings, 65 closed sales in 12 months).
🔴 Off the recent peak. The trailing-12-month median ($535K) is down 13.4% from the prior 12 months ($618K) and up 454% since 2012.Momentum Research, record-level Stellar MLS closed sales, 12-month windows ending September 20. Confidence: Very High (65 and 63 sales in the two windows).
Jump to: Price history & scorecard · Homes for sale · Schools · FAQ
· Updated October 24, 2026 · Live data: Stellar MLS, refreshed twice daily · MLS facts carry their source; interpretation lines are Momentum Research · Data sources & freshness
The 60-Second Overview
Port Tampa City Map market snapshot (as of September 20, 2026): the median sale price is about $535K ($272 per sq ft over the trailing 12 months of closed sales), a median 46 days on market for closed sales, and 3.2 months of supply, a balanced market. The trailing-12-month median is down 13% from the prior 12 months and up 454% since 2012, computed from record-level Stellar MLS closed sales (65 closings in the current window).
In ZIP 33613 (Tampa), 240 homes closed in the last 12 months at a median of $410K ($247/sq ft), down 6.3% year over year, with a median 39 days on market. Right now 74 active and 18 pending listings put supply at about 4.3 months - a balanced market. See the live ZIP 33613 housing market and the Hillsborough County market.
County records show 85 qualified sales in Port Tampa City Map across 2024 - 2025 (53 in 2024, 32 in 2025), median $660,000 - the last recorded sale per parcel on the Florida DOR 2025 assessment roll, independent of the MLS.
Flood zones in Port Tampa City Map: of 21 listing addresses checked against the FEMA National Flood Hazard Layer, 100% are in an A-series high-risk zone where flood insurance is required with a federally backed mortgage. Individual parcels vary - verify any specific address at msc.fema.gov. See flood zones by neighborhood in Tampa.
Port Tampa City Map is a community of 816 homes in Tampa, Hillsborough County, built between 1890 and 2024 (median 2001), with a median living area of about 1,870 square feet. 60% of parcels are homesteaded, the owner-occupancy proxy in the Florida DOR assessment roll (2025 roll, public records).
The setting & the homes.
Aerial and on-site photos of Port Tampa City Map. Swipe to explore the community.
Swipe or use the arrows → tap any photo to enlarge
Port Tampa City MapPort Tampa City MapPort Tampa City MapPort Tampa City Map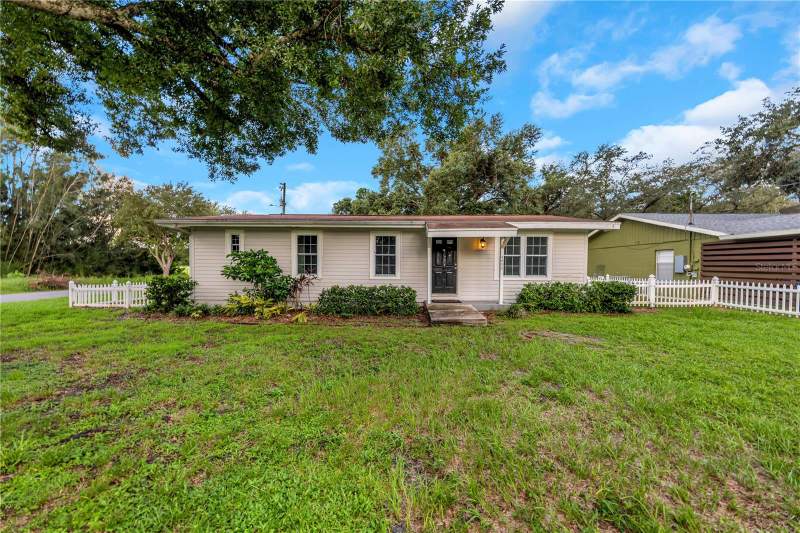 Port Tampa City MapPort Tampa City Map
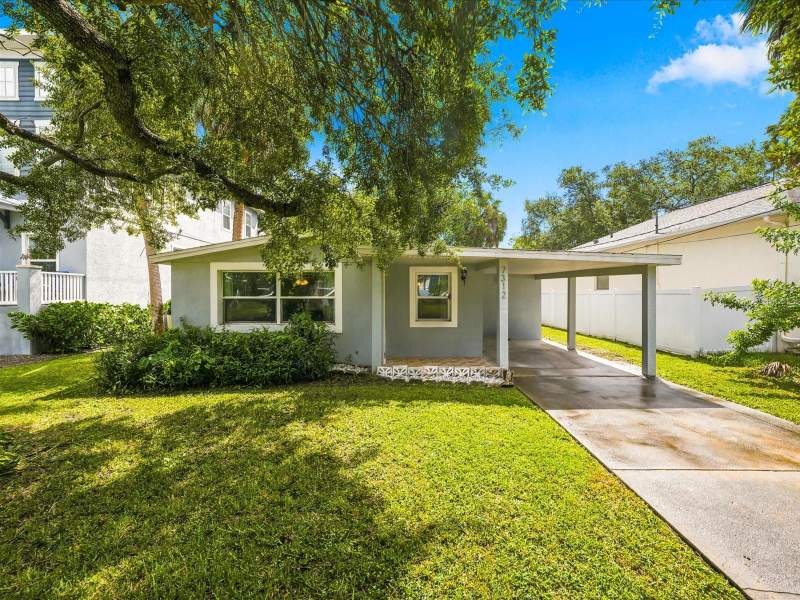 Port Tampa City MapPort Tampa City Map
Photos from Stellar MLS listings in Port Tampa City Map; content deemed reliable but not guaranteed.
Price History: What Homes Here Have Actually Sold For
Median sale price over the trailing 12 months ending September 20 of each year, from record-level Stellar MLS closed sales. Same methodology as every appreciation figure on this page: the 2026 point ($535K) IS the median in the snapshot above, and the move from 2025 ($618K) IS the -13.4% one-year change.
Windows contain 0 to 84 sales each (65 in the current window); every figure carries its sample size. Based on Stellar MLS data distributed by MLS GRID for the period 2005 through 2026. Deemed reliable but not guaranteed.
The real cost & risk here
Before the list price, the Florida math the portals skip. These are Hillsborough County typicals — your exact home, flood zone, and insurance quote will vary, so verify each before you offer.
Check it for your address: look up your flood zone (FEMA) · insurance by county · true-cost calculator · Hillsborough County scorecard.
County typicals from Momentum’s Florida housing data (Zillow & Realtor.com aggregates, Census, FRED), updated monthly; insurance modeled. Flood zone is property-specific — always confirm via FEMA.
Port Tampa City Market Scorecard
Port Tampa City is currently a seller's market. About 2.9 months of supply, a median asking price of $625,000, and homes go under contract in about 61 days.
Typical home value in the 33616 ZIP is $405,306, about 7.8% below the Florida norm (Zillow Home Value Index).
Go deeper: ZIP market scorecard · county scorecard · true cost calculator · affordability calculator.
Live data: realMLS, refreshed twice daily. Typical value: Zillow Research. Market metrics only; these describe homes for sale and recent sales, not residents.
Port Tampa City Map on the map.
Every active, pending, and recently sold home, plotted. Toggle the layers and tap a home for the details.
Listing locations from Stellar MLS. Map data © OpenStreetMap contributors.
Life at Port Tampa City Map
- Security Lights · reported on 3 of 16 listings
- Community Mailbox · reported on 2 of 16 listings
- Secured Garage/Parking · reported on 1 of 16 listings
- Special Community Restrictions · reported on 1 of 16 listings
Community amenities as reported across Stellar MLS listings in this community; deemed reliable but not guaranteed. Verify current amenities and access with the HOA.
Schools
- Hillsborough County Public Schools
- Verify the zoned schools by address
- Magnet and choice options may be available
- West Shore Elementary School · Elementary
- Monroe Middle School · Middle
- Robinson High SchoolFLDOE grade A · High
Grades are official Florida Department of Education school grades for 2025-26. Assignments are reported as of the 2025-26 year and can change; always confirm with Hillsborough County Public Schools for a specific address.
Buying with schools in mind? We can confirm the exact zoned schools for any Port Tampa City Map address.
Shop the zone: Homes zoned for Robinson-Hb High School
Recent Developments in Port Tampa City Map
Development, infrastructure, retail, and school activity affecting Port Tampa City Map, tracked by our team and summarized from public reporting and official sources, with links to the original coverage. Last updated October 2026.
- August 2026Development
AECOM Hunt selected as construction manager for proposed $2.3 billion Rays ballpark in Tampa
AECOM Hunt joined the design team led by Populous for the proposed ballpark on a site that includes Hillsborough College property. The stadium would have at least 28,000 fixed seats, with a construction start targeted for September 2026 and completion by late 2028. Tampa's public contribution is up to $80 million and financing is not finalized.
What it may mean for the marketA large ballpark and surrounding mixed-use district would add construction jobs, event traffic and retail demand on the Dale Mabry corridor. The site is about 9 miles north of Port Tampa City Map.
Source: Tampa Bay Business and Wealth - August 2026Infrastructure
Four firms vie to build Tampa International Airport's $150 million control tower
TPA narrowed the field to four builders for a new blast-resistant air traffic control tower on about 2 acres northwest of the main terminal. The budget is about $150 million, with board selection expected Oct. 1 and substantial completion targeted for March 2029.
What it may mean for the marketAirport capital spending supports construction employment and long-term air service capacity for the region. The site is about 8 miles north of Port Tampa City Map.
Source: Tampa Bay Business and Wealth - August 2026Development
ONE Tampa condo tower tops out at 42 stories with nearly 70% of units sold
Kolter Urban's 42-story tower at North Ashley Drive and East Twiggs Street has 225 residences and is capped at 649 feet by aviation limits. Closings are expected to begin in the third quarter of 2027. About 5,000 square feet of ground-floor restaurant space is planned.
What it may mean for the marketNew downtown condo inventory and ground-floor dining add housing choices and walkable amenities near Curtis Hixon Waterfront Park. The project is about 7 miles northeast of Port Tampa City Map, elsewhere in Hillsborough County.
Source: Tampa Bay Business and Wealth - August 2026Parks & Amenities
Tampa advances $1.999 million design contract for Picnic Island coastal restoration
Tampa selected HDR Engineering to design a nature-based shoreline plan including living breakwaters, a living shoreline and reinforced dunes. The contract covers design and permitting only, over 458 days, funded by a state resiliency grant. Construction is not yet funded or scheduled.
What it may mean for the marketShoreline work aims to reduce flood and erosion exposure for Port Tampa City and add park and trail amenities. The site is about 2 miles southwest of Port Tampa City Map.
Source: Tampa Bay Business and Wealth - July 2026Development
33-story tower planned for Water Street Tampa expansion
Strategic Property Partners plans a 33-story mixed use tower at Water Street and Cumberland Avenue in downtown Tampa on a 1.9-acre site. The building would hold 452 residential units ranging from studios to three bedrooms plus about 37,000 square feet of retail and 645 parking spaces. Construction is scheduled to begin in spring 2027 with completion targeted for 2029.
What it may mean for the marketAdds a 33 story tower with 452 residential units and ground floor retail to the downtown Tampa market, continuing the buildout of the Water Street district and expanding high rise housing supply. The project is about 7 miles northeast of Port Tampa City Map, elsewhere in Hillsborough County.
Source: Florida YIMBY - July 2026Builder Activity
First 3D-printed affordable home nears completion in East Tampa
The nonprofit Corporation to Develop Communities of Tampa is completing Tampa's first 3D-printed affordable home on Lurline Circle in East Tampa, using a gantry-style printer that layers concrete for the walls. The house is expected to be finished within weeks and listed for sale in about two months, with down payment assistance and first time homebuyer programs available. The effort is part of a broader CDC initiative that includes more than 90 multifamily units in East Tampa.
What it may mean for the marketIntroduces 3D concrete printing construction to the local for sale housing market, with a new single family home and additional multifamily units planned. The method signals a new building technique entering the area home supply. The project is about 11 miles northeast of Port Tampa City Map, elsewhere in Hillsborough County.
Source: Bay News 9
Summaries reflect public reporting and official sources linked above as of the dates shown. Project details, timelines, and approvals can change. Commentary on potential market effects is general observation, not investment advice or a prediction for any specific property. For the freshest items across the whole region, see This Week in Northeast Florida.
The Port Tampa City Map buying strategy.
If we were buying in Port Tampa City Map today, this is the order of operations we would run for our clients.
Underwrite the condition first. Price the roof, HVAC, and systems honestly before judging any list price; condition swings value here more than square footage alone.
Match the home to real comps. Recent sales of similar condition and lot, not the asking price, tell you what a home is worth.
Move deliberately, not desperately. Neither side has a decisive edge, so a well-prepared, fairly-priced offer wins without overpaying.
Line up financing and inspection early. A pre-approval and an inspection plan let you act fast and negotiate from evidence.
Keep an agent in your corner. The listing agent works for the seller; we represent you and prepare a hand-built valuation before any offer in Port Tampa City Map.
A closer look at the Port Tampa City Map market
At a median of $272 per square foot, Port Tampa City Map prices sit in a fairly defined band, so condition and updates — more than the list price — tend to separate one home from the next.
Inventory runs at 3.2 months of supply, a balanced market and the trailing-12-month median down 13% year over year. Homes that do trade take a median 46 days on market, useful leverage on any listing that has lingered.
The housing stock is 816 homes built between 1890 and 2024, and 60% of parcels are homesteaded — the owner-occupancy proxy in the Florida DOR assessment roll.
The location and the amenities are priced into every listing in Port Tampa City Map. The deal is won or lost on condition, the comps, and the renovation math.
Momentum Buy Score.
Our proprietary 0 to 10 read across the factors that decide how a home in Port Tampa City Map buys, holds, and resells. Momentum Research; not an appraisal.
Momentum Intelligence Scores are our proprietary, qualitative assessment on a 0 to 10 scale, built from the record-level market data on this page. They are a framework for comparing communities, not a guarantee of future value and not advice on a specific home; unlike an automated value estimate they do not price your home, they grade the community on evidence you can inspect. Composite is the plain average of the 5 factors (6.4). Basis: Long-Term Appreciation +454% since 2012; Recent Direction -13.4% year-over-year; Liquidity & Demand 3.2 months of supply; Owner Commitment 60% owner-occupied; Pricing Power 94.4% sale-to-list. Refreshed with each data update.
Tools for a Port Tampa City Map buy.
Free calculators to pressure-test the real cost before you tour.
Selling here is won on condition and pricing to real comps, not an automated estimate. The right number comes from closed Port Tampa City Map sales matched to your home.
Price it to the comps and condition, not an automated estimate.
If you are thinking about selling in Port Tampa City Map, the right list price comes from recent comparable sales matched to your home's condition and location, not an automated estimate.
What is your Port Tampa City Map home worth?
Get a no-obligation home value based on real comparable sales in Port Tampa City Map, not an automated guess. Tell us about your home and we will personally prepare your numbers and a pricing strategy. No obligation, no spam.
See all homes for sale in Tampa →
Recently off market in Port Tampa City Map
Homes in Port Tampa City Map that recently left the market. Each address opens its public-record profile: county-recorded value, property taxes, the last recorded sale, community sales history, and what is for sale nearby now. 20 on record.
- 5316 W Idaho Street · off market
- 6820 South Shamrock Road · off market
- 6928 S West Shore Boulevard · off market
- 7009 S Fitzgerald Street · off market
- 7102 S Fitzgerald Street · off market
- 7115 S Trask Street · off market
- 7301 S Faul Street · off market
- 7301 S Fitzgerald Street · off market
| Location | Tampa, Hillsborough County, FL · ZIP 33613, 33616 |
|---|---|
| Homes in the community | 816 (FL DOR 2025 assessment roll) |
| Years built | 1890–2024 (median 2001) |
| Typical living area | 1,870 sq ft (median) |
| Home types (current listings and sales) | single-family 100% |
| Amenities listed by sellers | Security System, None, Playground, Secured Garage/Parking, Deed Restrictions, Dog Park |
| Sale prices, last 12 months | $535,000 median across 65 closed sales · $272 per sq ft · -13.4% vs the prior 12 months |
| Days on market (closed sales) | 46 median |
| For sale right now | 21 active, 7 pending · median asking $550,000 · 3.2 months of supply |
| Owner-occupied (homestead) share | 60% |
| Zoned public schools | West Shore Elementary School; Monroe Middle School; Robinson High School (A, FLDOE 2025-26) |
Data as of September 20, 2026. Based on Stellar MLS data distributed by MLS GRID for the period 2005 through 2026; housing-stock figures from Florida Department of Revenue public records. Market figures describe homes, not residents. Cite as: Momentum Realty, “Port Tampa City Map key facts,” movewithmomentum.com/neighborhoods/port-tampa-city-map, data as of September 20, 2026.
Housing distress & ownership in Port Tampa City Map, Tampa
Who owns here, how much is not owner-occupied, and how much for-sale inventory is under distress.
Source: Momentum Realty Research. Ownership & parcels from the FL DOR 2025 tax roll; distress from MLS active-listing status/remarks; price from MLS closed sales. Based on Stellar MLS data distributed by MLS GRID for the period October 2026 through October 2026. Deemed reliable but not guaranteed.
Just listed in Port Tampa City Map
The newest homes for sale in Port Tampa City Map right now, newest first. Each link opens the full listing with every photo, the price history and a tour request.
- 7702 S Kissimmee Street $825,000 · 4 bd · 3 ba · 2,899 sq ft · listed Oct 23, 2026 Courtesy of REDFIN CORPORATION
- 7706 S Trask Street $730,000 · 4 bd · 3.5 ba · 2,508 sq ft · listed Oct 2, 2026 Courtesy of SAMPLE WARNEKE REAL ESTATE, LLC
- 7210 S Mascotte Street $699,000 · 4 bd · 2.5 ba · 2,259 sq ft · listed Sep 28, 2026 Courtesy of KELLER WILLIAMS SOUTH Tampa
- 7311 South Faul Street $899,000 · 5 bd · 4 ba · 3,636 sq ft · listed Sep 25, 2026 Courtesy of LPT REALTY, LLC
- 7608 S Swoope Street $399,900 · 3 bd · 2 ba · 1,160 sq ft · listed Sep 22, 2026 Courtesy of THE SHOP REAL ESTATE CO.
- 4602 W Chisholm Street $304,900 · 3 bd · 2 ba · 1,056 sq ft · listed Sep 11, 2026 Courtesy of RE/MAX ELITE REALTY
Checked against the MLS nightly. All new listings in this market.
Every Home for Sale in Port Tampa City Map Right Now (25)
All 25 active and pending Port Tampa City Map listings with a detail page, newest first, refreshed twice a day from the MLS.
- 7706 S Trask Street · $730,000 · 4 bd / 3.5 ba · listed Oct 2, 2026 · listed by Sample Warneke Real Estate, Llc
- 7210 S Mascotte Street · $699,000 · 4 bd / 2.5 ba · listed Sep 29, 2026 · listed by Keller Williams South Tampa
- 7311 South Faul Street · $899,000 · 5 bd / 4 ba · listed Sep 26, 2026 · listed by Lpt Realty, Llc
- 7608 S Swoope Street · $399,900 · 3 bd / 2 ba · listed Sep 23, 2026 · listed by The Shop Real Estate Co.
- 7409 S Sparkman Street · $765,000 · 4 bd / 3 ba · pending · listed Sep 19, 2026 · listed by Real Broker, Llc
- 7508 S Swoope Street · $540,000 · 3 bd / 2 ba · pending · listed Sep 15, 2026 · listed by Lpt Realty Llc
- 4602 W Chisholm Street · $304,900 · 3 bd / 2 ba · listed Sep 11, 2026 · listed by Re/Max Elite Realty
- 7514 S Kissimmee Street · $825,000 · 4 bd / 3 ba · pending · listed Sep 11, 2026 · listed by Exit Bayshore Realty
- 4611 W Loughman Street · $800,000 · 3 bd / 2 ba · pending · listed Sep 11, 2026 · listed by Lpt Realty, Llc
- 7610 S Sherrill Street · $529,900 · 3 bd / 2 ba · listed Sep 10, 2026 · listed by Smith & Associates Real Estate
- 7405 S Desoto Street · $511,000 · 5 bd / 2 ba · listed Sep 10, 2026 · listed by Opendoor Brokerage Llc
- 7411 S Sparkman Street · $675,000 · 4 bd / 2.5 ba · pending · listed Sep 10, 2026 · listed by Exp Realty Llc
- 7611 S Desoto Street · $649,000 · 3 bd / 2.5 ba · pending · listed Sep 10, 2026 · listed by Sample Warneke Real Estate, Llc
- 7312 S Elliott Street · $310,000 · 4 bd / 1 ba · listed Sep 6, 2026 · listed by Engel & Volkers Madeira Beach
- 7318 S Kissimmee Street · $529,000 · 3 bd / 3 ba · listed Sep 5, 2026 · listed by Gold Palm Homes
- 7703 S Sparkman Street · $535,000 · 3 bd / 2 ba · pending · listed Aug 30, 2026 · listed by 1 Step Ahead Realty Group Llc
- 4717 W Prescott Street · $419,900 · 3 bd / 2 ba · listed Aug 27, 2026 · listed by Redfin Corporation
- 7612 S Juanita Street · $849,000 · 4 bd / 3 ba · listed Aug 20, 2026 · listed by Dicus Harrison Realty
- 7415 S Elliott Street · $595,000 · 5 bd / 3.5 ba · listed Aug 5, 2026 · listed by M Six Realty Powered By Sellstate
- 7303 S Fitzgerald Street · $897,000 · 5 bd / 3 ba · listed Jul 26, 2026 · listed by Savvy Avenue, Llc
- 7312 S Fitzgerald Street · $625,000 · 3 bd / 2 ba · listed by Lpt Realty, Llc
- 7207 S West Shore Boulevard · $280,000 · 2 bd / 1 ba · pending · listed by Charles Rutenberg Realty Inc
- 7606 S Sparkman Street · $804,000 · 4 bd / 3.5 ba · listed by Agile Group Realty
- 7110 S Mascotte Street · $265,000 · 2 bd / 1 ba · listed by Lpt Realty, Llc
- 7301 S West Shore Boulevard · $419,999 · 3 bd / 2.5 ba · pending · listed by Dispensa Properties Llc
Recently sold in Port Tampa City Map
- 7301 S West Shore Boulevard · sold $413,500
- 7703 S Sparkman Street · sold $520,000
- 7308 S West Shore Boulevard · sold $489,000
- 5316 W Idaho Street · sold $371,000
- 7605 S Kissimmee Street · sold $725,000
- 7409 S Kissimmee Street · sold $680,000
- 6928 S West Shore Boulevard · sold $450,000
- 7301 S Fitzgerald Street · sold $897,000
- 7412 S Sherrill Street · sold $225,000
- 7102 S Fitzgerald Street · sold $410,000
Closed sales from the MLS; each page shows the sold price, taxes and value history.
More Tampa home searches
- All homes for sale in Tampa, FL
- Homes for sale in Hillsborough County, FL
- Tampa pool homes for sale
- Tampa waterfront homes for sale
- Gated communities in Tampa
- Tampa golf course homes
- Homes under $300K in Tampa
- Homes from $300K to $500K in Tampa
- 4-bedroom homes for sale in Tampa
- Tampa home values: what is my house worth?
Tampa guides & data
- Market data
- Cost of living
- Best neighborhoods (ranked by data)
- Best neighborhoods
- Flood zones
- Property taxes (Hillsborough County)
- Homestead exemption (Hillsborough County)
- Home insurance cost
Florida buyer guides
- Florida home insurance rates by county
- Florida property tax by county
- Florida property tax calculator
- What flood zone X means
- The 4-point inspection, explained
- Florida flood insurance calculator
Real estate agent in Tampa? Join Momentum in Tampa: 100% commission, one $12K cap.
Streets in this community
Street-level pages: every home on record, what sold and what is for sale on each street.
- S Sparkman Street (70 homes on record)
- S West Shore Boulevard (56 homes on record)
- S Fitzgerald Street (48 homes on record)
- S Obrien Street (45 homes on record)
- S Mascotte Street (40 homes on record)
- S Desoto Street (39 homes on record)
- S Shamrock Road (34 homes on record)
- S Trask Street (32 homes on record)
- S Kissimmee Street (29 homes on record)
- S Juanita Street (26 homes on record)
- S Swoope Street (25 homes on record)
- S Faul Street (23 homes on record)
What it really costs to own in Port Tampa City Map
The parts of the monthly number a mortgage calculator leaves out, from the tax roll, the MLS, Citizens and FEMA. Property facts only.
| HOA dues | Median $61/month across 4 MLS listings (most billed monthly; 2026-10-24). Dues cover what the documents say they cover; ask for the budget and reserve study. |
|---|---|
| Home and flood insurance | The average Citizens Property Insurance premium in Hillsborough County is $1,816/yr (6,518 policies, Citizens detail by county, April 2026); private-market quotes depend on roof age, wind mitigation and construction. Flood: of 22 listing addresses checked against the FEMA flood map, 0% sit outside the high-risk zone and 100% inside one, where flood insurance is required with a federally backed mortgage. Statewide, a Zone X flood policy runs about $500-$700/yr and a high-risk zone $1,200-$2,500/yr (FEMA Risk Rating 2.0 averages, not quotes). |
| Roof and age | Median build year 2005 across 34 listings. An original roof here would be about 21 years old; under Florida's 2022 reform (SB 2-D) carriers may require an inspection past 15 years, so budget for a roof report, and for replacement where it fails. |
Email me new listings in Port Tampa City Map
One e-mail a day, only when a home lists here, with price, beds, baths and a link to every listing. Straight from the MLS feed; no account needed.
Ask an agent about Port Tampa City Map
Have a question about the homes, fees, rules or commute here? A Momentum agent who works Port Tampa City Map will answer, and the answer is published on this page for the next buyer.
Frequently Asked Questions
What is the median home price in Port Tampa City Map?
How long do homes in Port Tampa City Map take to sell?
Is Port Tampa City Map a buyer's or seller's market right now?
How many homes are in Port Tampa City Map?
What share of Port Tampa City Map is owner-occupied?
When were the homes in Port Tampa City Map built?
Have Port Tampa City Map home prices gone up?
What schools serve Port Tampa City Map?
Who is the best real estate agent for Port Tampa City Map?
How do I find a top Tampa real estate agent who knows Port Tampa City Map?
Can Momentum Realty connect me with an agent for Port Tampa City Map?
Where is Port Tampa City Map, and what county is it in?
Is Port Tampa City Map a good place to live?
Data sources & freshness
| Live listings | Stellar MLS, refreshed twice daily (last: October 23, 2026) |
| Community market stats | Stellar MLS closed sales, 12-month windows ending September 20, 2026 |
| Housing stock & ownership | Florida DOR assessment roll (street-list match (8 streets, ZIP 33613/33616)) |
| Under-contract shares | Stellar MLS records, as of 2026-09-20 |
| Schools | 2025-26 district assignments + FLDOE school grades; verify with the district |
| Historical depth | Closed-sale records back to 2005 (581 transactions analyzed) |
Verify the primary sources yourself: Florida DOR · U.S. Census · FEMA flood maps · Citizens Property Insurance.
Momentum Research figures are our own analysis of Stellar MLS records; MLS data is deemed reliable but not guaranteed. Methodology: how Momentum market scores are computed. Market metrics describe homes for sale and recent sales, not residents.
Own a home here?
You just read the data. Now see what your home is worth.
The numbers on this page move markets in the aggregate. The number that matters to you is what a buyer pays for your address. Momentum sells for 1.25% above the Stellar MLS member average and 8 days faster, and we’ll price yours against live local comps.
Looking to buy here? Search homes for sale →
What’s your home worth in your area?
A real valuation with real comps from a local listing agent, not an instant algorithm. Response within one business day.
See how Port Tampa City Map fits the bigger picture — live prices, inventory, and Momentum Scores:
More on Port Tampa City Map
- Home values · What homes in Port Tampa City Map actually sell for
Nearby Communities
Explore more neighborhoods near Port Tampa City Map with Momentum Realty’s local guides.