
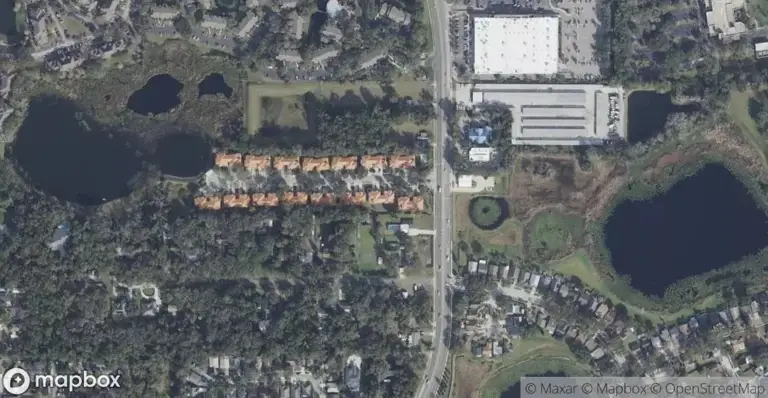
Wekiva Village
Homes for Sale in Apopka, FL
All 530 homes for sale in APOPKA, FL · median $429,950 · 63 townhomes for sale in APOPKA · 173 homes for sale in 32703 · Orange County homes for sale
True comps, carrying-cost math, and listings before the portals.
As of September 2026, Wekiva Village 45 23 in Apopka, FL has 1 home for sale. Homes listed or recently sold were built 2000 - 2001; 3 of 3 report an HOA (median $385/mo).

Wekiva Village sits in a quiet corner of Apopka's resale market, and the numbers reflect that: zero active listings and just two closings in the most recent window. That is not a data set you can build a pricing narrative from - it is a signal that this is a small, low-turnover community where inventory simply is not moving through the pipeline right now.
For a buyer, that means patience and a direct approach: watch for a listing to hit and move quickly, because there is no backlog of comparable homes to negotiate against. For a seller, it means you are likely to be the only option on the market at the moment you list, which can work in your favor if the home is presented well - but there is little recent transaction history here to lean on for pricing confidence.
Wekiva Village right now
🟡 Balanced market. 6.0 months of supply and 0% of the inventory already under contract put buyers and sellers on roughly even footing.Why it matters: months of supply is how long today's inventory would last at today's sales pace; under-contract share is the portion of homes for sale that already have a buyer.Momentum Research analysis of Stellar MLS records, as of September 12, 2026. Confidence: Low (1 active and pending listings, 2 closed sales in 12 months).
Jump to: Price history & scorecard · Homes for sale · Schools · FAQ
· Updated September 15, 2026 · Live data: Stellar MLS, refreshed twice daily · MLS facts carry their source; interpretation lines are Momentum Research · Data sources & freshness
The 60-Second Overview
Wekiva Village is a gated (no-guard), deed-restricted community in Apopka with a shared pool - a small enclave rather than a high-volume subdivision, and the current listing count reflects that scale.
Stellar MLS sales records identify 50 homes in Wekiva Village that have changed hands since 2004, built between 2000 and 2003 (median 2001), with a median living area of about 2,174 sq ft and a typical 3-bedroom, 2.5-bath layout; 100% are townhomes. Source: Stellar MLS closed-sale history compiled by Momentum Research; counts reflect homes with a recorded MLS sale, not every home in the community.
Pre-construction details are compiled from public records, builder announcements and builder listings, and are subject to change without notice; figures are deemed reliable but not guaranteed. Momentum Research figures are our own analysis. This page describes homes, pricing and community attributes, not residents.
The setting & the homes.
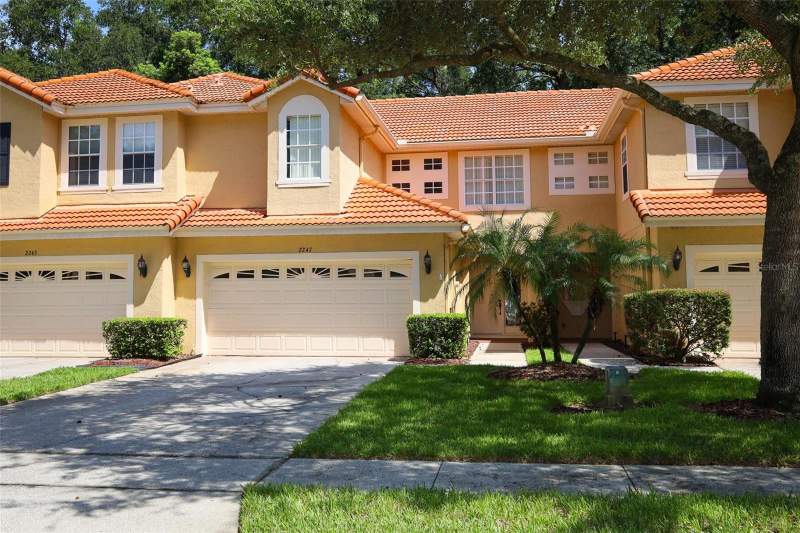
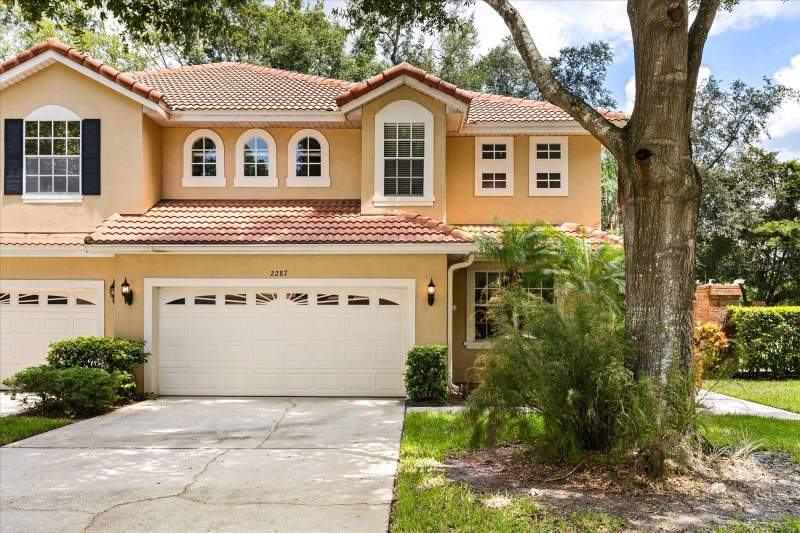
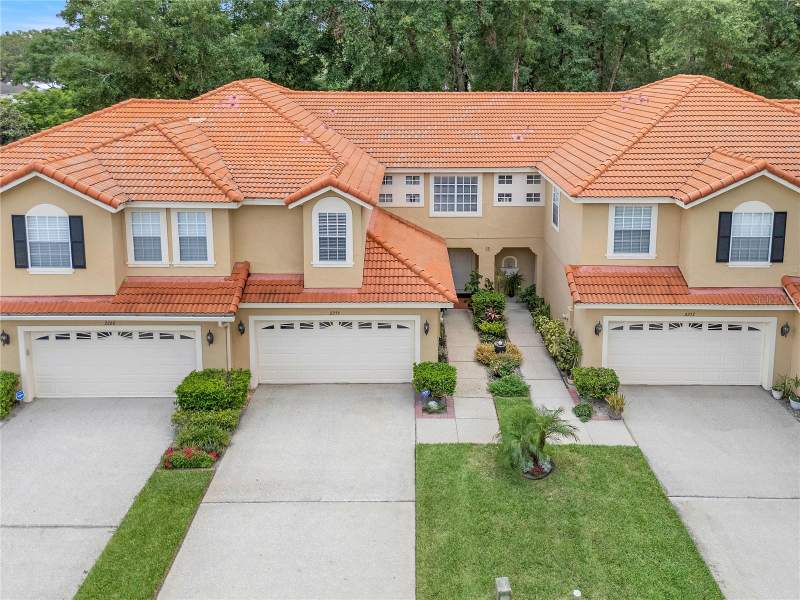
Aerial and on-site photos of Wekiva Village. Swipe to explore the community.
Swipe or use the arrows → tap any photo to enlarge
 Wekiva Village
 Wekiva Village
 Wekiva Village
Photos from Stellar MLS listings in Wekiva Village; content deemed reliable but not guaranteed.
Who Wekiva Village is best for.
Best for
- Buyers targeting a gated, deed-restricted community with shared pool access and no rush on timing
- Buyers comfortable making an offer on a single available home rather than comparing multiple listings
- Buyers who want to be alerted the moment inventory opens in a low-turnover pocket of Apopka
Probably not for
- Buyers who need to compare several active listings before deciding
- Buyers on a strict closing deadline who cannot wait for the right listing to surface
- Buyers wanting a community with a large, well-documented recent sales history to lean on
The market around Wekiva Village
Wekiva Village is too small for its own price trend, so here is the market around it.
In ZIP 32703, 333 homes are on the market and 32% are under contract — a fast-moving corner of Apopka.
Across Orange County, 5,909 homes are active and 1,877 pending (24% under contract).
In ZIP 32703 (APOPKA), 1,172 homes closed in the last 12 months at a median of $395K ($217/sq ft), down 0.3% year over year, with a median 35 days on market. Right now 146 active and 82 pending listings put supply at about 2.7 months - a healthy market. See the live ZIP 32703 housing market and the Orange County market.
ZIP and county figures describe the wider market, not Wekiva Village specifically. Momentum Research analysis of MLS records.
Housing distress & ownership in Wekiva Village 45 23 Apopka, APOPKA
Who owns here, how much is not owner-occupied, and how much for-sale inventory is under distress.
Source: Momentum Realty Research. Ownership & parcels from the FL DOR 2025 tax roll; distress from MLS active-listing status/remarks; price from MLS closed sales. Based on Stellar MLS data distributed by MLS GRID for the period September 2026 through September 2026. Deemed reliable but not guaranteed.
Homes For Sale Right Now in Wekiva Village
Live MLS inventory for Wekiva Village. Every active listing, what is under contract right now, and the last 12 months of closed sales, refreshed twice a day. Closed comps beat an algorithm's guess every time.
Active and pending Wekiva Village listings as of 2026-09-15, priced high to low. Based on Stellar MLS data distributed by MLS GRID for the period 2015 through 2025. Tap any home to ask about it.
Wekiva Village on the map.
Every active, pending, and recently sold home, plotted. Toggle the layers and tap a home for the details.
Listing locations from Stellar MLS. Map data © OpenStreetMap, tiles © CARTO.
Life at Wekiva Village
- Community Mailbox · reported on 2 of 2 listings
- Deed Restrictions · reported on 2 of 2 listings
- Gated Community - No Guard · reported on 2 of 2 listings
- Pool · reported on 2 of 2 listings
Community amenities as reported across Stellar MLS listings in this community; deemed reliable but not guaranteed. Verify current amenities and access with the HOA.
Schools
- Orange County Public Schools
- Verify the zoned schools by address
- Magnet and choice options may be available
- Lovell Elem · Elementary
- Piedmont Lakes Middle · Middle
- Apopka High · High
Zoned schools reflect the assignments reported on recent Wekiva Village listings and can change; always confirm with Orange County Public Schools for a specific address.
Buying with schools in mind? We can confirm the exact zoned schools for any Wekiva Village address.
Shop the zone: Homes zoned for Apopka High High School
Recent Developments in Wekiva Village 45 23
Development, infrastructure, retail, and school activity affecting Wekiva Village 45 23, tracked by our team and summarized from public reporting and official sources, with links to the original coverage. Last updated August 2026.
- July 2026Development
Orange County opens Enclave at Canopy Park with 104 affordable units
Orange County opened The Enclave at Canopy Park, a 104-unit affordable apartment community at 4440 Canopy Park Loop developed by Archway Partners. The county contributed 3 million dollars from its Affordable Housing Trust Fund. The community includes one and two bedroom homes plus a community center, fitness center, technology lab, and EV charging.
What it may mean for the marketAdds 104 income-restricted apartment homes to the local rental supply along with new community amenities and green-certified construction. The project is about 15 miles southeast of Wekiva Village 45 23, elsewhere in Orange County.
Source: ClickOrlando - July 2026Civic
Orange County previews new Innovation Center on West Colonial Drive
Orange County previewed its new Innovation Center at 7149 West Colonial Drive, located within the county's Multicultural Center and Senior Center complex, with an official opening set for Fall 2026. The center will offer technology programs including 3D printing and makerspace prototyping through the Orange County Library System, plus career exploration and workforce training through CareerSource Central Florida.
What it may mean for the marketAdds a county operated civic and technology facility with library and workforce programming to the West Colonial corridor. The project is about 9 miles south of Wekiva Village 45 23, elsewhere in Orange County.
Source: Orange County Newsroom - June 2026Development
Mixed-use high-rise redesigned for 924 and 934 North Magnolia Avenue
A redesigned 17-story mixed-use high-rise was proposed for 924 and 934 North Magnolia Avenue in Orlando's North Quarter district by Acram Group. The project would include 350 residential units, about 3,300 square feet of ground-floor commercial space, and a parking garage with 510 spaces, replacing two 1972 office buildings. A public plaza is planned at the corner of Magnolia and Weber Street.
What it may mean for the marketWould replace two aging office buildings with 350 residences, ground floor retail, and structured parking, adding housing density and a public plaza along the Orlando Urban Trail. The project is about 12 miles southeast of Wekiva Village 45 23, elsewhere in Orange County.
Source: Florida YIMBY - June 2026Development
Planning board approves zoning for 37-story tower at 170 East Washington Street
Orlando's Municipal Planning Board voted to approve a Planned Development amendment for a 37-story, 425-foot mixed-use tower at 170 East Washington Street across from Lake Eola Park. The project would include 252 residential units, a 221-room hotel, a three-story restaurant, and structured parking. It still requires City Council consideration before construction.
What it may mean for the marketWould add a 37 story tower with 252 residences and a hotel to the downtown skyline, replacing a prior approval for a 7 story hotel and increasing high density housing and parking supply. The project is about 13 miles southeast of Wekiva Village 45 23, elsewhere in Orange County.
Source: Florida YIMBY - October 2025Retail & Dining
New Apopka complex with restaurants and offices set to open in 2026
A new commercial complex in Apopka with restaurants and office space is set to open in 2026, adding retail and workplace space in northwest metro Orlando.
What it may mean for the marketNew retail and office space in Apopka adds everyday conveniences and local jobs, amenity and employment factors that can support nearby housing demand. The site is less than a mile east of Wekiva Village 45 23.
Source: GrowthSpotter - March 2025Development
Lake County approves rezoning for the Wolf Branch Innovation District near Mount Dora
Lake County approved a rezoning for the Wolf Branch Innovation District, a large mixed-use employment district planned near Mount Dora and State Road 46, clearing the way for a long-term jobs and commercial hub in east Lake County.
What it may mean for the marketA large new employment and mixed-use district near Mount Dora points to long-term job growth in east Lake County, a structural demand driver for housing in the surrounding area. The site is about 10 miles northwest of Wekiva Village 45 23.
Source: GrowthSpotter
Summaries reflect public reporting and official sources linked above as of the dates shown. Project details, timelines, and approvals can change. Commentary on potential market effects is general observation, not investment advice or a prediction for any specific property. For the freshest items across the whole region, see This Week in the Orlando Metro.
The Wekiva Village buying strategy.
If we were buying in Wekiva Village today, this is the order of operations we would run for our clients.
Underwrite the condition first. Price the roof, HVAC, and systems honestly before judging any list price; condition swings value here more than square footage alone.
Match the home to real comps. Recent sales of similar condition and lot, not the asking price, tell you what a home is worth.
Move deliberately, not desperately. Neither side has a decisive edge, so a well-prepared, fairly-priced offer wins without overpaying.
Line up financing and inspection early. A pre-approval and an inspection plan let you act fast and negotiate from evidence.
Keep an agent in your corner. The listing agent works for the seller; we represent you and prepare a hand-built valuation before any offer in Wekiva Village.
A small, low-turnover pocket
With no active listings and only two closings in the recent window, Wekiva Village trades infrequently. That is common in smaller, deed-restricted communities where residents tend to stay put and the housing stock does not turn over on the same cycle as larger subdivisions nearby.
The amenity set is straightforward: gated access without an on-site guard, a community pool, and HOA-enforced deed restrictions that keep the community's appearance and use consistent. Those restrictions are worth reading closely before you make an offer, since they govern things like exterior changes and property use - details a buyer should confirm directly with the HOA rather than assume.
The location and the amenities are priced into every listing in Wekiva Village. The deal is won or lost on condition, the comps, and the renovation math.
Why work with Momentum here
In a community this thin on active inventory, having someone watching for a listing the moment it comes up - and who can move fast on paperwork and showings - matters more than in a high-volume subdivision. We track off-market activity and recent closings in small communities like this so you are not starting from zero when something finally lists.
Wekiva Village in 15 seconds.
HOA, CDD & Fees
- HOA dues reported around $385/month (about $4,620/yr) · median of 9 MLS listings, most billed monthly
- Any club/amenity membership is billed separately
Listings in this community report association dues of about $385 per month ($4,620 a year) - the median AssociationFee across 9 MLS records, normalised to a monthly figure; most are billed monthly. Dues change with budgets and can differ by section or product type; confirm the current figure with the association before you offer. Source: MLS listing records, 2026-09.
Confirm the current HOA dues, exactly what they cover, and any CDD bond or special assessment for a specific address before you offer.
Tools for a Wekiva Village buy.
Free calculators to pressure-test the real cost before you tour.
Selling here is won on condition and pricing to real comps, not an automated estimate. The right number comes from closed Wekiva Village sales matched to your home.
Price it to the comps and condition, not an automated estimate.
If you are thinking about selling in Wekiva Village, the right list price comes from recent comparable sales matched to your home's condition and location, not an automated estimate.
What is your Wekiva Village home worth?
Get a no-obligation home value based on real comparable sales in Wekiva Village, not an automated guess. Tell us about your home and we will personally prepare your numbers and a pricing strategy. No obligation, no spam.
See all homes for sale in Apopka →
WEKIVA VILLAGE 45/23 Market Scorecard
WEKIVA VILLAGE 45/23 is currently a buyer's market. About 6.0 months of supply, a median asking price of $340,000, and homes go under contract in about 11 days.
Typical home value in the 32703 ZIP is $358,391, about 2.2% above the Florida norm (Zillow Home Value Index).
Go deeper: ZIP market scorecard · county scorecard · true cost calculator · affordability calculator.
Live data: realMLS, refreshed twice daily. Typical value: Zillow Research. Market metrics only; these describe homes for sale and recent sales, not residents.
Frequently Asked Questions
Is Wekiva Village a buyer's or seller's market right now?
Who is the best real estate agent for Wekiva Village?
How do I find a top Apopka real estate agent who knows Wekiva Village?
Can Momentum Realty connect me with an agent for Wekiva Village?
Should you buy in Wekiva Village?
An honest fit check. We will tell you when it is not your community.
Data sources & freshness
| Live listings | Stellar MLS, refreshed twice daily (last: September 15, 2026) |
| Under-contract shares | Stellar MLS records, as of 2026-09-08 |
| Historical depth | Closed-sale records back to 2015 (26 transactions analyzed) |
Verify the primary sources yourself: Florida DOR · U.S. Census · FEMA flood maps · Citizens Property Insurance.
Momentum Research figures are our own analysis of Stellar MLS records; MLS data is deemed reliable but not guaranteed. Methodology: how Momentum market scores are computed. Market metrics describe homes for sale and recent sales, not residents.
Own a home here?
You just read the data. Now see what your home is worth.
The numbers on this page move markets in the aggregate. The number that matters to you is what a buyer pays for your address. Momentum sells for 1.25% above the Stellar MLS member average and 8 days faster, and we’ll price yours against live local comps.
Looking to buy here? Search homes for sale →
What’s your home worth in your area?
A real valuation with real comps from a local listing agent, not an instant algorithm. Response within one business day.
See how Wekiva Village 45 23 fits the bigger picture — live prices, inventory, and Momentum Scores:
Nearby Communities
Explore more neighborhoods near Wekiva Village with Momentum Realty’s local guides.