
Data Analysis
Sarasota home sales surged 22.5 percent year over year to 375 in the three months ending June 2026, with the median price up 6.9 percent to $587,680, per Redfin.
Redfin's city-level data for the rolling three months ending June 2026 shows a sharp rise in closed sales and a higher median price alongside a 75-day selling pace, the slowest among the Gulf coast cities in this release.
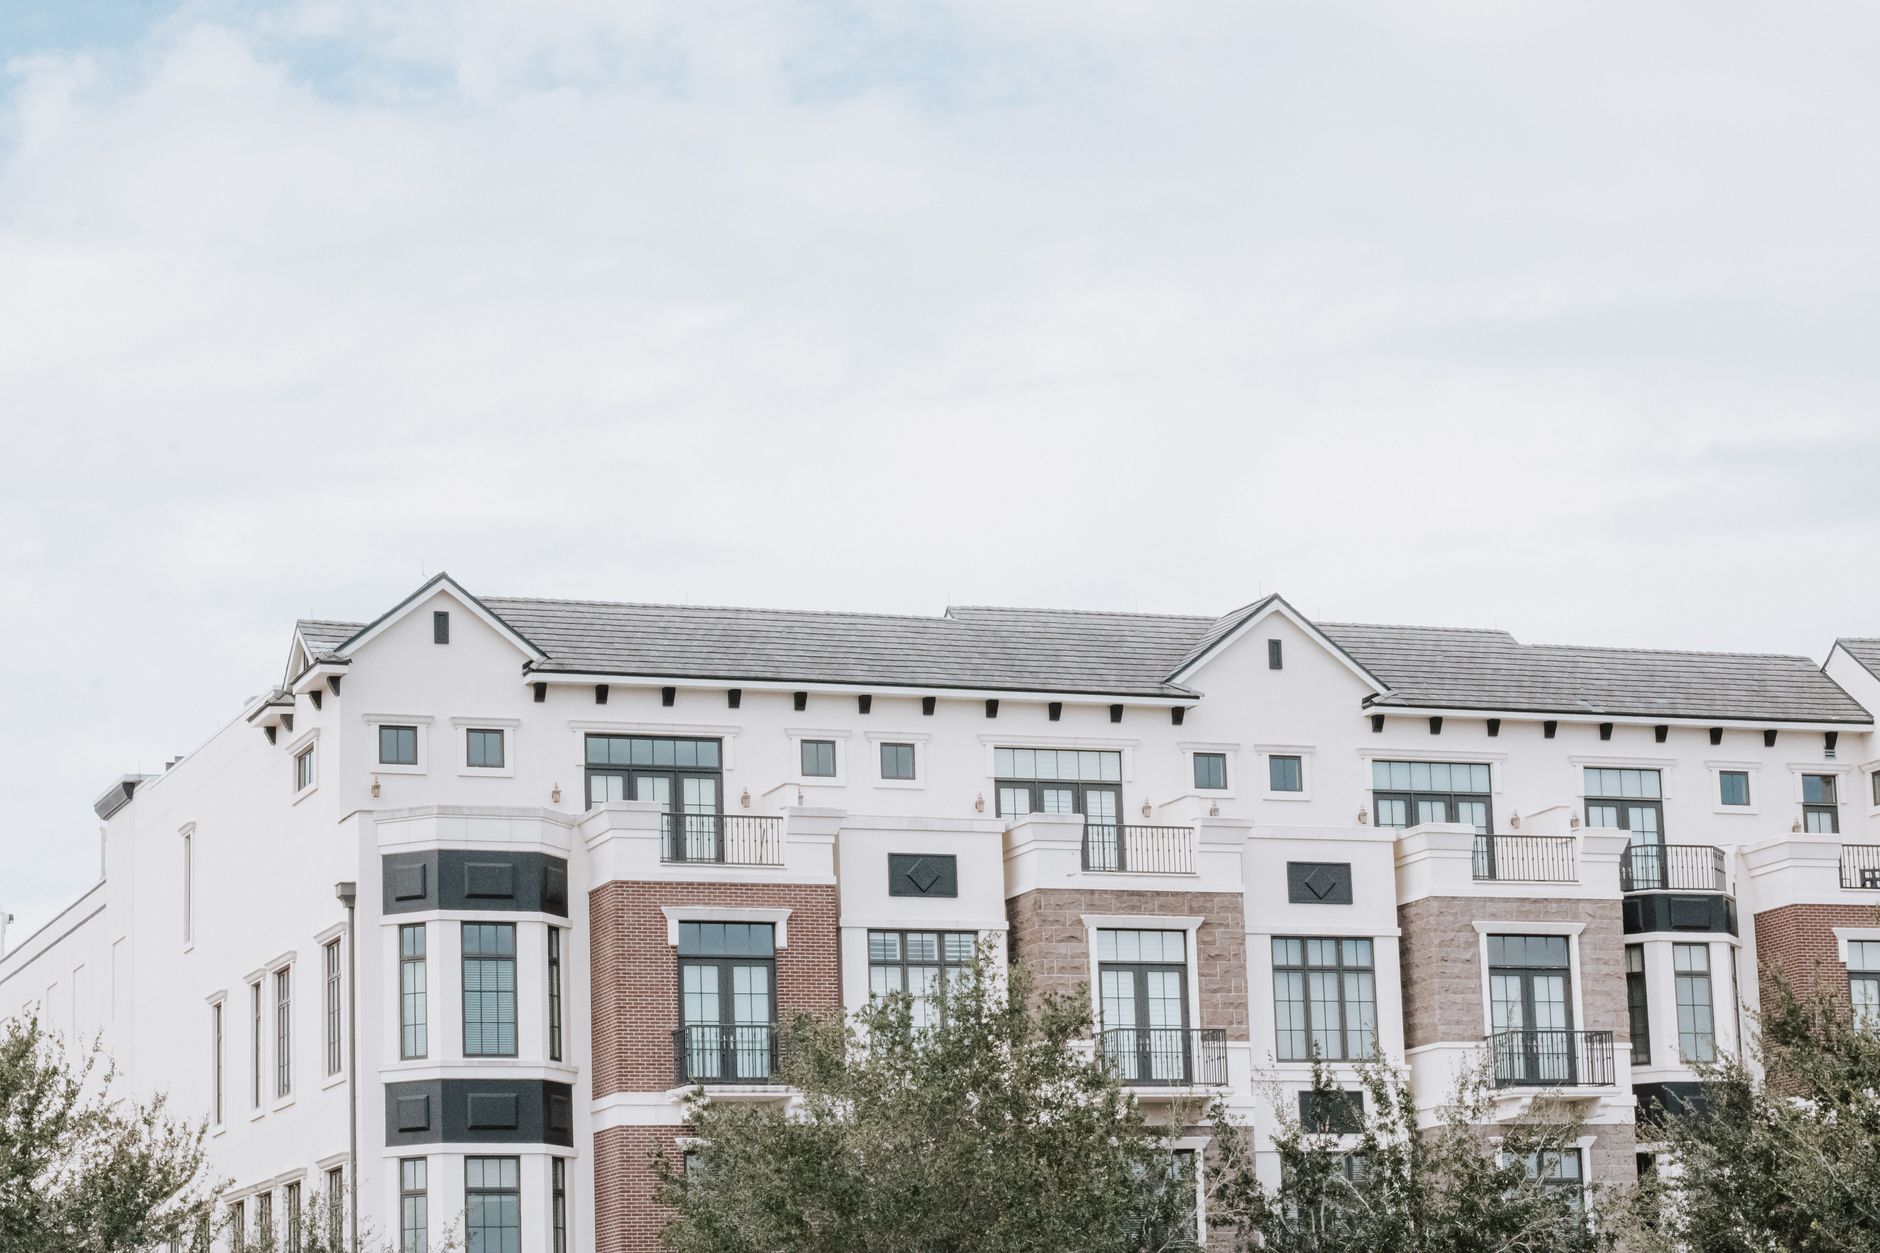
Sarasota's median home sale price was $587,680 in the rolling three months ending June 2026, up 6.9 percent from a year earlier, according to Redfin. Redfin counted 375 homes sold in the city over the period, a 22.5 percent year-over-year increase. The typical home took 75 days to sell, five days longer than a year earlier, per Redfin. The average sale-to-list price ratio rose 0.8 percentage points to 94.5 percent, and 40.2 percent of listings took a price drop, down 2.7 points from a year earlier, Redfin reports.
These figures cover the city of Sarasota only. They exclude the wider North Port-Sarasota-Bradenton metro, and the city's numbers should never be read as a stand-in for that much larger area.
What is driving Sarasota's 22.5 percent jump in home sales?
Redfin's count of 375 closed sales, up 22.5 percent from a year earlier, is the biggest volume gain among the Tampa Bay and Central Florida cities in this release. A caution comes first: Sarasota's city-level sample is small. At 375 sales per quarter, a swing of a few dozen transactions moves the percentage substantially, so the growth rate is less stable than the same figure would be in Tampa's 1,653-sale sample.
Still, the direction is corroborated. The sale-to-list ratio rose and the price-drop share fell over the same year, per Redfin. When more homes sell, at prices closer to asking, with fewer forced cuts, the mechanics describe demand catching up to a market that had been slow to clear.
Why do Sarasota homes take 75 days to sell?
The 75-day median, up from 70 a year earlier per Redfin, is more than double the 37-day pace Redfin reports for Tampa and St. Petersburg in the same window. Higher-priced markets typically run slower clocks. The pool of buyers for a $587,680 median-priced home is thinner than the pool at $450,000, and thinner demand at any given listing means longer waits for the right offer.
The five-day lengthening alongside 22.5 percent more sales is not contradictory. Days on market measures the homes that sold; volume measures how many did. A market can absorb more transactions while each one takes slightly longer, particularly if more listings entered the pipeline. The city's own history for both series is charted on our Sarasota market data page.
How much room is there to negotiate in Sarasota?
More than in the neighboring cities, by this measure. The average Sarasota sale closed at 94.5 percent of list price in the period, per Redfin, the lowest ratio among the Tampa Bay and Central Florida cities in this release. On the median-priced sale, a 5.5 percent gap between list and close is worth roughly $32,000.
The trend, though, moved toward sellers: the ratio rose 0.8 percentage points year over year, the largest gain among the four cities in this group. And 40.2 percent of listings cut their asking price during the period, down 2.7 points from a year earlier, per Redfin. Buyers retained real leverage on individual deals, especially on longer-sitting listings, while the aggregate drift reduced that leverage at the margin.
Is the $587,680 median the whole Sarasota story?
No, for two reasons. First, medians reflect the mix of what sold. A quarter in which more higher-end homes close pushes the median up without any single property appreciating, and in a 375-sale sample, mix effects carry extra weight. The 6.9 percent gain is best read alongside the volume and ratio data rather than alone.
Second, geography. This is the city of Sarasota as Redfin defines it, a deliberately narrow boundary. The surrounding metro contains far more sales at generally different price points, and metro-level reports will show different numbers. Comparisons across our coverage should hold geography constant; our news desk publishes the companion city reports for Orlando, Tampa, and St. Petersburg from this same Redfin release.
What do all five indicators say together?
Read as one table, the city's period breaks into a clear pattern. Demand-side measures strengthened: sales up 22.5 percent, sale-to-list up 0.8 points, price drops down 2.7 points, median up 6.9 percent, all per Redfin. The lone measure that softened was the selling clock, up five days to 75.
That combination fits a higher-priced coastal city market that is clearing more inventory than a year ago, at firmer prices, while still requiring patience from sellers on any given listing. Buyers face a market with fewer distressed-looking cuts than last year but a wide average list-to-close gap. Sellers face a market that rewarded them more than it did in mid-2025 and still took two and a half months, at the median, to produce a closing.
Limitations
All figures come from Redfin and reflect Redfin's platform and MLS coverage as published by Redfin, which may not capture every sale. Values cover a rolling three-month window ending June 2026, which smooths month-to-month movement and lags turning points. The geography is the city of Sarasota only, narrower than the North Port-Sarasota-Bradenton metro and narrower than this hub's full market; the small city sample of 375 sales makes percentage changes less stable than in larger cities. Redfin revises published figures as late-reported transactions arrive.
Sources
- Redfin, Sarasota, FL Housing Market: https://www.redfin.com/city/16463/FL/Sarasota/housing-market
- Redfin Data Center: https://www.redfin.com/news/data-center/
Disclosure: Jon Brooks is a co-founder of Momentum Realty, a Florida real estate brokerage that owns and funds Florida Housing Intelligence. Momentum has a financial interest in Florida real estate transactions, including in markets named here. See our editorial standards.
Figures in this article are published by Redfin and are current as of the date shown. Data may be preliminary and subject to revision by its source. This article is general information, not advice about any specific property, transaction, or financial decision, and is not a representation about any specific property, community, builder, or association.
Equal Housing Opportunity. Editorial standards · Corrections · About