
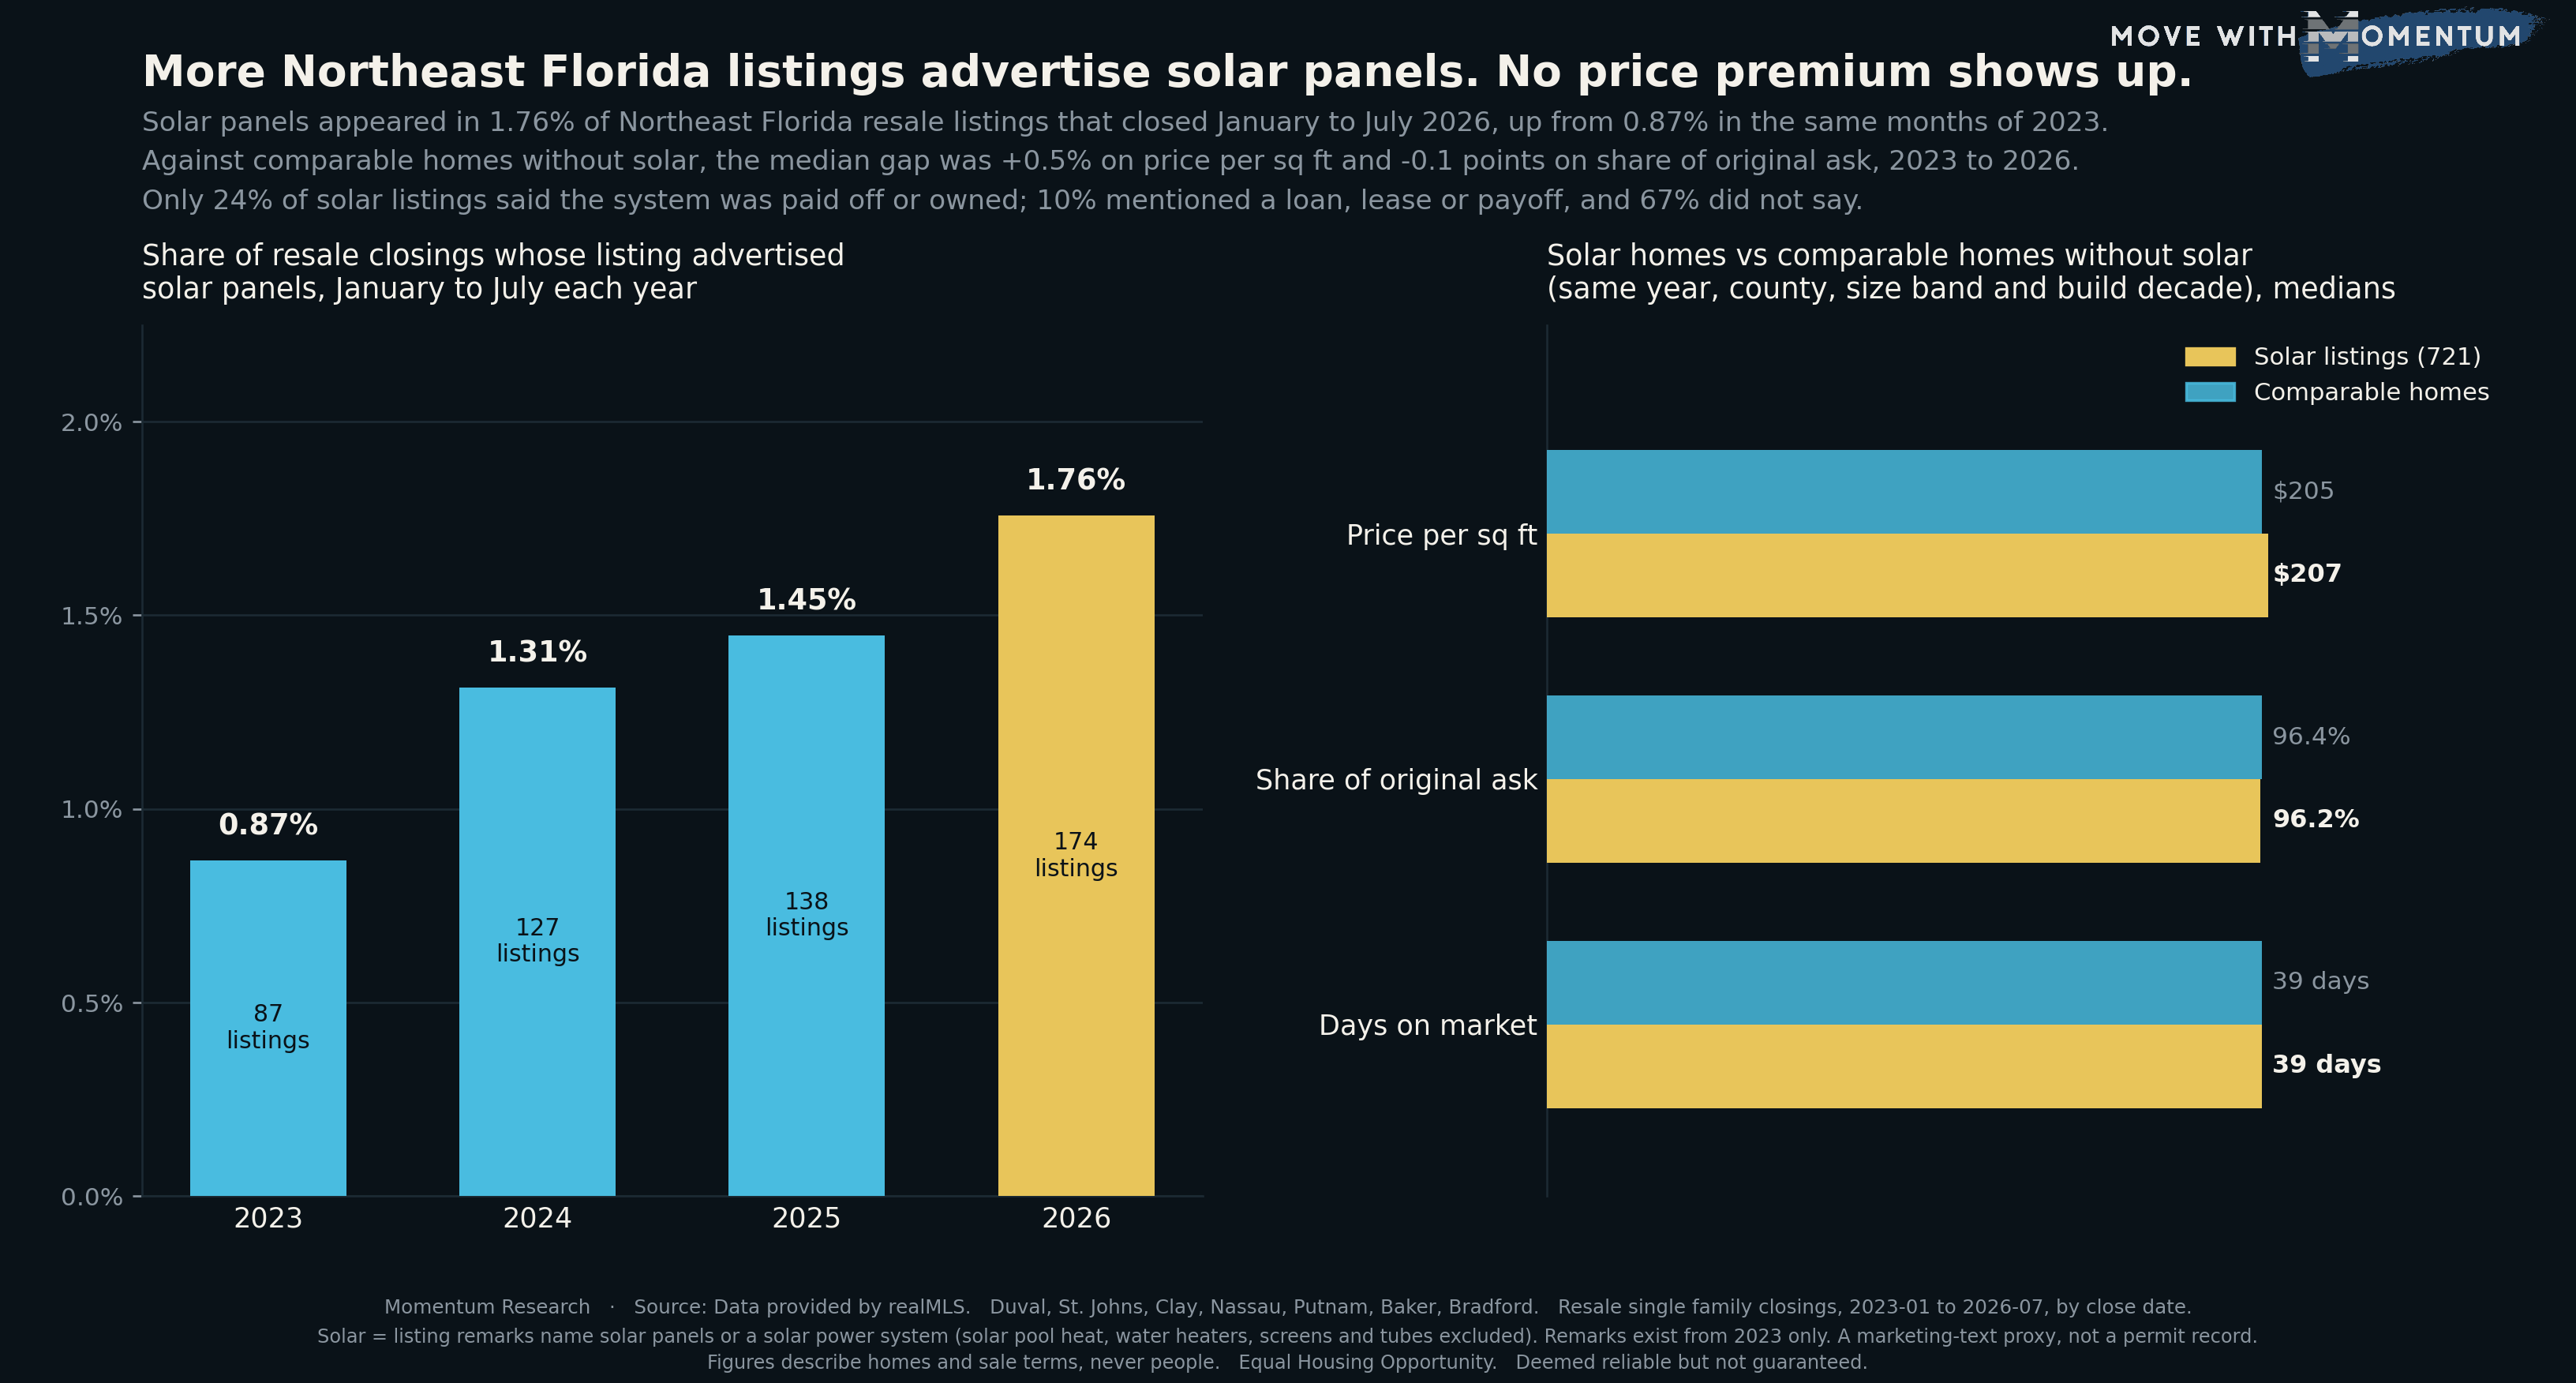
Solar panels are showing up in more Northeast Florida listings. In January to July 2026, 1.76% of resale single family homes that closed had solar panels named in the listing, up from 0.87% in the same months of 2023. The price has not followed. Compared with similar homes without solar, the solar homes sold at a median $207 per square foot against $205, for the same share of the asking price and in the same number of days.
That is the gap between how solar is marketed and how it has closed. Listing remarks call the panels an energy saver, a value add or a way to cut the power bill. The closed sales, read like for like, show no premium that stands apart from ordinary variation.
How the solar listings were counted
There is no solar field in the archive, so the study reads the public remarks written for each listing. A home counts as a solar listing when its remarks name an electric solar installation: solar panels, a solar system or solar energy system, solar power, a solar array, photovoltaic or PV panels, or a system size in kilowatts. Solar pool heating, solar water heaters, solar screens, solar tubes and solar attic fans are left out, because none of them is rooftop power. A hand check of 30 randomly drawn solar listings found all 30 described panels or a solar power system.
Remarks are only in the archive from 2023, so the series starts there; the missing text before 2023 is an archive limit, not an absence of solar. Annual shares use the same January to July window every year because the archive runs through August 13, 2026 and July is the last complete month. The price comparison pools every resale closing from January 2023 through July 2026.
Twice as many solar listings as in 2023
The share of resale closings with solar panels in the remarks went from 0.87% (87 sales) in January to July 2023 to 1.31% (127) in 2024, 1.45% (138) in 2025 and 1.76% (174) in 2026. The early months of 2023 were the low point of the series: over full calendar years the share was 0.98% in 2023, 1.33% in 2024 and 1.39% in 2025, a slower climb than the January to July figures alone suggest, but still up by about four tenths in two years.
The rise shows up in each of the four largest counties. In January to July, Duval went from 0.61% to 1.51%, St. Johns from 1.32% to 1.95% and Clay from 1.48% to 2.10%. Nassau went from 0.62% to 2.96% on a much smaller count of sales. Across all months since 2023, Nassau (2.16%), Clay (1.79%) and St. Johns (1.70%) had the highest shares and Duval the lowest of the four (1.04%).
Solar homes and comparable homes sold alike
On raw medians the solar homes look more expensive: $450,000 against $378,000 for other resale homes. They are also bigger (2,201 against 1,830 square feet) and newer (a median build year of 2010 against 1994). Once size is taken out, raw price per square foot is almost level, $209 against $207.
The like-for-like test compares each solar sale with the median of resale homes without solar in the same close year, county, 400 square foot size band and build decade. Across 721 solar sales with at least ten comparable homes, the typical solar home closed 0.5% higher on price per square foot, 0.1 points lower on the share of original asking price (96.2% against 96.4%), and with no difference in days on market (39 days each). None of those gaps is large enough to read as a premium or a penalty.
Rival explanations we tested
- One year hiding another. By close year, the price per square foot gap was -0.3% in 2023, +1.8% in 2024, +1.8% in 2025 and -0.2% in 2026. It moves around zero rather than building.
- County mix. The gap was -0.5% in Duval (328 sales), -1.0% in St. Johns (207), +3.0% in Clay (125) and +1.8% in Nassau (57), mixed in sign and small everywhere.
- Pool homes. Solar homes are more likely to have a pool, which carries its own premium. Setting aside every listing with private pool language on both sides, the gap was -1.4% across 557 solar sales.
- Owned versus financed systems. A paid-off system might sell for more than one with a loan attached. Listings that said the system was owned or paid off came in 0.7% higher on price per square foot (175 sales); listings that mentioned a loan, lease or payoff came in 0.2% lower (68 sales). Both are within the same narrow band.
- Partial year. The share figures use the same January to July window each year, and the full calendar years 2023 to 2025 and the August to December months (1.17%, 1.36% and 1.31%) confirm a rise that is real but gentler after 2024.
What this cannot capture: remarks do not record system size, age, battery storage or the monthly payment, and the comparison does not see lot, condition or finish. A premium for a specific large, owned, recent system could be hidden inside the averages. The finding is that solar, as it has been listed and sold here since 2023, does not show up as a price premium in the closed data.
Two in three solar listings never say who owns the panels
Across the 764 solar listings, 24% said the system was paid off, owned or included, 10% mentioned a loan, lease or payoff, and 67% gave no ownership detail. Loan and lease wording grew from 1.1% of solar listings in January to July 2023 to 12.6% in 2026, while the silent share fell from 77.0% to 59.8%. The common loan phrasing is that the seller will pay the balance off at closing or that the buyer will take over the payment. The ownership labels come from wording near the solar mention, so they are approximate.
How agents can use this data
- Price the house, then the system. In this archive solar homes closed at the same price per square foot as comparable homes, so a list price that adds the installed cost of the panels on top of the comps is working against the record. If a seller expects the system to be paid for in the price, show them the like-for-like figures above and the matched sales in their own size band.
- Get the ownership paperwork before the photos. Two in three solar listings did not say whether the system is owned, financed or leased. Collecting the payoff letter, lease or purchase agreement at listing time lets the remarks state it plainly and keeps it from surfacing during the contract period.
- Document the savings rather than describing them. Remarks often quote a monthly power bill. Twelve months of utility statements in the listing file give buyers and appraisers the same figure with a source behind it, the same approach covered in our look at roof dates in listings.
- Read features in comps the same way. Solar joins other remarks-based features we have measured, from private pools to assumable mortgages. Checking a feature against like-for-like sales before crediting it in a comparative market analysis keeps the adjustment defensible.
Whichever way you use the numbers, cite the source: Momentum Research analysis of data provided by realMLS, resale single family closings January 2023 through July 2026, deemed reliable but not guaranteed.
What this measurement does not do
It does not forecast, value any home or judge any listing. It measures listing text, prices and time on market for homes, never the people buying or selling them, and it should be read alongside a current comparable-sales analysis rather than in place of one. It is not advice on whether to install solar panels.
People also ask
Do solar panels increase home value in Jacksonville?
In the resale records they have not shown a measurable premium. From January 2023 to July 2026, 721 Northeast Florida resale homes whose listing named solar panels closed at a median $207 per square foot against $205 for comparable homes without solar in the same year, county, size band and build decade. The typical gap was +0.5% on price per square foot and 0.1 points on the share of original asking price, and days on market matched at 39.
How common are solar panels on homes for sale in Northeast Florida?
Still uncommon, but growing. Solar panels were named in 1.76% of resale single family listings that closed January to July 2026 in the seven counties realMLS covers, up from 0.87% in the same months of 2023. Over full calendar years the share went from 0.98% in 2023 to 1.39% in 2025.
What happens to leased or financed solar panels when you sell a house?
The listing and the contract have to settle it, and most listings do not say. Of the 764 solar listings from 2023 to 2026, 24% said the system was paid off or owned, 10% mentioned a loan, lease or payoff, and 67% gave no ownership detail. Listings that mention a loan most often state that the seller will pay it off at closing or that the buyer takes over the payment, so the loan or lease paperwork is worth requesting early.
Method and limits
Source: data provided by realMLS. Closed resale single family sales (NewConstructionYN false, PropertySubType Single Family Residence) in the authoritative counties of Duval, St. Johns, Clay, Nassau, Putnam, Baker and Bradford, with listing remarks present. Records are deduplicated on listing id plus close date; sales under $10,000, under 500 square feet, or with a close price below half or above one and a half times the original list price are dropped. Listing remarks (PublicRemarks) exist in the archive from 2023 only. Annual shares use January through July of every year; the archive ends on August 13, 2026, so July is the last complete month. The pooled comparison covers January 2023 through July 2026.
A solar listing is one whose remarks name solar panels, a solar system, solar energy system, solar power, a solar array, solar PV, solar electric, photovoltaic panels or a kilowatt system size, excluding matches next to pool, water heater, attic fan, screen, light, tube or shade wording. Comparable homes are resale sales without solar in the same close year, county, 400 square foot living-area band and build decade; a solar sale is compared only when its cell holds at least ten comparable sales. Reported gaps are the median across solar sales of each sale's difference from its cell median. Ownership wording is read from the text around the solar mention.
System size, age, battery storage, payment terms, appraisal outcomes and property condition are not observed. Cause is not identified.
Related reading on the same archive: no HOA as a selling point, listing description words, sold over asking, net of the seller credit and the ongoing Jacksonville housing market tracker.
All figures on this page are per Momentum Research analysis of data provided by realMLS and are deemed reliable but not guaranteed. Equal Housing Opportunity.