
Data Analysis
111 of the 355 condos for sale in Bay County on October 27, 2026 had been on the market 180 days or more, against 102 of 567 single-family homes.
Our Central Panhandle MLS map showed 31% of active Bay County condos listed six months or longer. 160 of the 355 sit in FEMA A or V flood zones.
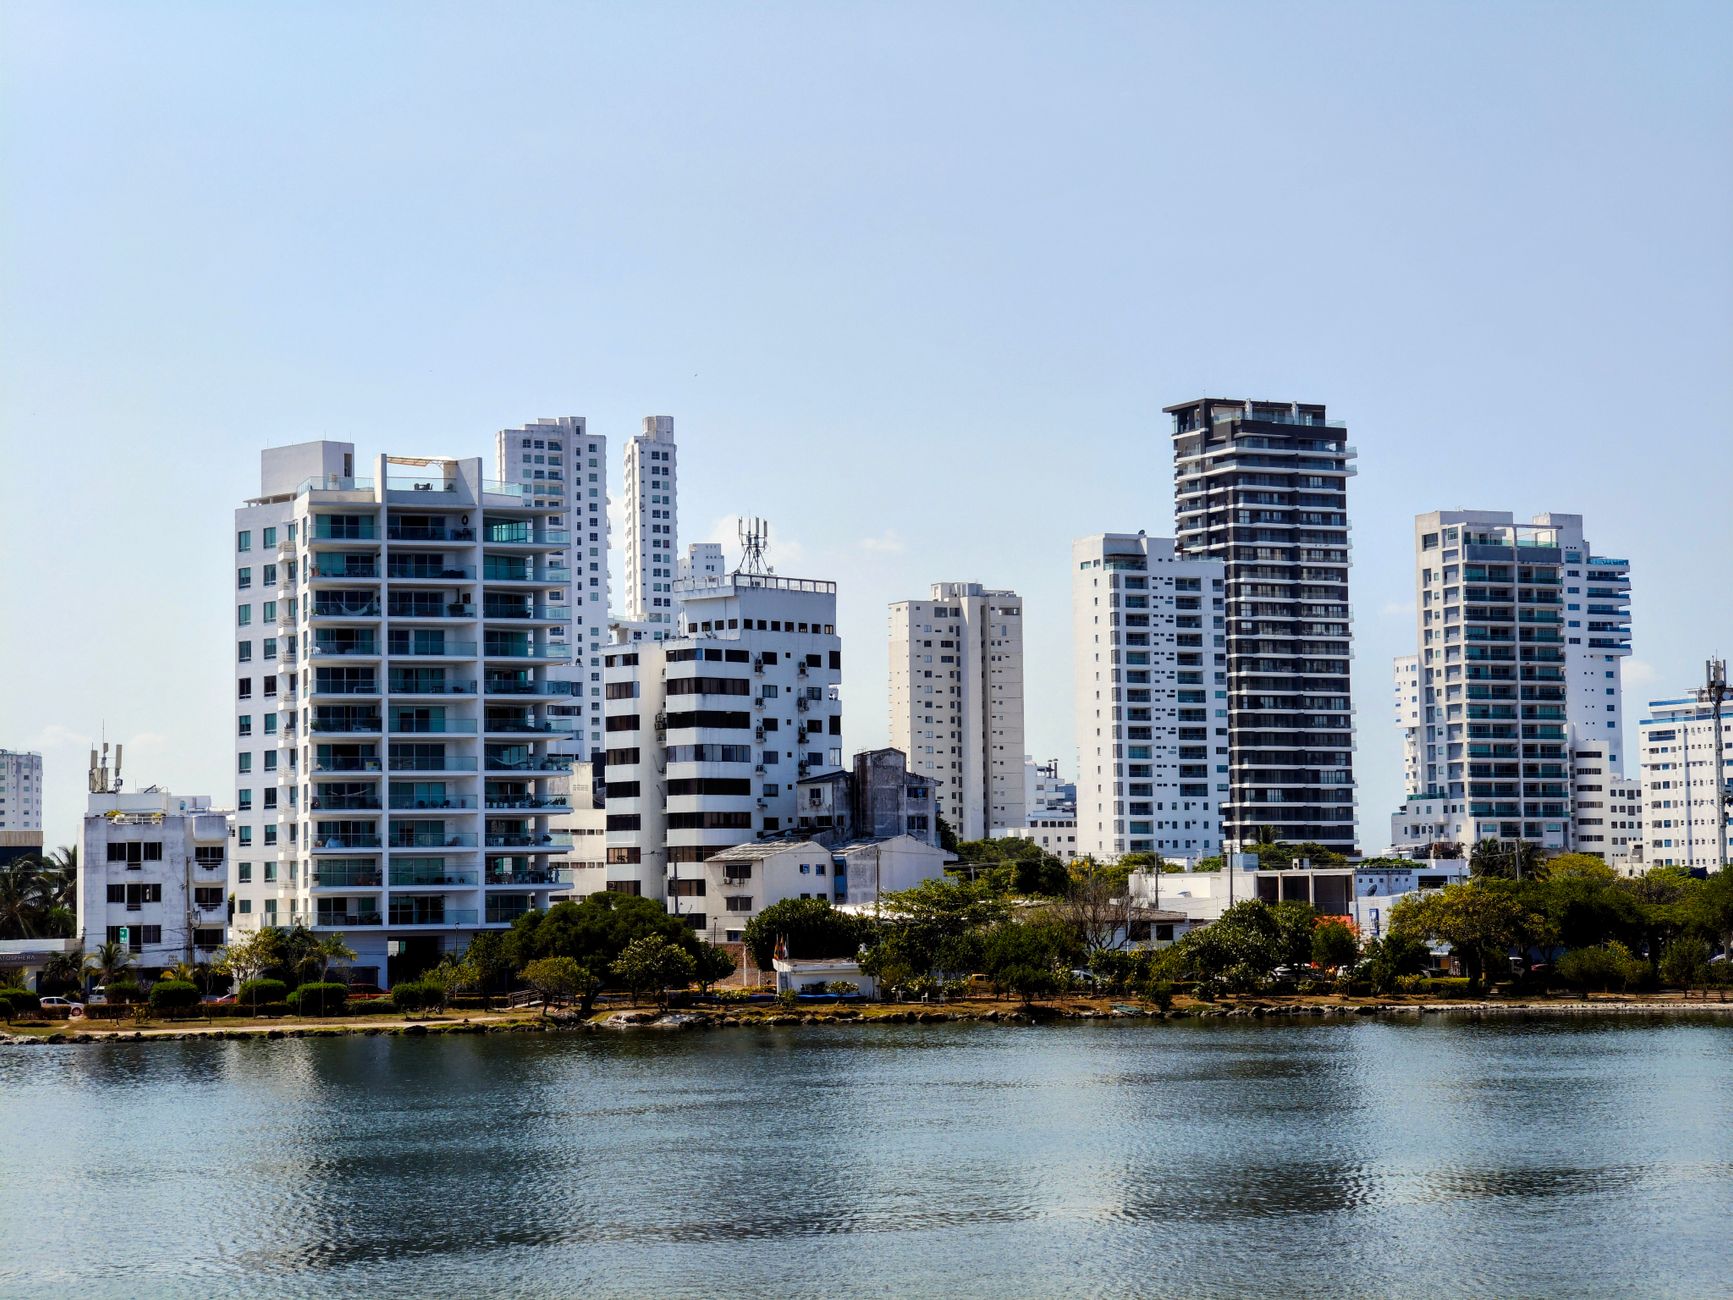
Our live Central Panhandle MLS map showed 355 active condo listings in Bay County on October 27, 2026, and 111 of them, or 31 percent, had been on the market 180 days or more. Forty had been listed a year or more. For the 567 active single-family homes, the share at 180 days or more was 18 percent (102 homes). The median active condo had been listed 98 days at a median asking price of $349,900, against 74 days and $450,000 for single-family homes. 160 of the 355 condos, or 45 percent, map inside a FEMA A or V flood zone, against 18 percent of single-family listings. All figures are ours, computed from Central Panhandle MLS records.
This is a snapshot of how long Bay County listings have been for sale, by property type. Our September articles on the Panama City median price, days on market and closed sales cover completed-month metrics for sold homes, and the full series sits on the Panama City market data hub. Our recent piece on Panama City new construction share covers builder activity.
How long have Panama City condos been for sale?
Days on market here is the figure reported on each active listing on October 27. Condos sit longer than other property types at every threshold.
| Property type | Active listings | Median asking price | Median days on market | Listed 90+ days | Listed 180+ days | Listed 365+ days |
|---|---|---|---|---|---|---|
| Condo | 355 | $349,900 | 98 | 189 | 111 | 40 |
| Single-family | 567 | $450,000 | 74 | 247 | 102 | 23 |
| Other attached and multi-unit | 140 | $299,900 | 67 | 61 | 32 | 8 |
| Manufactured | 36 | $225,000 | 70.5 | 12 | 3 | 2 |
| All types | 1,098 | $390,000 | 79 | 509 | 248 | 73 |
Source: Momentum Research, computed from Central Panhandle MLS records, live map snapshot, October 27, 2026. Bay County addresses only. Deemed reliable but not guaranteed.
Condos are 32 percent of active Bay County listings but 45 percent of those listed 180 days or more, and 55 percent of those listed a year or more.
Where are the long-listed condos?
Panama City Beach holds most of the condo supply. Of the 355 active condos, 267 carry a Panama City Beach address, and 84 of those had been listed 180 days or more. Another 87 carry a Panama City address, with 27 at 180 days or more. By ZIP code, 32408 had 155 active condos (51 listed 180 days or more), 32413 had 142 (44) and 32407 had 48 (14).
Recent prices for each place are on the Panama City Beach and Panama City market pages, and condo buildings are listed on our Bay County condo communities page.
Which condo price ranges are moving slowest?
The middle of the condo market carries most of the long-listed inventory.
| Condo asking price | Active condos | Median days on market | Listed 180+ days |
|---|---|---|---|
| Under $250,000 | 70 | 88 | 18 |
| $250,000 to $399,999 | 142 | 100 | 46 |
| $400,000 to $599,999 | 81 | 112 | 26 |
| $600,000 to $999,999 | 49 | 102 | 17 |
| $1 million and above | 13 | 53 | 4 |
Source: Momentum Research, computed from Central Panhandle MLS records, live map snapshot, October 27, 2026. Deemed reliable but not guaranteed.
Condos between $250,000 and $399,999 are the largest group, and 46 of the 142 had been listed six months or more. Condos priced from $400,000 to $599,999 had the longest median time on market, 112 days.
Are Panama City condos still going under contract?
Yes, at a slower rate relative to supply than houses. From October 13 to 26, 2026, our feed's change log recorded 38 Bay County condos going under contract, against 67 new condo listings and 72 condo price cuts. Single-family homes recorded 86 contracts, 197 new listings and 162 price cuts. The median price cut across all Bay County listings was 2.5 percent, or $10,000.
The 31 pending condos on our map on October 27 had a median 113 days on market, so many condos that do sell have already sat for months.
Why does the flood zone share matter for condo buyers?
Flood zone affects insurance and lending costs. Of the 355 active condos, 160 map inside a FEMA A or V zone in our geocode lookup, including 113 of the 267 in Panama City Beach. For single-family homes the figure was 100 of 567. Condo owners also share building costs through association fees, reserves and any special assessments. Our Panama City Beach flood zones by neighborhood, Panama City Beach home insurance cost, Bay County HOA fees by community, Florida condo special assessments and Florida condo distress tracker pages cover those costs.
People also ask
How long do condos take to sell in Panama City Beach?
On October 27, 2026, the median active condo in Bay County had been listed 98 days in our Central Panhandle MLS data, and 111 of 355 active condos had been listed 180 days or more. Of the 267 active condos with a Panama City Beach address, 84 had been listed at least 180 days.
How many condos are for sale in Panama City Beach?
Our live map showed 267 active condo listings with a Panama City Beach address and 355 across Bay County on October 27, 2026. The Bay County median condo asking price was $349,900.
Are Panama City Beach condos in a flood zone?
Many are. In our data, 113 of the 267 active Panama City Beach condos on October 27, 2026 map inside a FEMA A or V flood zone. Buyers should confirm the zone for a specific building with an elevation certificate and the county flood map.
Limitations
Days on market is the figure reported on each listing and may reset when a listing is withdrawn and relisted, so some homes may have been for sale longer than shown. The snapshot covers listings on our map at one point on October 27, 2026; counts change daily. Bay County is identified by listing city and ZIP code, and ZIP 32456 listings were excluded as mostly Gulf County. Property type comes from the MLS field; "other attached and multi-unit" includes townhouse-style and duplex listings the feed does not classify as condo or single-family. Flood zone comes from matching each listing's map point to FEMA zones and can be wrong near a zone boundary. The feed's change log had refresh gaps on some days in early and mid-October, so contract and price cut counts may be slightly low. Figures may be revised as the MLS updates records. This article is general information, not advice about any specific property or transaction.
Sources and links
- Momentum Research, computed from Central Panhandle MLS records (live map snapshot, October 27, 2026; listing change log, October 13 to 26, 2026). Listing information provided by the Central Panhandle Association of REALTORS®. Information is deemed reliable but not guaranteed by the MLS to be accurate.
- FEMA National Flood Hazard Layer, as matched to listing locations by Momentum Research.
- Full monthly series and per-feed attribution: Panama City market data
Disclosure: Jon Brooks is a co-founder of Momentum Realty, a Florida real estate brokerage that owns and funds Florida Housing Intelligence. Momentum has a financial interest in Florida real estate transactions, including in markets named here. See our editorial standards.
Market statistics in this article are computed from MLS data licensed by Momentum Realty, and are current as of the date shown. Data may be preliminary and subject to revision by its source. This article is general information, not advice about any specific property, transaction, or financial decision, and is not a representation about any specific property, community, builder, or association.
Equal Housing Opportunity. Editorial standards · Corrections · About