
Data Analysis
New construction made up 88 of 405 new listings, 63 of 230 new contracts and 48 of 137 recorded closings in the Panama City area from October 10 to 23, 2026.
Our Central Panhandle MLS feed shows builder homes took 22% of new listings and 35% of recorded closings in the two weeks to October 23, 2026. Corrected November 10, 2026.
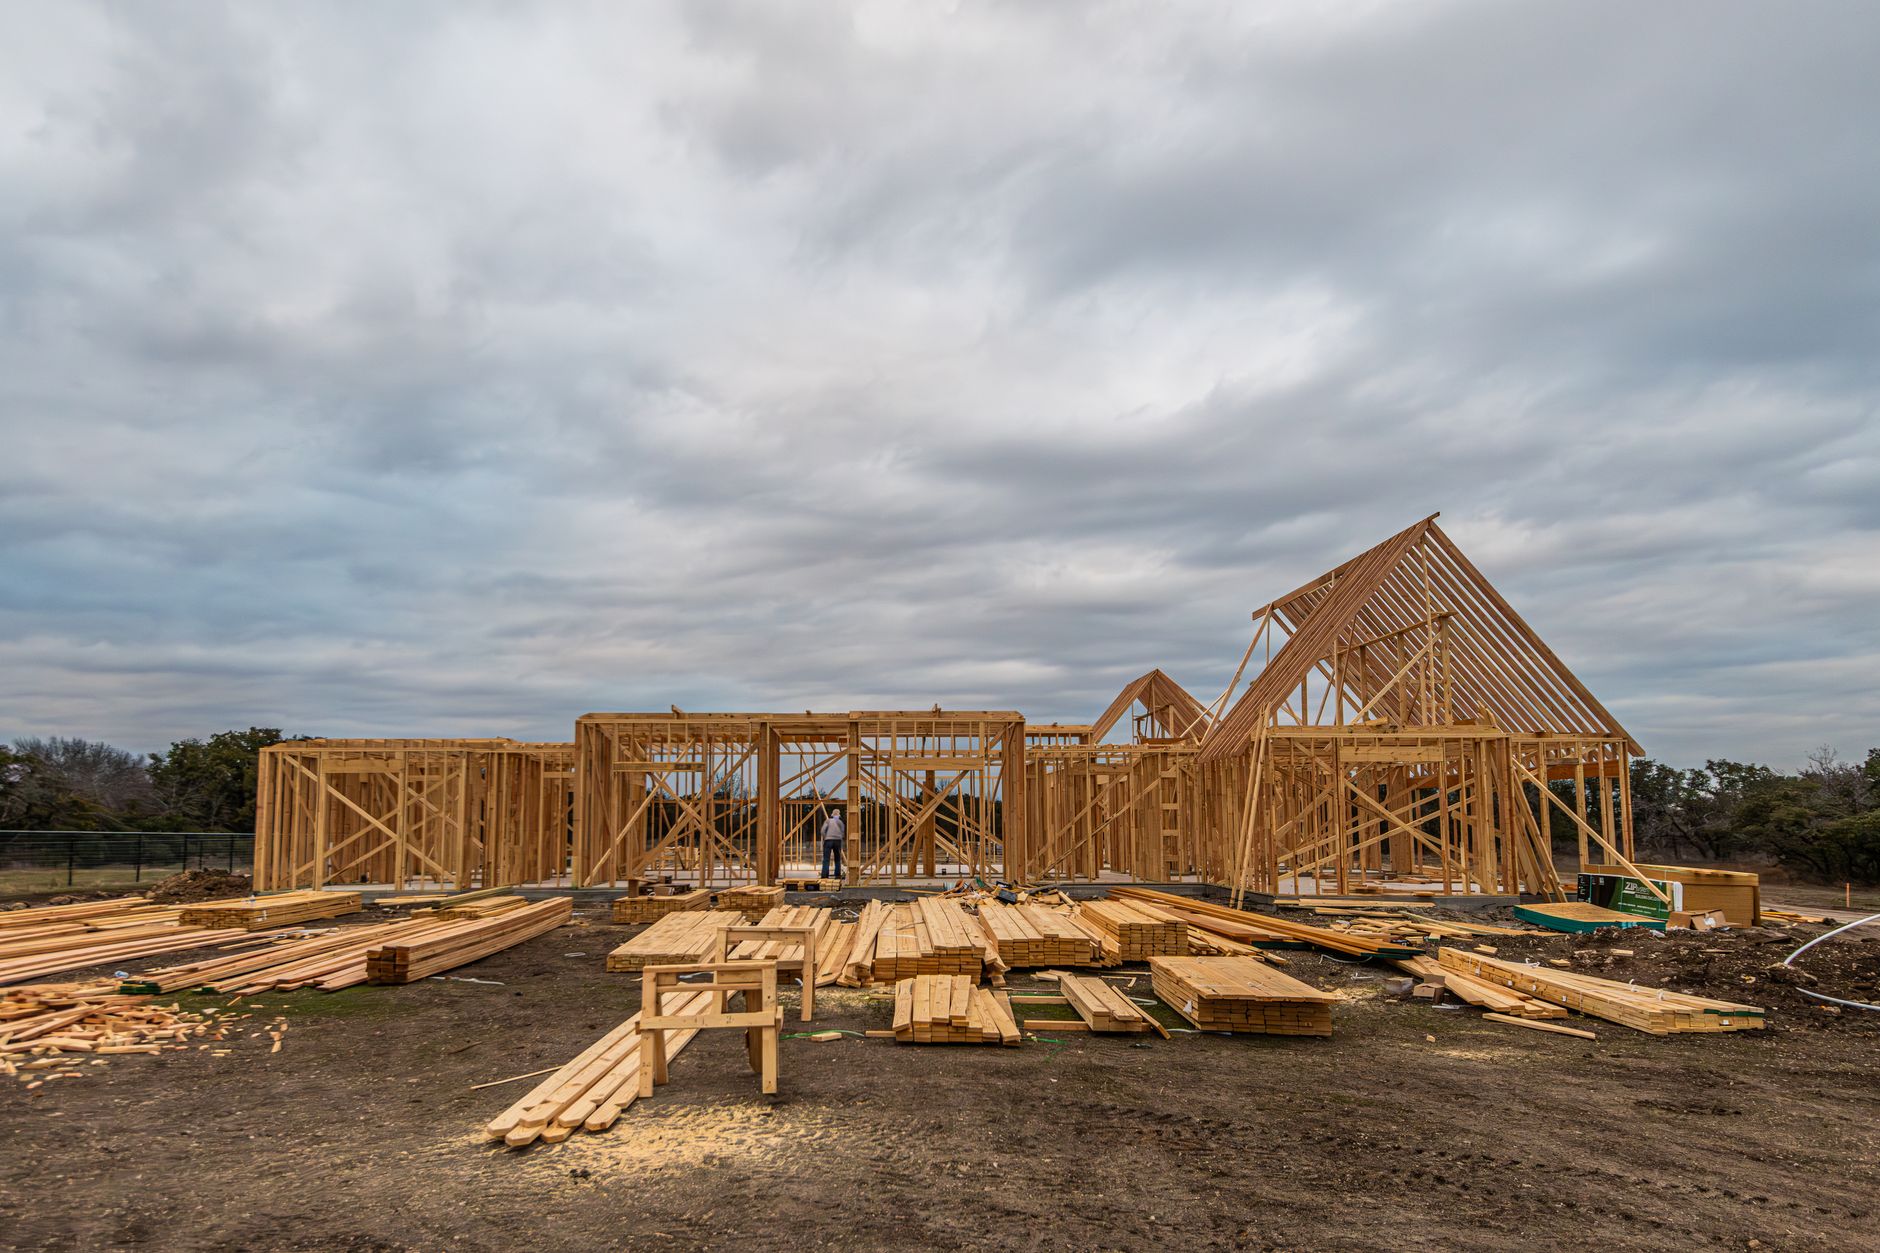
From October 10 through October 23, 2026, new construction accounted for 88 of 405 new listings (22 percent), 63 of 230 listings that went under contract (27 percent) and 48 of 137 closings (35 percent) recorded by our live Central Panhandle MLS feed, which covers Bay County and nearby counties. New construction listings carried a median asking price of $353,163, against $359,000 for resale listings. Builders also accounted for 49 of the 56 list price increases in the window. All figures are ours, computed from Central Panhandle MLS records; information is deemed reliable but not guaranteed.
This is a two-week read on new construction activity. Our September articles on the Panama City median price, days on market, closed sales and seller concessions cover the completed-month metrics, and the full series sits on the Panama City market data hub. This piece covers only the builder share of listing activity since early October.
How much of new supply in the Panama City area is new construction?
New construction held about the same share of new supply in mid-October as in the days before. In the 14 days from October 10 to October 23, builder homes were 88 of 405 new listings, or 21.7 percent. In the 10 days from September 30 to October 9 they were 74 of 337, or 22.0 percent.
Almost all of the new construction was single-family. Of the 88 builder listings, 86 were single-family homes, 1 was an attached home and 1 was a manufactured home. Resale supply also included 57 condominiums, 32 attached homes and 19 manufactured homes.
By place, Panama City led with 44 new construction listings, followed by Panama City Beach with 21. Port St. Joe added 9, Southport 6 and Chipley 4. By ZIP code, 32404 led with 36 builder listings and 32413 followed with 13. The communities with the most new builder listings were Liberty with 16, Magnolia Ridge and WindMark with 6 each, and Hodges Bayou Plantation with 4. One listing office, DR Horton Realty of Emerald Coast, listed 20 of the builder listings.
Where do builder homes sit in the price range?
Builder homes are concentrated in the lower and middle price bands. Of the new construction listings, 53 of 88 were under $400,000. Resale listings under $400,000 were 186 of 317.
| List price band | New construction listings | Resale listings | New construction contracts | Resale contracts |
|---|---|---|---|---|
| Under $300,000 | 26 | 114 | 21 | 56 |
| $300,000 to $399,999 | 27 | 72 | 20 | 35 |
| $400,000 to $599,999 | 20 | 64 | 10 | 40 |
| $600,000 to $999,999 | 8 | 48 | 5 | 28 |
| $1 million and above | 7 | 19 | 7 | 8 |
Source: Momentum Research, computed from Central Panhandle MLS records, October 10 to 23, 2026. Deemed reliable but not guaranteed.
The contract mix follows the same pattern. Builder homes that went under contract had a median list price of $329,900, against $385,000 for resale homes. Under $400,000, new construction accounted for 41 of 132 new contracts.
Are builders cutting prices or raising them?
Both, and the increases stand out. Our feed recorded price cuts on 453 active listings in the two weeks, and 113 of them were new construction. The median builder cut was 2.3 percent, or $7,150, against 2.8 percent, or $10,000, on resale listings. One builder cut reached 10 percent; 27 resale cuts did.
Price increases were rare and mostly came from builders. Of the 56 listings that raised their price in the window, 49 were new construction, with a median increase of $10,000, or 3.5 percent. They were spread across communities including Parkbrook, Sweetbay, Magnolia Ridge, Breakfast Point East and Salt Grass at Ward Creek.
How much of what is closing is new construction?
Closings show the largest builder share. Of the 137 closings our feed recorded from October 10 to 23, 48 were new construction, or 35 percent, up from 39 of 133, or 29 percent, from September 30 to October 9. Builder closings had a median price of $333,345, against $365,000 for resale closings.
That share is higher than the completed-month figure. Our September Panama City Market Pulse, with closings through October 21, found new construction made up about 27 percent of September sales, with a median sale price of $320,000 across all residential types.
What does this mean for buyers and sellers in the Panama City area?
For buyers, builder homes make up a large part of what is available under $400,000, and builders are cutting less often and by smaller amounts than resale sellers. Current builder inventory is on the Panama City new construction and Panama City Beach new construction pages, and the Bay County new construction communities page lists the communities we track. Recent resale prices are on the Panama City, Panama City Beach and Lynn Haven market pages.
For resale sellers in the same price bands, new construction is the direct competition. Carrying costs matter to both; our Panama City home insurance cost and Panama City Beach home insurance cost pages show what buyers budget for coverage.
People also ask
How much of the Panama City housing market is new construction?
From October 10 to 23, 2026, new construction made up 22 percent of new listings, 27 percent of new contracts and 35 percent of recorded closings in our Central Panhandle MLS feed.
Are new homes cheaper than resale homes in Panama City?
In the two weeks to October 23, 2026, new construction listings had a median asking price of $353,163, against $359,000 for resale listings, in our Central Panhandle MLS feed. The mix of home types differs between the two groups.
Are Panama City builders cutting prices?
Builders cut prices on 113 listings from October 10 to 23, 2026, with a median cut of 2.3 percent, smaller than the 2.8 percent median resale cut. Builders also made 49 of the 56 price increases.
Limitations
Counts come from the change log of our live Central Panhandle MLS feed, which records a change when our refresh sees it. New construction status comes from the listing's own MLS field. A listing that changed more than once in a category within the window is counted once. Closings counted here are closings recorded by our feed in the window and can differ from the monthly closed sales count, which uses close dates and its own definitions. The earlier comparison window is 10 days and includes a day with an unusually high event count, so the share comparisons are more reliable than raw count comparisons. Median prices mix property types and sizes. Figures may be revised as the MLS updates records. This article is general information, not advice about any specific property or transaction.
Correction, November 10, 2026: an earlier version of this article, built from our feed's rolling change log, said new construction made up 84 of 295 new listings (28 percent) and 33 of 133 contracts (25 percent) from October 10 to 23, against 51 of 207 listings from September 30 to October 9, with 22 of 27 price increases and 67 of 283 price cuts. A recount of the archived MLS snapshots (new listings by MLS listing date, contracts by the MLS contract status change date and status, new construction by the MLS flag, cuts and increases as asking price changes between daily snapshots) gives 88 of 405 (22 percent), 63 of 230 (27 percent) and 74 of 337, with 49 of 56 increases and 113 of 453 cut listings. The price band table, place, ZIP, property type, median price and price cut figures and the text above were updated. Closings, community and listing office counts and the size of price increases were not recounted, so the closing figures keep their original wording; the page title no longer states a closing share.
Sources and links
- Momentum Research, computed from Central Panhandle MLS records (listing change log, September 30 to October 23, 2026). Listing information provided by the Central Panhandle Association of REALTORS®. Information is deemed reliable but is not guaranteed by the MLS to be accurate.
- Momentum Research, September 2026 Panama City Market Pulse, closings through October 21, 2026.
- Full monthly series and per-feed attribution: Panama City market data
Disclosure: Jon Brooks is a co-founder of Momentum Realty, a Florida real estate brokerage that owns and funds Florida Housing Intelligence. Momentum has a financial interest in Florida real estate transactions, including in markets named here. See our editorial standards.
Market statistics in this article are computed from MLS data licensed by Momentum Realty, and are current as of the date shown. Data may be preliminary and subject to revision by its source. This article is general information, not advice about any specific property, transaction, or financial decision, and is not a representation about any specific property, community, builder, or association.
Equal Housing Opportunity. Editorial standards · Corrections · About