
Data Analysis
Charlotte County had 2,865 homes for sale and 590 under contract or pending on October 28, 2026, about 4.9 to 1, with condos at 8.2 to 1 against 4.2 to 1 for single-family homes.
Our live Stellar MLS map showed 768 active Charlotte County listings on the market 180 days or more. Placida ran at 24 active listings per pending sale.
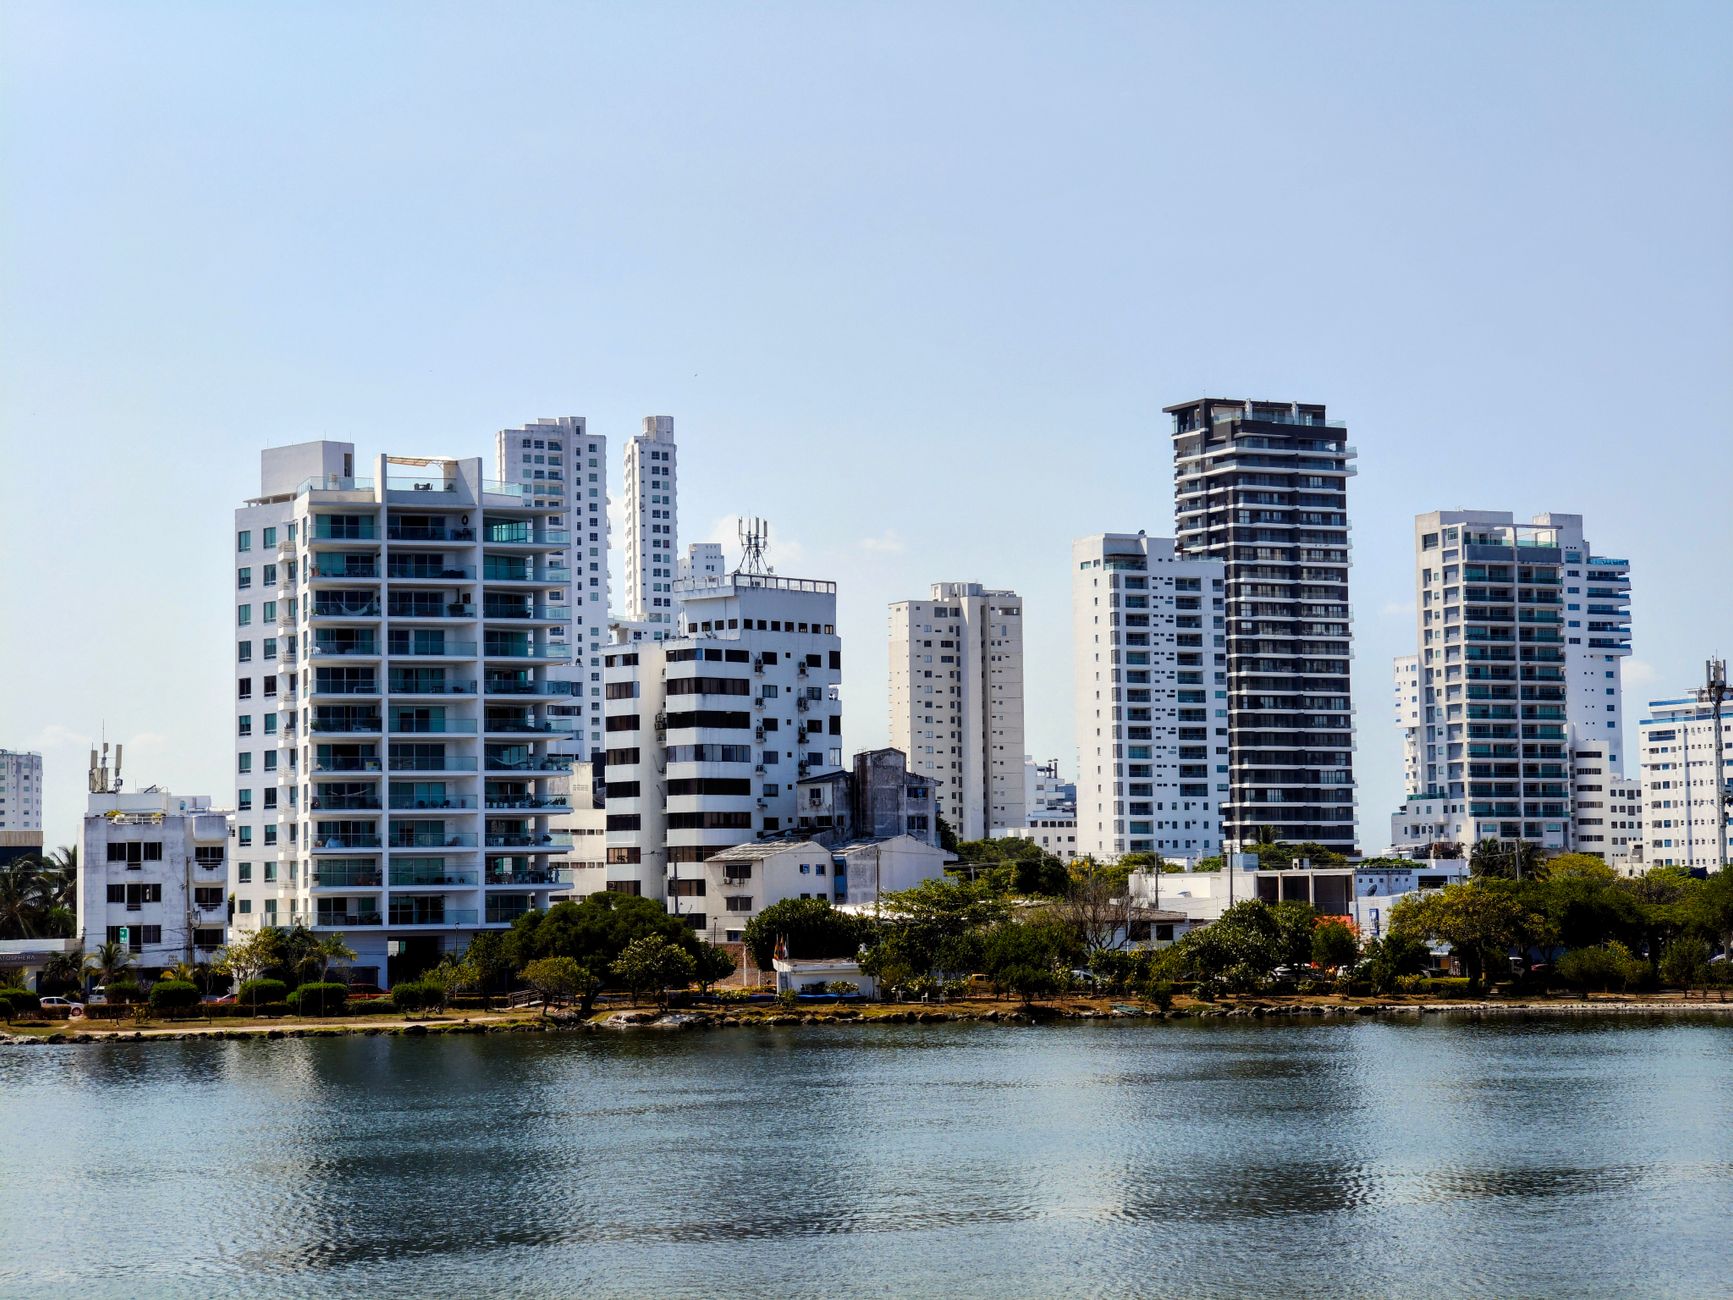
Our live Stellar MLS map showed 2,865 active listings and 590 listings under contract or pending in Charlotte County on October 28, 2026, about 4.9 homes for sale for every one in a contract. Single-family homes ran at 4.2 to 1, while condos ran at 8.2 to 1 and manufactured homes at 7.7 to 1. The median active listing was priced at $335,000 and had been on the market 84 days, and 768 active listings had been listed 180 days or more. All figures are ours, computed from Stellar MLS records; information is deemed reliable but not guaranteed.
This piece looks at the live balance of listings and contracts by property type, place and price. Our October 27 article on Charlotte County new-home communities covers builder pricing, and completed-month figures are in our Punta Gorda median price, days on market and closed sales articles. The full series sits on the Punta Gorda market data hub.
How many homes are for sale in Charlotte County?
The map counted 2,865 active Charlotte County listings on October 28, plus 362 under contract, 228 pending and 11 marked coming soon. Listings under contract or pending had a median list price of $325,000, a little below the $335,000 median for active listings.
Inventory age is the clearest pressure point. Of the 2,865 active listings, 768 had been on the market 180 days or more, about 27 percent, and 231 had been listed a year or more.
Which property types are moving slowest?
| Property type | Active | Under contract or pending | Active per contract | Median asking price | Median days listed |
|---|---|---|---|---|---|
| Single-family | 1,973 | 472 | 4.2 | $384,900 | 76 |
| Condo | 517 | 63 | 8.2 | $239,900 | 102 |
| Manufactured | 238 | 31 | 7.7 | $165,000 | 146 |
| Villa | 81 | 19 | 4.3 | $289,999 | 62 |
| Townhouse | 38 | 4 | 9.5 | $464,700 | 98.5 |
Source: Momentum Research, computed from Stellar MLS records, live map snapshot, October 28, 2026. Deemed reliable but not guaranteed.
Condos and manufactured homes carry most of the slack. Condos were 18 percent of active listings but 11 percent of contracts, and 162 of the 517 active condos had been listed 180 days or more. Manufactured homes had the longest median time on the market, 146 days, with 100 of 238 listed six months or longer. Single-family homes and villas moved at a similar pace, near 4 to 1.
How do Punta Gorda, Port Charlotte and Englewood compare?
| Place | Active | Under contract or pending | Active per contract | Median asking price | Median days listed |
|---|---|---|---|---|---|
| Port Charlotte | 1,333 | 277 | 4.8 | $329,000 | 74 |
| Punta Gorda | 860 | 206 | 4.2 | $319,250 | 87.5 |
| Englewood | 274 | 60 | 4.6 | $309,749 | 90 |
| Rotonda West | 186 | 37 | 5.0 | $384,950 | 95 |
| Placida | 169 | 7 | 24.1 | $620,000 | 154 |
| Boca Grande | 37 | 2 | 18.5 | $1,375,000 | 19 |
Source: Momentum Research, computed from Stellar MLS records, live map snapshot, October 28, 2026. Charlotte County listings only. Deemed reliable but not guaranteed.
Punta Gorda had the tightest balance of the larger places, 4.2 active listings per contract, though its median listing had been on the market longer than Port Charlotte's. Placida stood apart, with 169 active listings, only 7 in a contract and a median of 154 days listed. Recent prices for each place are on the Punta Gorda, Port Charlotte, Englewood and Rotonda West market pages.
Which price ranges have the most buyers?
| List price band | Active | Under contract or pending | Active per contract | Median days listed |
|---|---|---|---|---|
| Under $200,000 | 494 | 106 | 4.7 | 117.5 |
| $200,000 to $299,999 | 639 | 142 | 4.5 | 77 |
| $300,000 to $399,999 | 689 | 153 | 4.5 | 73 |
| $400,000 to $499,999 | 345 | 62 | 5.6 | 78 |
| $500,000 to $749,999 | 375 | 76 | 4.9 | 95 |
| $750,000 to $999,999 | 156 | 28 | 5.6 | 84 |
| $1 million and above | 167 | 23 | 7.3 | 91 |
Source: Momentum Research, computed from Stellar MLS records, live map snapshot, October 28, 2026. Deemed reliable but not guaranteed.
The $200,000 to $399,999 range held 1,328 active listings and 295 contracts, half of all contracts in the county, at about 4.5 to 1. Listings under $200,000 had a similar ratio but a much longer median time on the market, 117.5 days, a group that includes many condos and manufactured homes. The $1 million and above tier was the slowest, at 7.3 to 1.
What does this mean for buyers and sellers in Charlotte County?
For buyers, condos, manufactured homes and the top price tier offer the most choice and the most listings that have been for sale for months. Listings priced from $200,000 to $399,999 face the most competition from other buyers.
For sellers, a listing that has passed 180 days joins a large group, more than a quarter of the county's inventory. Insurance and carrying costs shape what buyers will pay. Budgets are on the Punta Gorda home insurance cost, Port Charlotte home insurance cost and Englewood home insurance cost pages. Condo owners can check association cost pressures on our Florida condo special assessments and Florida condo distress tracker pages.
People also ask
How many homes are for sale in Punta Gorda?
Our live Stellar MLS map showed 860 active listings in Punta Gorda on October 28, 2026, with 206 under contract or pending and a median asking price of $319,250. Charlotte County as a whole had 2,865 active listings.
Is the Charlotte County housing market slow?
On October 28, 2026, Charlotte County had about 4.9 active listings for every listing under contract or pending, and 768 active listings had been on the market 180 days or more. Condos ran at 8.2 to 1 and single-family homes at 4.2 to 1.
How many condos are for sale in Charlotte County?
Our live map showed 517 active Charlotte County condos and 63 under contract or pending on October 28, 2026. The median active condo was priced at $239,900 and had been listed 102 days.
Limitations
Figures are a single live map snapshot taken October 28, 2026, not monthly totals, and can differ from inventory counts in monthly reports. Charlotte County is identified from the county on each listing record, so Englewood and Boca Grande figures cover only their Charlotte County addresses. Under contract or pending includes listings marked either way in the MLS. Days listed is the listing's current count as reported to our feed and may reset when a listing is withdrawn and relisted. Property type comes from the MLS field. Figures may be revised as the MLS updates records. This article is general information, not advice about any specific property or transaction.
Sources and links
- Momentum Research, computed from Stellar MLS records (live map snapshot, October 28, 2026). Listings courtesy of Stellar MLS as distributed by MLS GRID. Information is deemed reliable but not guaranteed.
- Momentum Research, September 2026 Stellar MLS Market Pulse, closings through October 24, 2026.
- Full monthly series and per-feed attribution: Punta Gorda market data
Disclosure: Jon Brooks is a co-founder of Momentum Realty, a Florida real estate brokerage that owns and funds Florida Housing Intelligence. Momentum has a financial interest in Florida real estate transactions, including in markets named here. See our editorial standards.
Market statistics in this article are computed from MLS data licensed by Momentum Realty, and are current as of the date shown. Data may be preliminary and subject to revision by its source. This article is general information, not advice about any specific property, transaction, or financial decision, and is not a representation about any specific property, community, builder, or association.
Equal Housing Opportunity. Editorial standards · Corrections · About