
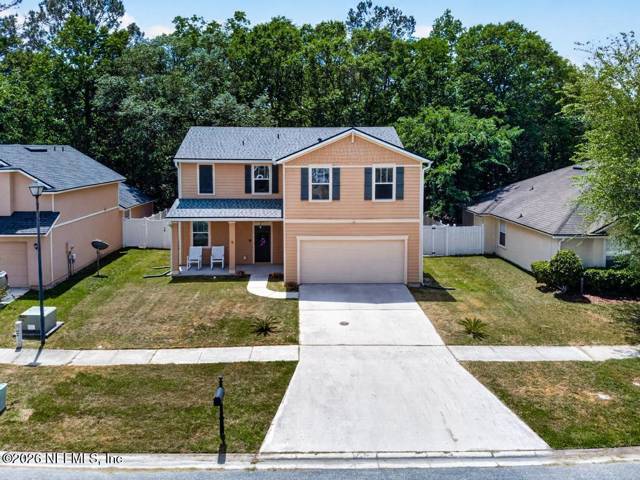
Callahan
Housing Market
Median sale price $329,000, down 12.3% year over year, with homes going under contract in about 37 days, 48 homes on the market.
Momentum ▲1
Your exact situation run against today's numbers: true comps, negotiation targets, and the off-market homes portals never show.
Selling instead? See what your home is worth today →

Housing Market Analyst
Inventory sits at 4.1 months of supply — balanced by the 3-to-6-month balanced benchmark, and 17% of listed homes are already under contract. Prices are down 12.3% versus the prior year, but sellers are still collecting 95.9% of asking. Taken together, the data points to a broadly balanced market where preparation decides who wins.
Who has leverage right now
Leverage scores are derived from the Momentum Score (supply, demand, speed, pricing power, and trend). Right now the data favors neither side decisively.
- Prices — balanced supply argues for a sideways market; condition and pricing decide individual outcomes.
- Inventory — tightening over the tracked window; watch whether that holds through the season.
- Negotiating power — buyers gain ground as 17% of inventory sits under contract.
- Mortgage sensitivity — at 5.4× income, this market is highly sensitive to rate moves; rate relief tends to show up in demand here quickly.
Derived from current Callahan data, not a prediction or guarantee. Markets move; talk to an agent before acting on any single reading.
Where Callahan is hot — and where it isn't
Each dot is a community (12 shown, sized by sales volume rank). Click any dot to open its full neighborhood guide.
The read on Callahan
The median sale price across Callahan currently stands at $329,000, down 12.3% from a year ago. Buyers are paying a median of $180 per square foot. The typical home goes under contract in about 37 days. Homes are selling for about 95.9% of their original asking price.
There are 48 active listings on the market, with 19 more already under contract. With 139 closed sales over the trailing 12 months (48 listings divided by 139 / 12), that works out to 4.1 months of supply — roughly balanced conditions by the 3-to-6-month balanced band.
Callahan prices sit below the Nassau County median by roughly 28%. Zillow's home value index for Nassau County stands at $484,962. About 27% of listings county-wide have taken a price cut — a useful gauge of seller flexibility.
Weighing supply, demand, speed, pricing power, and trend together, the Momentum Score for Callahan is 51 of 100 — balanced market territory. This page recalculates every day as new MLS data lands, so the numbers above reflect the market as of November 16, 2026.
Callahan since 2012 — and where it’s heading
A median home here sold for $106,039 in 2012 and $367,690 over the last recorded year — 247% appreciation across 14 years of recorded sales.
Median sale price · 2012–2026 (1,334 recorded sales)
Days on market by year
Home value trend · Nassau County (Zillow ZHVI)
For-sale inventory · county (Zillow)
Daily active vs pending · Nassau County (MLS)
Median price · daily recalculation
What’s driving Callahan
Top inbound states: GA, SC, CA, NC. Movers arriving report ~$143,143 average income. Source: IRS SOI county-to-county migration, 2022-2023
1,104 Citizens personal-lines policies in Nassau County; average premium $1,832 before the 2026 change, $1,672 after (-8.7%). Citizens is the state-backed insurer of last resort; budget insurance into any Nassau purchase. Source: Citizens Property Insurance Corporation, 2026 Approved Rate Changes by County (ALL PERSONAL LINES COMBINED table).
887 single-family · 173 multi-family · 10.8 per 1,000 residents. Future supply pressure starts here. Source: U.S. Census Bureau, Building Permits Survey, 2025
The calls we’re making from today’s data
The sharpest 1-yr median swing among tracked communities. Thin samples can exaggerate swings — verify with a comp analysis before treating it as trend.
Both sides have a case: buyers should negotiate on days-on-market, sellers should lean on the under-contract rate. Preparation, not the market, decides who wins a balanced tape.
Generated from today’s data by Momentum’s analysis engine and reviewed on a rolling basis by our broker team.
How it stacks up across Nassau County
| Market | Median | Active | Score | |
|---|---|---|---|---|
| Callahan ← this page | $329K | 7 | 51 | |
| Yulee | $406K | 146 | 61 | Open → |
| Fernandina Beach | $565K | 92 | 50 | Open → |
| Hilliard | $346K | 25 | 49 | Open → |
| Bryceville | $432K | 1 | 55 | Open → |
Neighborhoods on the move
No tracked community with enough sales rose in price over the past year.
| CallahanCallahan | $289K | ▼ 7% |
| Amhurst OaksCallahan | $325K | 2 |
| Lee Stoner ShoresCallahan | $305K | 2 |
| Swallowfork EstatesCallahan | $321K | 1 |
| CallahanCallahan | $289K | 42 days |
Callahan ZIP codes
Most active communities
More on Callahan
Put this data to work
The questions people actually ask
Should I buy a house in Callahan right now?
The data says conditions currently favor neither side decisively in Callahan — the Momentum Score reads 51/100 with 4.1 months of supply. For buyers that means preparation over hesitation: well-priced homes still move fast, but there is more room to negotiate than a year ago. The right timing always depends on your rate, your equity, and how long you plan to stay — not just the market.
Is Callahan becoming more affordable?
Yes, modestly — the median sale price in Callahan is $329,000, down 12.3% versus the prior year, while sellers still capture 95.9% of asking price. Softening prices plus normal-length marketing times mean affordability is improving at the margin, though financing costs matter more than list prices for most monthly payments.
Where are prices falling fastest in Callahan?
Among tracked communities with enough sales to measure, the sharpest 1-year median declines are Callahan (-7%). Note that community-level medians move on small sale counts — a few high- or low-end closings can swing them — so treat these as leads for a comp analysis, not verdicts.
Which Callahan neighborhoods are most competitive?
Measured by speed of sale, the fastest-moving tracked communities right now are Callahan (42 days) — homes there go under contract well ahead of the market-wide pace of 37 days.
How does Callahan compare to the rest of Nassau County?
Callahan's median of $329,000 runs 28% below the county-wide median of $455,350, and homes here take 37 days to go under contract versus 55 county-wide.
Momentum Realty in Callahan: our agents closed 9 homes here for buyers and sellers in the last 12 months (5 as the listing brokerage, 4 representing the buyer), median sale $379,000 (brokerage closed records through November 2026). Find a Momentum agent near Callahan →
Callahan housing market FAQ
How is the housing market in Callahan right now?
As of November 16, 2026, the Callahan housing market is roughly balanced: the median sale price is $329,000 (down 12.3% year over year), 48 homes are for sale against 139 sales in the last 12 months, which is 4.1 months of supply, and the typical home goes under contract in about 37 days.
How much is a house in Callahan?
The median home sold for $329,000 in Callahan over the last 12 months, about $180 per square foot; asking prices on the 48 current listings run from well below to well above that, and the community pages linked below show what each neighborhood actually sells for.
Is it a good time to sell a house in Callahan?
By the numbers, sellers in Callahan are getting 95.9% of asking price and going under contract in about 37 days with 4.1 months of supply. Under three months of supply generally favors sellers, three to six is balanced, and over six favors buyers. Whether it is a good time for you depends on what you paid and where you are going next, which is a conversation with an agent, not a chart.
What is the Callahan housing market forecast?
Momentum Realty publishes the recorded trend, not a prediction: Callahan median sale prices are down 12.3% year over year, inventory stands at 4.1 months of supply, and 17% of listings are under contract. The charts on this page update with every MLS refresh, so the direction shows up here before any forecast catches it.
What is the median home price in Callahan?
The median sale price in Callahan is currently $329,000, down 12.3% from a year ago, based on MLS sales data updated November 16, 2026.
Is Callahan a buyer's or seller's market right now?
The data currently is roughly balanced. Callahan scores 51 of 100 on the Momentum Score, with 4.1 months of housing supply. Conditions change; this page updates daily.
How long do homes take to sell in Callahan?
The typical home in Callahan goes under contract in about 37 days, per current MLS data.
How many homes are for sale in Callahan?
There are approximately 48 active listings in Callahan as of November 16, 2026.
Are home prices in Callahan rising or falling?
Median sale prices are down 12.3% year over year based on a rolling comparison of MLS sales.
How many homes has Momentum Realty sold in Callahan?
Momentum Realty's agents closed 9 homes in Callahan for buyers and sellers in the last 12 months (5 as the listing brokerage, 4 representing the buyer), median sale $379,000 (brokerage closed records through November 2026). The count is our brokerage's own closed transactions and is refreshed nightly; it is not a market total.
Momentum agents use this intelligence every day to price listings and write winning offers across Callahan. Talk through what the numbers mean for your move.
Every number on this page is computed directly from licensed Florida MLS feeds, recorded public sales, Zillow Research, and U.S. Census data — nothing is manually adjusted or estimated by hand. Medians use recorded closed sales; supply figures use the MLS listing counts from the last data refresh (date below); the Momentum Score methodology is summarized .
Analyst oversight: Jon Brooks — Co-Founder, Momentum Realty · CEO, Momentum Research · Housing Market Analyst · methodology reviewed quarterly · Last data refresh: November 16, 2026 at 12:18 PM ET
Statistics on this page are computed automatically from licensed MLS feeds and public data sources (Zillow Research, U.S. Census Bureau) and summarized without manual review. Figures are estimates based on recent recorded activity, are deemed reliable but not guaranteed, and should be verified with a licensed agent before making decisions. This page does not constitute an appraisal or an automated valuation of any specific property. Momentum Realty is licensed in Florida and Georgia. Equal Housing Opportunity.
<a href="https://movewithmomentum.com/market/callahan">Callahan Housing Market: Median $329K, -12.3% YoY — Momentum Realty</a>Get the Northeast Florida Market Pulse every month
One email when the new edition is out: median price and the same-home change, days on market, months of supply, price cuts and what failed to sell, computed from MLS closed records. See the current edition. Unsubscribe any time.