
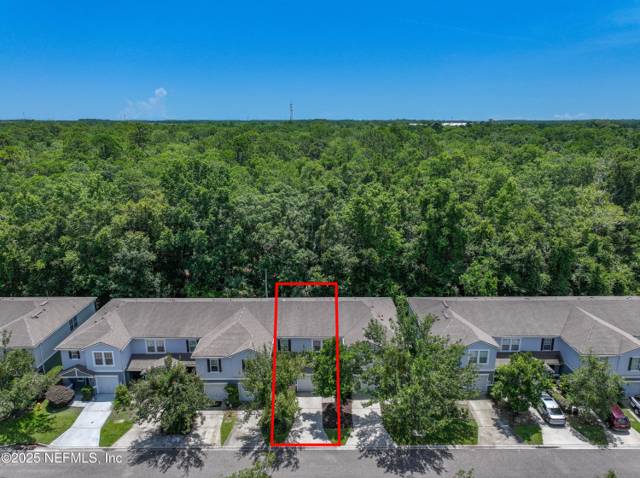
Crossings at Cypress Trace
Homes for Sale in St. Johns, FL
All 416 homes for sale in St. Johns, FL · median $575,000 · 332 homes for sale in 32259 · St. Johns County homes for sale
True comps, carrying-cost math, and listings before the portals.
Photo courtesy of BERKSHIRE HATHAWAY HOMESERVICES FLORIDA NETWORK REALTY · via realMLS
As of November 2026, Crossings At Cypress Trace Condo in St. Johns, FL has 4 homes for sale and 2 pending, asking from $285,000 to $299,999 (median $289,450). Over the 12 months ending 2026-11-01, 13 recorded sales closed at a median of $235,000, $153 per square foot, a median 32 days on market, sellers accepting 94% of original asking (-16% versus the prior year). Homes listed or recently sold were built 2006–2012; 18 of 18 report an HOA (median $287/mo); none of the 18 geocoded homes sit in a FEMA special flood hazard zone (median elevation 19 ft). At the median price and St. Johns County's FY2025-26 rate of 13.47 mills, annual property tax runs about $3,170 ($2,650 with the full homestead exemption).
Homes For Sale Right Now in Crossings at Cypress Trace
Live MLS inventory for Crossings at Cypress Trace. Every active listing, what is under contract right now, and the last 12 months of closed sales, refreshed twice a day. Closed comps beat an algorithm's guess every time.
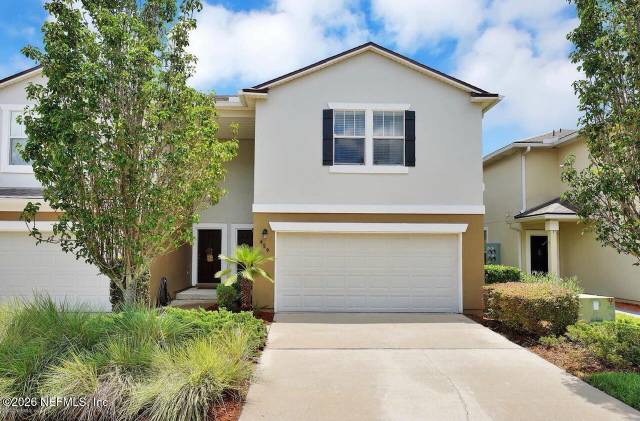 Active · 81 daysTop listing
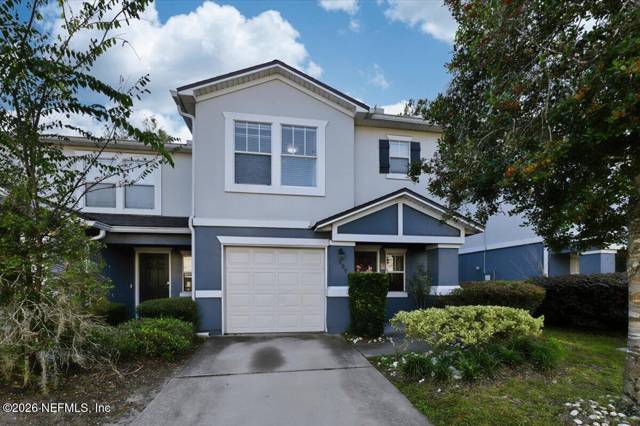 Active · 7 days
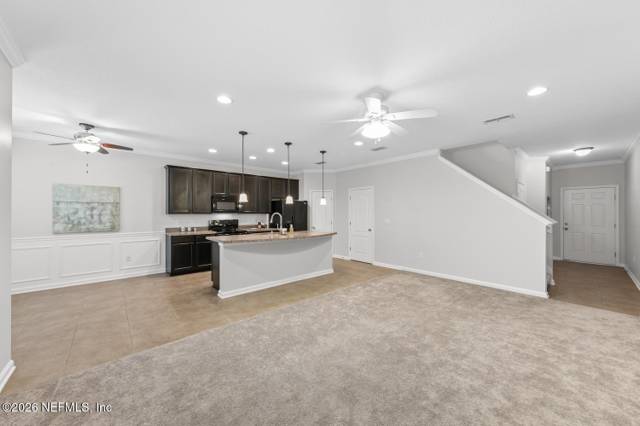 Active · 143 days
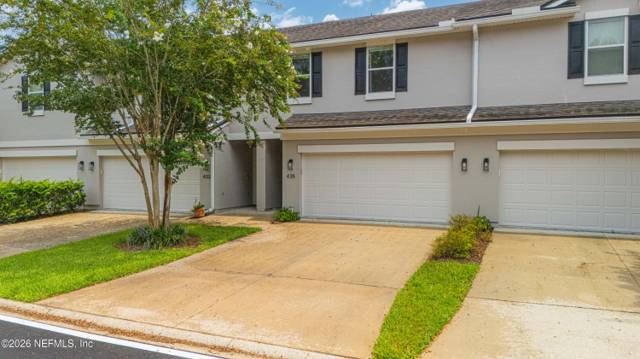 Active · 79 days
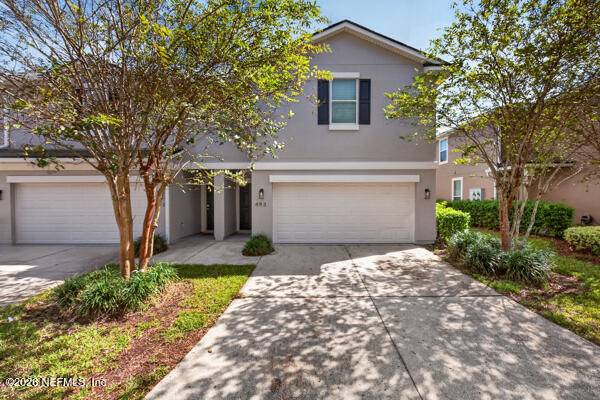 Under Contract · 9 days
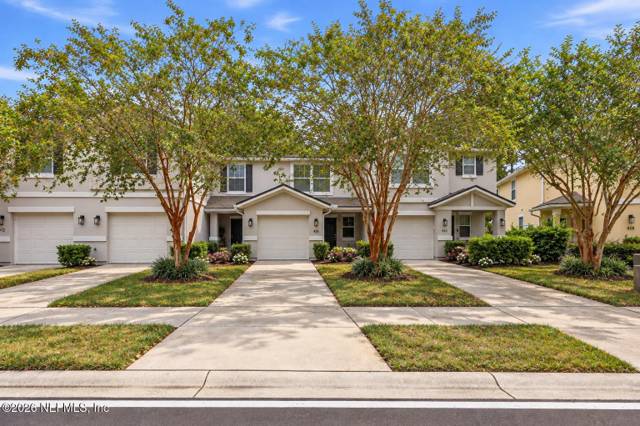 Under Contract · 153 days
Active and pending Crossings at Cypress Trace listings as of 2026-11-01, priced high to low. Source: Data provided by realMLS. Tap any home to ask about it.

Crossings At Cypress Trace is a condo market, so price per square foot does most of the talking: the median here works out to $156.81 per square foot on a median sale price of $242,000. With only 15 closings in the tracked window and six active listings, small shifts in which units trade can move the numbers more than they would in a larger single-family market, so I read the -15.7% year-over-year change as a reflection of that thin, condition-driven mix rather than a broad repricing of the community.
Zoom out and the longer arc still favors owners: prices are up 103% since 2012. Day to day, though, this reads as a balanced market — 4.8 months of supply and a median of 71 days on market mean sellers need to price to condition and buyers have room to negotiate rather than chase multiple offers.
Figures in this note are as of July 14, 2026. The live market numbers elsewhere on this page update nightly and are newer.
Crossings at Cypress Trace right now
🟡 Balanced market. 3.7 months of supply and 33% of the inventory already under contract put buyers and sellers on roughly even footing.Why it matters: months of supply is how long today's inventory would last at today's sales pace; under-contract share is the portion of homes for sale that already have a buyer.Momentum Research analysis of realMLS records, as of November 1, 2026. Confidence: High (6 active and pending listings, 13 closed sales in 12 months).
🔴 Off the recent peak. The trailing-12-month median ($235K) is down 15.8% from the prior 12 months ($279K) and up 102% since 2012. With about a dozen sales a year, a single closing can swing this number, so read the level and the decade, not one year's move.Momentum Research, record-level realMLS closed sales, 12-month windows ending November 1. Confidence: Low (13 and 5 sales in the two windows).
What's unique here: the median sale price is about 54% below the typical St. Johns County sale ($235K vs $515K, trailing 12 months, realMLS records).
Jump to: Price history & scorecard · Homes for sale · Schools · FAQ
· Updated November 2, 2026 · Live data: realMLS, refreshed twice daily · MLS facts carry their source; interpretation lines are Momentum Research · Data sources & freshness
The 60-Second Overview
Crossings at Cypress Trace market snapshot (as of November 1, 2026): the median sale price is about $235K ($153 per sq ft over the trailing 12 months of closed sales), a median 32 days on market for closed sales, and 3.7 months of supply, a balanced market. The trailing-12-month median is down 16% from the prior 12 months and up 102% since 2012, computed from record-level realMLS closed sales (13 closings in the current window).
In ZIP 32259 (St. Johns), 1,163 homes closed in the last 12 months at a median of $498K ($224/sq ft), down 3.6% year over year, with a median 38 days on market. Right now 445 active and 299 pending listings put supply at about 4.3 months — a balanced market. See the live ZIP 32259 housing market and the St. Johns County market.
County records show 8 qualified sales in Crossings At Cypress Trace Condo across 2024–2025 (7 in 2024, 1 in 2025), median $279,000 — the last recorded sale per parcel on the Florida DOR 2025 assessment roll, independent of the MLS.
Flood zones in Crossings at Cypress Trace: of 16 listing addresses checked against the FEMA National Flood Hazard Layer, 100% sit outside the FEMA Special Flood Hazard Area (Zone X). Individual parcels vary - verify any specific address at msc.fema.gov. See flood zones by neighborhood in St. Johns.
Crossings at Cypress Trace is a community of 206 homes in St. Johns, St. Johns County, built between 2006 and 2012 (median 2006.0), with a median living area of about 1,607 square feet. 40% of parcels are homesteaded, the owner-occupancy proxy in the Florida DOR assessment roll (2025 roll, public records).
A condo community in St. Johns, St. Johns County, tracked on the realmls feed as of 2026-07-11, where activity runs on a small number of listings and closings rather than high volume.
The setting & the homes.
Aerial and on-site photos of Crossings at Cypress Trace. Swipe to explore the community.
Swipe or use the arrows → tap any photo to enlarge
Crossings at Cypress Trace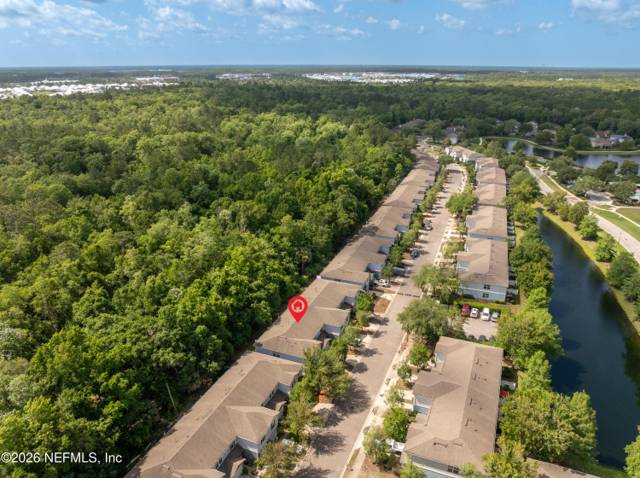 Crossings at Cypress Trace
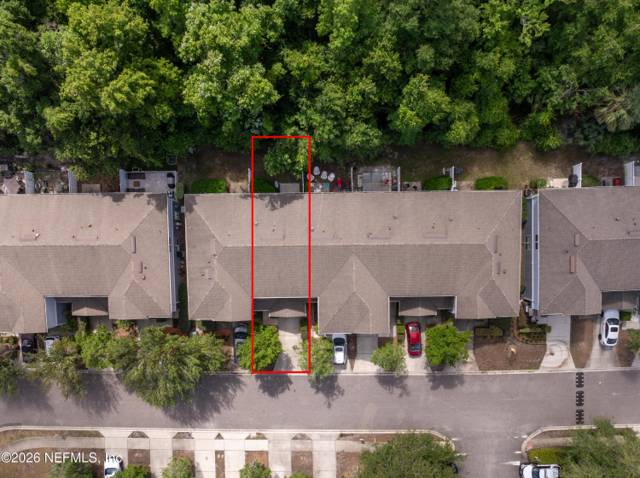 Crossings at Cypress Trace
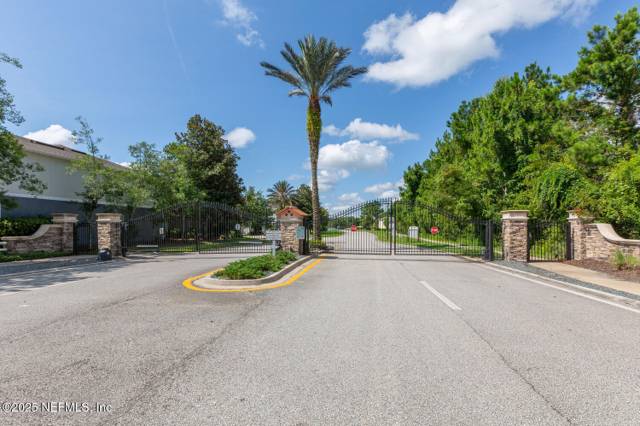 Crossings at Cypress Trace
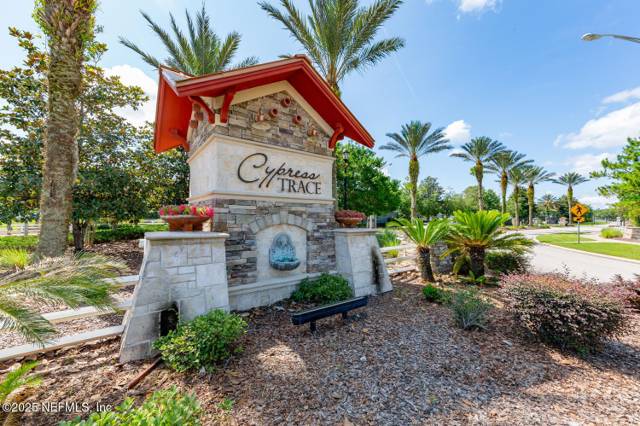 Crossings at Cypress Trace
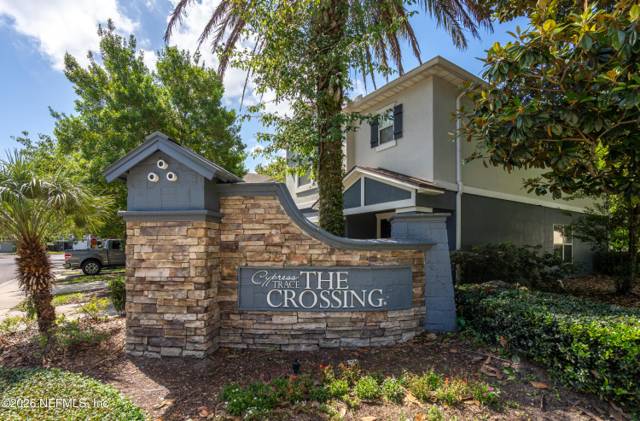 Crossings at Cypress Trace
Photos from realMLS listings in Crossings at Cypress Trace; content deemed reliable but not guaranteed.
Who Crossings at Cypress Trace is best for.
Best for
- A buyer targeting a purchase price around the community's $242,000 median who is comfortable evaluating a short list of comparable units.
- A seller who can price to condition and accept a market where a median of 71 days on market is normal rather than a red flag.
- An investor or owner-occupant weighing the long horizon, where prices are up 103% since 2012, over short-term year-over-year swings.
Probably not for
- A buyer who wants dozens of active listings to compare before making an offer — there are currently six.
- A seller expecting a fast, multiple-offer sale in a matter of days rather than the community's median of 71 days on market.
- Anyone relying on the most recent year-over-year number alone — the -15.7% change is drawn from only 15 closings and can be condition-driven.
Price History: What Homes Here Have Actually Sold For
Median sale price over the trailing 12 months ending November 1 of each year, from record-level realMLS closed sales. Same methodology as every appreciation figure on this page: the 2026 point ($235K) IS the median in the snapshot above, and the move from 2025 ($279K) IS the -15.8% one-year change.
Windows contain 4 to 37 sales each (13 in the current window); every figure carries its sample size, and thin markets swing on single closings. Source: Data provided by realMLS. Deemed reliable but not guaranteed.
Crossings at Cypress Trace Market Scorecard
Crossings at Cypress Trace is currently a seller's market. About 3.7 months of supply, a median asking price of $289,450, and homes go under contract in about 81 days.
Typical home value in the 32259 ZIP is $546,728, about 23.4% below the Florida norm (Zillow Home Value Index).
Go deeper: ZIP market scorecard · county scorecard · true cost calculator · affordability calculator.
Live data: realMLS, refreshed twice daily. Typical value: Zillow Research. Market metrics only; these describe homes for sale and recent sales, not residents.
Crossings at Cypress Trace on the map.
Every active, pending, and recently sold home, plotted. Toggle the layers and tap a home for the details.
Listing locations from realMLS. Map data © OpenStreetMap contributors.
Life at Crossings at Cypress Trace
- Tennis Court(s) · reported on 15 of 16 listings
- Playground · reported on 13 of 16 listings
- Pool · reported on 13 of 16 listings
- Gated · reported on 12 of 16 listings
- Basketball Court · reported on 11 of 16 listings
- Security Gate · reported on 9 of 16 listings
- Maintenance Grounds · reported on 7 of 16 listings
- Jogging Path · reported on 5 of 16 listings
- Clubhouse · reported on 5 of 16 listings
- Children's Pool · reported on 5 of 16 listings
- Pickleball · reported on 3 of 16 listings
- Trash · reported on 2 of 16 listings
Community amenities as reported across realMLS listings in this community; deemed reliable but not guaranteed. Verify current amenities and access with the HOA.
How far is everything?
Everyday stops around Crossings at Cypress Trace are close: the nearest groceries is about 8 minutes away.
- Aldi · Groceries8 min
- Pepper's Cocina Mexicana · Dining9 min
- Durbin Creek Crossing · Shopping9 min
- Ellianos Coffee · Coffee9 min
- Champion Swim School · Parks19 min
- Chrisry Pediatra · Health19 min
Approximate drive times via Mapbox Search + Directions, 2026-07-03. Verify for a specific address.
Nearby Communities
Explore more neighborhoods near Crossings at Cypress Trace with Momentum Realty’s local guides.
Schools
- St. Johns County Public Schools
- Verify the zoned schools by address
- Magnet and choice options may be available
- St. Johns County School District · Verify exact-address zoning
Zoned schools reflect the assignments reported on recent Crossings at Cypress Trace listings and can change; always confirm with St. Johns County Public Schools for a specific address.
Buying with schools in mind? We can confirm the exact zoned schools for any Crossings at Cypress Trace address.
Shop the zone: Homes zoned for Fruit Cove Middle School · Homes zoned for Beachside High School
The Crossings at Cypress Trace buying strategy.
If we were buying in Crossings at Cypress Trace today, this is the order of operations we would run for our clients.
Underwrite the condition first. Price the roof, HVAC, and systems honestly before judging any list price; condition swings value here more than square footage alone.
Match the home to real comps. Recent sales of similar condition and lot, not the asking price, tell you what a home is worth.
Move deliberately, not desperately. Neither side has a decisive edge, so a well-prepared, fairly-priced offer wins without overpaying.
Line up financing and inspection early. A pre-approval and an inspection plan let you act fast and negotiate from evidence.
Keep an agent in your corner. The listing agent works for the seller; we represent you and prepare a hand-built valuation before any offer in Crossings at Cypress Trace.
Reading a thin condo market
With just six active listings and 15 closings in the current window, Crossings At Cypress Trace does not generate the volume of a large single-family subdivision, and that matters for how you interpret its numbers. The median price of $242,000 and median price per square foot of $156.81 are real, but they are built from a small sample, so a run of higher- or lower-condition units closing in a given stretch can swing the year-over-year read — here, down 15.7% — without that meaning the same thing it would in a deeper market.
The 4.8 months of supply puts this squarely in balanced territory: not a seller's market where pricing power is one-sided, and not a buyer's flood either. A median of 71 days on market backs that up — units are moving, just not instantly, which leaves room on both sides of a negotiation to work with condition, terms, and timing.
The location and the amenities are priced into every listing in Crossings at Cypress Trace. The deal is won or lost on condition, the comps, and the renovation math.
Momentum Buy Score.
Our proprietary 0 to 10 read across the factors that decide how a home in Crossings at Cypress Trace buys, holds, and resells. Momentum Research; not an appraisal.
Momentum Intelligence Scores are our proprietary, qualitative assessment on a 0 to 10 scale, built from the record-level market data on this page. They are a framework for comparing communities, not a guarantee of future value and not advice on a specific home; unlike an automated value estimate they do not price your home, they grade the community on evidence you can inspect. Composite is the plain average of the 5 factors (5.1). Basis: Long-Term Appreciation +102% since 2012; Recent Direction -15.8% year-over-year; Liquidity & Demand 3.7 months of supply; Owner Commitment 40% owner-occupied; Pricing Power 93.8% sale-to-list. Refreshed with each data update.
Why work with Momentum here
In a market this thin, the difference between a good outcome and a mediocre one usually comes down to reading the small number of comparable closings correctly and pricing to condition rather than to a headline median. We pull the realmls feed directly, track the closings and active-listing count as they move, and price each unit against what has actually closed in this community rather than a citywide average.
Crossings at Cypress Trace in 15 seconds.
What it really costs to own in Crossings at Cypress Trace
The parts of the monthly number a mortgage calculator leaves out, from the tax roll, the MLS, Citizens and FEMA. Property facts only.
| Property tax | At today's median asking price of $289,450, the first-year bill with homestead is about $3,400/yr (St. Johns County total millage 13.4686 mills, FY2025-26, St. Johns County Property Appraiser, FY2025-26 adopted budget). |
|---|---|
| HOA dues | Median $300/month across 13 MLS listings (most billed monthly; 2026-11-02). Dues cover what the documents say they cover; ask for the budget and reserve study. |
| Home and flood insurance | The average Citizens Property Insurance premium in Saint Johns County is $1,378/yr (977 policies, Citizens detail by county, April 2026); private-market quotes depend on roof age, wind mitigation and construction. Flood: of 16 listing addresses checked against the FEMA flood map, 100% sit outside the high-risk zone. Statewide, a Zone X flood policy runs about $500-$700/yr and a high-risk zone $1,200-$2,500/yr (FEMA Risk Rating 2.0 averages, not quotes). |
Estimated carrying cost at the median asking price, before the mortgage: about $698/month (tax $283, HOA $300, insurance $115). An estimate from the sources above, not a quote.
Email me new listings in Crossings at Cypress Trace
One e-mail a day, only when a home lists here, with price, beds, baths and a link to every listing. Straight from the MLS feed; no account needed.
Ask an agent about Crossings at Cypress Trace
Have a question about the homes, fees, rules or commute here? A Momentum agent who works Crossings at Cypress Trace will answer, and the answer is published on this page for the next buyer.
HOA, CDD & Fees
- No CDD
- HOA reported ~$300/month
Confirm the current HOA dues, exactly what they cover, and any CDD bond or special assessment for a specific address before you offer.
Page states no CDD.
Flood & Insurance Context
Of 16 sampled listing addresses in this community: 100% outside the FEMA Special Flood Hazard Area (Zone X/B/C).
Address-sampled; individual parcels vary - verify any specific address at msc.fema.gov. Check any address at FEMA's Flood Map Service Center, and see average home-insurance costs by Florida county.
Source: FEMA National Flood Hazard Layer, address-level lookups (n=16) · as of 2026-11
Tools for a Crossings at Cypress Trace buy.
Free calculators to pressure-test the real cost before you tour.
Selling here is won on condition and pricing to real comps, not an automated estimate. The right number comes from closed Crossings at Cypress Trace sales matched to your home.
Price it to the comps and condition, not an automated estimate.
If you are thinking about selling in Crossings at Cypress Trace, the right list price comes from recent comparable sales matched to your home's condition and location, not an automated estimate.
What is your Crossings at Cypress Trace home worth?
Get a no-obligation home value based on real comparable sales in Crossings at Cypress Trace, not an automated guess. Tell us about your home and we will personally prepare your numbers and a pricing strategy. No obligation, no spam.
See all homes for sale in St. Johns →
Recently off market in Crossings At Cypress Trace Condo
Homes in Crossings At Cypress Trace Condo that recently left the market. Each address opens its public-record profile: county-recorded value, property taxes, the last recorded sale, community sales history, and what is for sale nearby now. 18 on record.
- 1018 N Black Cherry Drive · off market
- 1039 N Black Cherry Drive · off market
- 1049 N Black Cherry Drive · off market
- 411 Walnut Drive · off market
- 479 Walnut Drive · off market
- 481 Walnut Drive · off market
- 488 Walnut Drive · off market
- 500 Walnut Drive · off market
Just listed in Crossings at Cypress Trace
The newest homes for sale in Crossings at Cypress Trace right now, newest first. Each link opens the full listing with every photo, the price history and a tour request.
- 880 Black Cherry Drive $289,900 · 3 bd · 2.5 ba · 1,607 sq ft · 8 days on market Courtesy of CROSSVIEW REALTY
- 435 Walnut Drive $285,000 · 2 bd · 2.5 ba · 1,709 sq ft · 80 days on market Courtesy of KELLER WILLIAMS ST JOHNS
- 459 Walnut Drive $299,999 · 3 bd · 2.5 ba · 1,684 sq ft · 82 days on market Courtesy of FLORIDA HOMES REALTY & MTG LLC
- 486 Walnut Drive $289,000 · 2 bd · 2.5 ba · 1,654 sq ft · 144 days on market Courtesy of KELLER WILLIAMS REALTY ATLANTIC PARTNERS
Checked against the MLS Nov 2, 2026. All new listings in this market.
Every Home for Sale in Crossings At Cypress Trace St Johns Right Now (6)
All 6 active and pending Crossings At Cypress Trace St Johns listings with a detail page, newest first, refreshed twice a day from the MLS.
- 880 Black Cherry Drive · $289,900 · 3 bd / 2.5 ba · listed Oct 25, 2026 · listed by Crossview Realty
- 493 Walnut Drive · $249,000 · 3 bd / 2.5 ba · pending · listed by Momentum Realty
- 435 Walnut Drive · $285,000 · 2 bd / 2.5 ba · listed Aug 14, 2026 · listed by Keller Williams St Johns
- 459 Walnut Drive · $299,999 · 3 bd / 2.5 ba · listed Aug 12, 2026 · listed by Florida Homes Realty & Mtg Llc
- 486 Walnut Drive · $289,000 · 2 bd / 2.5 ba · listed Aug 3, 2026 · listed by Keller Williams Realty Atlantic Partners
- 418 Walnut Drive · $224,900 · 2 bd / 2.5 ba · pending · listed Aug 3, 2026 · listed by Berkshire Hathaway Homeservices Florida Network Realty
Recently sold in Crossings At Cypress Trace St Johns
- 808 Black Cherry Drive · sold $194,000
- 1018 N Black Cherry Drive · sold $188,700
- 481 Walnut Drive · sold $299,900
- 500 Walnut Drive · sold $297,500
- 1039 N Black Cherry Drive · sold $245,000
- 872 Black Cherry Drive · sold $196,000
- 479 Walnut Drive · sold $285,000
- 827 Black Cherry Drive · sold $221,500
- 843 Black Cherry Drive · sold $194,000
- 800 Black Cherry Drive · sold $238,000
Closed sales from the MLS; each page shows the sold price, taxes and value history.
Streets in this community
Street-level pages: every home on record, what sold and what is for sale on each street.
- S Black Cherry Drive (27 homes on record)
- Black Cherry Drive S (26 homes on record)
- Walnut Drive (8 homes on record)
Frequently Asked Questions
What is the median home price in Crossings at Cypress Trace?
How long do homes in Crossings at Cypress Trace take to sell?
Is Crossings at Cypress Trace a buyer's or seller's market right now?
How many homes are in Crossings at Cypress Trace?
What share of Crossings at Cypress Trace is owner-occupied?
When were the homes in Crossings at Cypress Trace built?
Have Crossings at Cypress Trace home prices gone up?
What schools serve Crossings at Cypress Trace?
Who is the best real estate agent for Crossings at Cypress Trace?
How do I find a top St. Johns real estate agent who knows Crossings at Cypress Trace?
Can Momentum Realty connect me with an agent for Crossings at Cypress Trace?
Where is Crossings at Cypress Trace, and what county is it in?
How far is Crossings at Cypress Trace from downtown Jacksonville and the beach?
Is Crossings at Cypress Trace in a flood zone?
Is Crossings at Cypress Trace a good place to live?
Should you buy in Crossings at Cypress Trace?
An honest fit check. We will tell you when it is not your community.
Data sources & freshness
| Live listings | realMLS, refreshed twice daily (last: November 1, 2026) |
| Community market stats | realMLS closed sales, 12-month windows ending November 1, 2026 |
| Housing stock & ownership | Florida DOR assessment roll (street-list match (3 streets, ZIP 32259)) |
| Under-contract shares | realMLS records, as of 2026-11-01 |
| Schools | 2025-26 district assignments + FLDOE school grades; verify with the district |
| Historical depth | Closed-sale records back to 2006 (207 transactions analyzed) |
Verify the primary sources yourself: Florida DOR · U.S. Census · FEMA flood maps · Citizens Property Insurance.
Momentum Research figures are our own analysis of realMLS records; MLS data is deemed reliable but not guaranteed. Methodology: how Momentum market scores are computed. Market metrics describe homes for sale and recent sales, not residents.
Own a home here?
You just read the data. Now see what your home is worth.
The numbers on this page move markets in the aggregate. The number that matters to you is what a buyer pays for your address. Momentum sells for 1.25% above the realMLS member average and 8 days faster, and we’ll price yours against live local comps.
Looking to buy here? Search homes for sale →
What’s your home worth in your area?
A real valuation with real comps from a local listing agent, not an instant algorithm. Response within one business day.
See how Crossings At Cypress Trace Condo fits the bigger picture — live prices, inventory, and Momentum Scores:
More on Crossings at Cypress Trace
- Home values · What homes in Crossings at Cypress Trace actually sell for