<<<<<<< HEAD ======= >>>>>>> origin/main
Ormond By The Sea in Ormond Beach

Ormond By The Sea
Homes for Sale in Ormond Beach, FL

Community in Ormond Beach · Volusia County · ZIP 32176
580 homesBuilt 1951–2021Median sale $290K
Free · No obligation
Talk to a Ormond By The Sea Expert

True comps, carrying-cost math, and listings before the portals.

Live · Ormond By The Sea Housing Pulse DBAMLS + public records Analysis by Momentum Realty · $3.5B+ sold · 8,500+ transactions · Top 1% in Florida (RealTrends)
Price
$290K
Median sold · 12 mo
down 3.3% vs the prior 12 months
-3.3%
1-yr price change
n = 11 and 6 sales in the two windows
$282/sf
Sold $/sqft · 12 mo
peak $282 in 2026
94.8%
Sale vs ask
Volusia median: 94.8%
Tempo
1.1mo
Supply
3 to 6 months is the balanced band
86days
Median DOM · closed
49 days at the 2025 low
67%
Under contract
Volusia: 20% (1,084 of 5,314)
1 · 2
For sale · pending
live counts, refreshed twice daily
11
Sold · last 12 mo
10-yr average: about 2 a year
Ownership and context
52%
Owner-occupied · Ormond By The Sea
302 of 580 parcels homesteaded (FL DOR 2025)
48%
Non-owner-occupied · Ormond By The Sea
incl. 6% trust or LLC-held · 17% out-of-state
50%
Cash buyers · Ormond By The Sea
6 of 12 sales, 12 mo ending June 2026
580
Homes in the community
580 residential parcels (FL DOR 2025)
Track record · 9 years of records
Est. 1951
Community established
homes built 1951-2021, median 1954 (FL DOR 2025)
8
Failed listings · 2026
peaked at 10 in 2025
1,015sqft
Median sold home size
12-mo windows, closed sales
1.9%/yr
Turnover rate
about 11 of 580 homes trade a year
Built fromLive DBAMLS data9 years of closingsFL DOR public recordsUpdated twice daily
Jon Brooks, founder of Momentum Realty
Jon's Current Read

Ormond By The Sea's median price of $290,000 works out to $281.91 per square foot on a typical home near 860 square feet of living area — a small-footprint product on a beachside strip of Volusia County. The building stock spans 1951 to 2021, with a median year built of 1954, so pricing here tracks renovation condition and lot far more than it tracks size.

With just 1 active listing and 1.1 months of supply, inventory is thin enough to keep the market seller-leaning even as the median price is down 3.3% year over year. Median days on market runs 86, so sellers hold real pricing leverage, but it is not an instant market — the 11 closings in the current window suggest deals still take time to land at the right number.

Ormond By The Sea Housing Pulse · Momentum Research · as of July 14, 2026

Ormond By The Sea right now

🔴 Seller-leaning market. 1.1 months of supply and 67% of the inventory already under contract give sellers the pressure advantage.Why it matters: months of supply is how long today's inventory would last at today's sales pace; under-contract share is the portion of homes for sale that already have a buyer.Momentum Research analysis of DBAMLS records, as of July 14, 2026. Confidence: Medium (3 active and pending listings, 11 closed sales in 12 months).

🟡 Off the recent peak. The trailing-12-month median ($290K) is down 3.3% from the prior 12 months ($300K). With about 2 sales a year, a single closing can swing this number, so read the level and the decade, not one year's move.Momentum Research, record-level DBAMLS closed sales, 12-month windows ending July 14. Confidence: Medium (11 and 6 sales in the two windows).

Jump to: Price history & scorecard · Homes for sale · Schools · FAQ

Updated July 14, 2026 · Live data: DBAMLS, refreshed twice daily · MLS facts carry their source; interpretation lines are Momentum Research · Data sources & freshness

Ormond By The Sea Housing Pulse · Momentum Research · as of July 14, 2026

Ormond By The Sea right now

🔴 Seller-leaning market. 1.1 months of supply and 67% of the inventory already under contract give sellers the pressure advantage.Why it matters: months of supply is how long today's inventory would last at today's sales pace; under-contract share is the portion of homes for sale that already have a buyer.Momentum Research analysis of DBAMLS records, as of July 14, 2026. Confidence: Medium (3 active and pending listings, 11 closed sales in 12 months).

🟡 Off the recent peak. The trailing-12-month median ($290K) is down 3.3% from the prior 12 months ($300K). With about 2 sales a year, a single closing can swing this number, so read the level and the decade, not one year's move.Momentum Research, record-level DBAMLS closed sales, 12-month windows ending July 14. Confidence: Medium (11 and 6 sales in the two windows).

Jump to: Price history & scorecard · Homes for sale · Schools · FAQ

Updated July 14, 2026 · Live data: DBAMLS, refreshed twice daily · MLS facts carry their source; interpretation lines are Momentum Research · Data sources & freshness

The 60-Second Overview

Ormond By The Sea market snapshot (as of July 14, 2026): the median sale price is about $290K ($282 per sq ft over the trailing 12 months of closed sales), a median 86 days on market for closed sales, and 1.1 months of supply, a seller-leaning market. The trailing-12-month median is down 3% from the prior 12 months, computed from record-level DBAMLS closed sales (11 closings in the current window).

Ormond By The Sea is a community of 580 homes in Ormond Beach, Volusia County, built between 1951 and 2021 (median 1954), with a median living area of about 860 square feet. 52% of parcels are homesteaded, the owner-occupancy proxy in the Florida DOR assessment roll (2025 roll, public records).

Ormond By The Sea comprises 580 homes in Ormond Beach (Volusia County), built between 1951 and 2021, with just over half carrying a homestead exemption and the balance held as non-homestead property.

Best for

  • Buyers comfortable with a smaller living footprint (median 860 square feet) who prioritize location over size.
  • Buyers targeting a purchase near the $290,000 median who can move decisively in a tight-inventory market.
  • Buyers open to a wide range of renovation conditions, spanning homes built from 1951 to 2021.

Probably not for

  • Buyers who need built-in community amenities, since none are identified from current MLS listings.
  • Buyers who want a large living area, given the median home here runs near 860 square feet.
  • Buyers unwilling to compete for one of very few listings in a 1.1-months-of-supply market.
<<<<<<< HEAD

Median sale price over the trailing 12 months ending July 14 of each year, from record-level DBAMLS closed sales. Same methodology as every appreciation figure on this page: the 2026 point ($290K) IS the median in the snapshot above, and the move from 2025 ($300K) IS the -3.3% one-year change.

Windows contain 0 to 11 sales each (11 in the current window); every figure carries its sample size, and thin markets swing on single closings. © 2026 Daytona Beach Area Association of REALTORS®, Inc. Deemed reliable but not guaranteed.

Homes sold per 12-mo window
051020182020202220242026
0 to 11 a year; 11 in the current window.

The real cost & risk here

Before the list price, the Florida math the portals skip. These are Volusia County typicals — your exact home, flood zone, and insurance quote will vary, so verify each before you offer.

$1,796/mo
Volusia County typical true cost to own
$151/mo
Volusia County typical home insurance
Check CDD
Confirm before you offer

County typicals from Momentum’s Florida housing data (Zillow & Realtor.com aggregates, Census, FRED), updated monthly; insurance modeled. Flood zone is property-specific — always confirm via FEMA.

=======
8.6A- score
Momentum intelligence
Momentum buy score

Our proprietary read on how a home in Ormond By The Sea buys, holds, and resells. See the five factors.

Homes For Sale Right Now in Ormond By The Sea

Live MLS inventory for Ormond By The Sea. Every active listing, what is under contract right now, and the last 12 months of closed sales, refreshed twice a day. Closed comps beat an algorithm's guess every time.
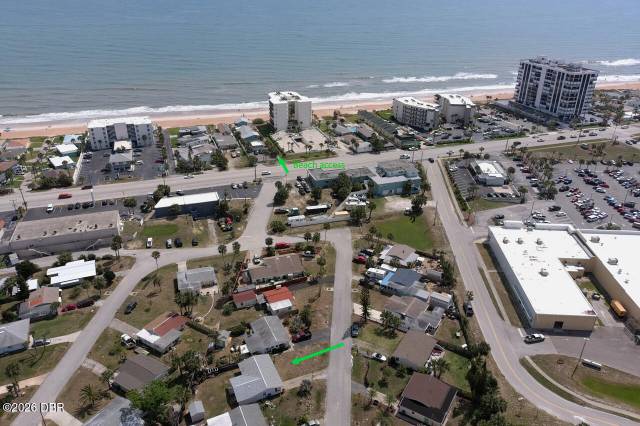
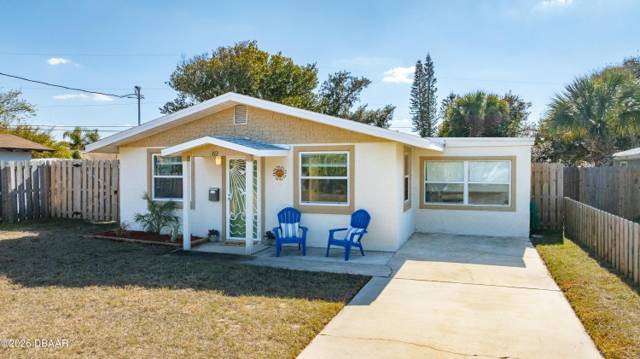
Active and pending Ormond By The Sea listings as of 2026-06-25, priced high to low. © 2026 Daytona Beach Area Association of REALTORS®, Inc.. Tap any home to ask about it.

Listing locations from DBAAR; lot type inferred from listing descriptions. Destination pins are approximate. Map data © OpenStreetMap, tiles © CARTO. Flood, school, and commute overlays are on the roadmap.

The takeaway

The location is the everyday-convenience case: shopping, schools, and the major roads are all a manageable drive.

Atlantic Ocean beachFew blocks · most homes are 2 to 3 blocks
Downtown Ormond Beach (Granada Blvd)~10 to 15 min · south on A1A then over the bridge
North Peninsula State Park~5 to 10 min · north end of the community
Interstate 95~12 to 15 min · via Granada Blvd / SR-40
Flagler Beach~15 to 20 min · north on A1A
Daytona Beach International Airport (DAB)~25 min · about 18 miles south
Orlando~75 to 90 min · about 80 miles southwest

Distances and drive times are approximate and vary with traffic. Confirm your real commute at your real departure time.

Nearby Communities

Explore more neighborhoods near Ormond By The Sea Homes for Sale in Ormond Beach, FL with Momentum Realty’s local guides.

Roberta Heights Homes for Sale in Ormond Beach, FLRoberta Heights Homes for Sale in Ormond Beach, FLOrmond Beach, FL · 0.1 miRaymonde Shores Homes for Sale in Ormond Beach, FLRaymonde Shores Homes for Sale in Ormond Beach, FLOrmond Beach, FL · 0.2 miPelican Dunes Homes for Sale in Ormond Beach, FLPelican Dunes Homes for Sale in Ormond Beach, FLOrmond Beach, FL · 0.3 miBeau Rivage Shores Homes for Sale in Ormond Beach, FLBeau Rivage Shores Homes for Sale in Ormond Beach, FLOrmond Beach, FL · 0.4 miKingston Shores Homes for Sale in Ormond Beach, FLKingston Shores Homes for Sale in Ormond Beach, FLOrmond Beach, FL · 0.4 miLHLynnhurst Homes for Sale in Ormond Beach, FLOrmond Beach, FL · 0.6 miVerona Oceanside Homes for Sale in Ormond Beach, FLVerona Oceanside Homes for Sale in Ormond Beach, FLOrmond Beach, FL · 0.6 miHolland Homes for Sale in Ormond Beach, FLHolland Homes for Sale in Ormond Beach, FLOrmond Beach, FL · 0.8 miSeaside Homes in Ormond Beach, FLSeaside Homes in Ormond Beach, FLOrmond Beach, FL · 0.8 mi

Browse all Florida neighborhood guides →

Carrying cost · the no-CDD edge

No CDD bond means thousands less per year than newer master plans.

Typical CDD community~$2,500/yr
Ormond By The Sea (no CDD)$0/yr

Roughly $25,000 saved over 10 years in carrying cost, before resale.

Illustrative. NE Florida CDD assessments commonly run $1,500-$3,500+/yr and vary by community; verify per property.

Schools

15-Second Take
  • Volusia County Public Schools
  • Verify the zoned schools by address
  • Magnet and choice options may be available
  • Confirm current ratings before relying on them
  • Private and parochial options nearby

Ormond By The Sea is served by Volusia County Public Schools. Assignment is by address and can change, so confirm the exact zoned elementary, middle, and high schools for any specific home, plus any magnet or choice options. Treat published ratings as a starting point, not the full story.

Buying with schools in mind? We can confirm the exact zoned schools for any Ormond By The Sea address.

The takeaway

What is actually moving in and around Ormond By The Sea, sourced and dated. We do not publish rumor.

Recent Developments in Ormond By The Sea

Our read on what is being built around Ormond By The Sea, scored for direction, significance, and how close the effect lands. The full sourced timeline follows below.

Net OutlookBullishThe defining recent story is coastal resilience: a state buried-seawall and dune project along A1A here is rebuilding storm protection after the 2022 hurricanes, which is the central long-term variable for this barrier-island stretch.

FDOT buried seawall and dune project on A1A

BullishA buried secant seawall and dune-and-vegetation rebuild along A1A in Ormond By The Sea is restoring storm protection and beach walkovers after Ian and Nicole. impact
SignificanceRadius: A1A / Ocean Shore Blvd

FDOT buried seawall and dune project on A1A

Barrier-island storm and erosion exposure

BearishHurricanes Ian and Nicole in 2022 caused significant dune erosion and walkover damage along this stretch; flood and wind exposure is the core risk to price. impact
SignificanceRadius: Oceanfront blocks

Barrier-island storm and erosion exposure

Direction, significance, and effect-radius ratings are Momentum's proprietary, qualitative read of the sourced items below, not investment advice or a prediction for any specific home.

Development, infrastructure, retail, and school activity affecting Ormond By The Sea, tracked by our team and summarized from public reporting and official sources, with links to the original coverage. Last updated June 2026.

Showing the latest, scroll for all updates ↓

  1. 2025
    Resilience

    A1A buried seawall project progresses (FDOT)

    As of September 2025, FDOT reported steady progress on its buried secant seawall and dune restoration along A1A in Ormond By The Sea, with piles and cap done, dune reshaping largely complete, and tens of thousands of native plants going in, targeting completion in early 2026. Why it matters: A hardened, hidden seawall plus rebuilt dunes is a long-term protection upgrade for the oceanfront blocks, though it does not remove the underlying flood-zone math. Source

  2. 2022
    Storms

    Hurricanes Ian and Nicole erode the dunes

    In fall 2022, Hurricane Ian and then Hurricane Nicole, about six weeks apart, caused widespread dune erosion and damaged or destroyed many beach walkovers along the Ormond By The Sea coast. Why it matters: The back-to-back 2022 storms are why the seawall and dune work exists; they are also the clearest illustration of why flood and wind coverage is non-negotiable here. Source

Development alerts for Ormond By The SeaGet a short monthly email when something new is approved, funded, or opens near Ormond By The Sea.

A monthly email from Momentum Realty. Unsubscribe anytime. See our privacy and disclosures.

Summaries reflect public reporting and official sources linked above as of the dates shown. Project details, timelines, and approvals can change. Commentary on potential market effects is general observation, not investment advice or a prediction for any specific property. For the freshest items across the whole region, see This Week in Northeast Florida.

If we were buying in Ormond By The Sea, this is the order of operations we would run, and the one we run for our clients.

1

Pull the FEMA flood zone for the exact parcel. Oceanside blocks here often sit in the highest coastal zones and river-side and interior lots vary; read the zone and a bindable flood and wind quote before you write, because two homes a block apart can price very differently.

2

Confirm HOA status per property. Most single-family homes carry no HOA, but individual low-rise condos do; do not assume, verify for the specific home.

3

Check the elevation and storm history. After Ian and Nicole, ask for an elevation certificate and any flood-claim or repair history; it directly affects insurance cost and resale.

4

Decide oceanside, riverside, or interior. Direct oceanfront, Halifax River frontage, and interior blocks are three different products and price tiers; pick the exposure before you shop price.

5

Comp within the community, not greater Ormond. Mainland Ormond Beach and the barrier island trade differently; price off the closest same-exposure sale inside Ormond By The Sea.

Best Buy
A solid interior or near-beach single-family home with no HOA and a manageable flood zone, priced off same-exposure community comps.
Biggest Risk
Barrier-island flood and wind exposure and the insurance cost that comes with it, especially on oceanfront blocks after the 2022 storms.
Best Lot
Direct oceanfront and Halifax River frontage carry clear premiums; interior blocks are the value play.
Smart Timing
Recent barrier-island demand here has cooled with longer days on market reported, which tends to give prepared buyers negotiating room (Zillow and Rocket/Redfin market data, 2025 to 2026).
The takeaway

On mobile, tap any heading below to open it. This is the home by home, lot by lot, club and renovation detail, organized so you can jump straight to what matters to you.

Community Details at a Glance

Ormond By The Sea is an unincorporated, census-designated barrier-island community in Volusia County just north of the City of Ormond Beach, with a 2020 Census population of about 7,312 (U.S. Census Bureau, 2020). It is a narrow strip, mostly under half a mile wide, between the Atlantic Ocean and the Halifax River, defined by A1A (Ocean Shore Boulevard) on the ocean side and John Anderson Drive on the river side. Housing is predominantly low-rise single-family cottages and ranches, most with no HOA, plus low-rise condos, with North Peninsula State Park and several off-beach parks providing protected, low-density coastline.

The takeaway

Three honest price bands. Condition and lot, not the square footage alone, decide where a home lands.

Entry: interior single-family and low-rise condos
$265K to $288K

The value tier: older interior single-family cottages and ranches a few blocks off the water, plus resale low-rise condos. Reported area home values have run in the low-to-mid $300,000s, with condos lower (Zillow home value data, 2026). Most single-family homes carry no HOA; confirm per property.

Lowest entry
Mid: near-beach and updated single-family
$288K to $325K

Updated single-family homes a short walk from the sand. The single-family list median for the 32176 area has run higher, into the $500,000s in 2026 depending on condition and proximity to the ocean (Broker One 32176 market data, 2026). Condition and exact block separate these more than floor plan.

Most inventory
High: direct oceanfront and Halifax River frontage
$325K to $640K

Homes directly on the Atlantic or fronting the Halifax River, where the lot and the water drive the premium well above the community median. Price each on its exposure, elevation, and storm history rather than a community-wide average (third-party listing data, 2026).

Strongest resale

Approximate 2026 resale bands from third-party listing data and public records, not NEFAR statistics. Confirm pricing for a specific home.

$265K to $288K
Entry: interior single-family and low-rise condos
The value tier: older interior single-family cottages and ranches a few blocks off the water, plus resale low-rise condos. Reported area home values have run in the low-to-mid $300,000s, with condos lower (Zillow home value data, 2026). Most single-family homes carry no HOA; confirm per property.
$288K to $325K
Mid: near-beach and updated single-family
Updated single-family homes a short walk from the sand. The single-family list median for the 32176 area has run higher, into the $500,000s in 2026 depending on condition and proximity to the ocean (Broker One 32176 market data, 2026). Condition and exact block separate these more than floor plan.
$325K to $640K
High: direct oceanfront and Halifax River frontage
Homes directly on the Atlantic or fronting the Halifax River, where the lot and the water drive the premium well above the community median. Price each on its exposure, elevation, and storm history rather than a community-wide average (third-party listing data, 2026).

Approximate 2026 resale bands from third-party listing data and public records, not NEFAR statistics. Confirm pricing for a specific home.

15-Second Take
  • Renovation math decides the deal
  • Better lots and views resell strongest
  • Roof and HVAC age drive the insurance quote
  • Interior lots are where buyers overpay
Asking price per square foot
Renovated$374
Original$205
Median days on market
Renovated317
Original8

From current Ormond By The Sea listings (renovated 1, original 3); condition inferred from listing descriptions, asking not closed figures. The exact number depends on a specific home's updates, lot, and view, which is the read we do before you offer.

Jon Brooks, Momentum Realty
Operator Note

The trap here is a beautifully staged original-condition home. Staging is cheap; a roof, HVAC, and a full modernization are not. We price the real renovation before you fall for the listing photos, because in an all-resale market that number is the difference between a deal and the most expensive house on the street.

Jon Brooks, Momentum Realty
Operator Note

Most buyers overpay on interior lots in the back half of the community. A sharp renovation can distract you, but the weaker resale position follows the lot, not the finishes. We read the homesite before the kitchen.

No CDD on the tax billStrong
Central Intracoastal West locationStrong
Scarce golf and lake homesitesStrong
$30M club reinvestment to 2028Positive
All-resale 1990s conditionManage it

Momentum analysis based on the community's structure, location, lot scarcity, and housing stock. Not a guarantee of future value.

Jon Brooks, Momentum Realty
Operator Note

The strongest value pocket is usually a renovated home on a good lot priced just under the next tier up. Buyers chasing the single biggest house often pay top prices for what is really a renovation project.

5 Mistakes Buyers Make in Ormond By The Sea

15-Second Take
  • Calling the listing agent (who works for the seller)
  • Misjudging the renovation budget
  • Overpaying for an interior lot
  • Underbudgeting the carrying costs
  • Skipping the roof, HVAC, and systems check

The same five mistakes cost buyers the most in any market. Every one is avoidable with the right preparation before you tour.

Ormond By The Sea sells quiet, low-rise beach living and the freedom of no HOA. The deal is found in the flood-zone and insurance math and in buying the right exposure, not in chasing the lowest sticker on the island.

Jon Brooks · Founder, Momentum Realty
7.2B · Buy Score
Resale Strength7.0/10
Renovation Risk6.4/10
Location Efficiency8.0/10
Long-Term Defensibility7.4/10
Carrying Cost Advantage5.8/10

Momentum Intelligence Scores are our proprietary, qualitative assessment based on the analysis on this page, on a 0 to 10 scale. They are a framework for comparing communities, not a guarantee of future value or advice on a specific home.

Why our read on Ormond By The Sea is different.

Most pages on this community are an automated estimate wrapped in stock copy. This one is built from the live DBAAR feed, fourteen years of closed sales, and a renovation-by-renovation read of what actually moves value here, lot by lot. No automated estimate, no guesswork.

Live DBAAR feed14 years of closed salesRenovation-premium analysisLot-by-lot, no automated estimates
Jon Brooks, founder of Momentum Realty. A housing economist with a background in real estate investment banking and consulting at Ernst & Young, who has built and analyzed Northeast Florida real estate from the ground up.

Which Lots & Views Hold Value Best

Where the value actually sits. Each home is shaded by its price per square foot (a value read, not just a price) and ringed by lot type, so you can see at a glance which pockets carry a real, durable premium and where a renovation play makes sense.

Value ($/sqft)
$261 value$401 premium
Lake / waterPreserveInterior

Fill = price per square foot; ring = lot type, inferred from listing descriptions. Sold homes are shown by realized $/sqft (lot type not always recorded). Asking and recent-sold figures from DBAAR; for orientation, not an appraisal.

15-Second Take
  • Direct oceanfront and Halifax River frontage carry the clear premiums; interior blocks are the value play.
  • Elevation and flood zone matter as much as the lot; two homes a block apart can price very differently.
  • Comp by exposure within the community, not against mainland Ormond Beach.

In Ormond By The Sea, lot value is driven by exposure and elevation. Direct oceanfront homes and those fronting the Halifax River command premiums that interior blocks cannot match, but on a narrow barrier island the flood zone and the finished-floor elevation can move the price and the insurance cost as much as the view. The honest approach is to fix your target exposure first, oceanside, riverside, or interior, then compare a home against the closest same-exposure sale inside the community and price the insurance before the sticker.

Ormond By The Sea in 15 seconds.

Best forBuyers who want a quiet, low-rise barrier-island home within a few blocks of the sand, most with no HOA.
Strong onLifestyle: uncrowded beach, North Peninsula State Park, fishing and the Intracoastal, and the freedom of no association on most homes.
WatchBarrier-island flood and wind exposure and the insurance cost, especially on oceanfront blocks after the 2022 storms.
Not forBuyers who want a gated, amenity-rich community or a walkable downtown setting.
The edgeA cooler recent market with longer days on market gives a prepared buyer real negotiating room.

HOA, CDD & Fees

15-Second Take
  • Most single-family homes here have no HOA, which is a real draw and a real responsibility.
  • The carrying cost that matters is insurance, not dues; price the flood and wind quote first.
  • Low-rise condos within the area do have associations; confirm dues per building.

Most single-family homes in Ormond By The Sea carry no homeowners association, because the area is unincorporated and was largely platted before master-planned HOAs (Redfin and Homes.com no-HOA filters, 2026). Individual low-rise condo buildings within the community do carry their own association dues that vary by building; confirm HOA status and any dues for the specific property.

Where there is no HOA, there are no association dues or amenity bundle; you carry your own maintenance and insurance directly. Where a condo association applies, confirm what its dues cover in writing for that building.

There is no community clubhouse or gate. The shared assets are public: North Peninsula State Park at the north end, off-beach parks and beach approaches along A1A, and Volusia County beach access (Florida State Parks and Volusia County, 2026).

The takeaway

Selling here is won on condition and view, not an automated estimate. The right number comes from closed comps matched to your renovation level and lot.

Momentum listings (YTD)
97.98%
Sold-to-list ratio across the Jacksonville metro for our agents, sellers keeping more of their price.
Market average (YTD)
96.73%
The broader metro average sold-to-list ratio over the same period.
Momentum days on market
64 days
Median days on market for our listings, faster sales mean less carrying cost and stronger leverage.
Market days on market
72 days
The broader metro median over the same period.

Sold-to-list and days-on-market figures reflect Momentum Realty listings versus the Jacksonville metro average, year to date. Your home's result depends on pricing, condition, lot, view, and preparation.

In Ormond By The Sea, condition and view decide your number

Because buyers here are weighing your home against renovated comps and cross-shopping Ormond Shores, a home priced to the community average instead of its true condition and view either leaves money on the table or sits. A renovated kitchen, newer roof and HVAC, and a golf or lake view all deserve to show up in your price, and a buyer pool reading renovation math needs to be shown why your home is worth it. We build that case with real comps and a pricing strategy for the current market.

What is your Ormond By The Sea home worth?

Get a no-obligation home value based on real comparable sales in Ormond By The Sea matched to your condition, lot, and view, not an automated guess. Tell us about your home and we will personally prepare your numbers and a pricing strategy. No obligation, no spam.

See homes for sale in Ormond By The Sea on the map →

Real comps, not an automated estimate.

The real cost & risk here

Before the list price, the Florida math the portals skip. These are Volusia County typicals — your exact home, flood zone, and insurance quote will vary, so verify each before you offer.

$1,796/mo
Volusia County typical true cost to own
$151/mo
Volusia County typical home insurance
Check CDD
Confirm before you offer

County typicals from Momentum’s Florida housing data (Zillow & Realtor.com aggregates, Census, FRED), updated monthly; insurance modeled. Flood zone is property-specific — always confirm via FEMA.

>>>>>>> origin/main
How much local inventory is already under contract

13% of homes for sale in ZIP 32176 are already under contract (under contract ÷ under contract + active listings) — a read on how much of the available inventory buyers have already claimed. Source: MLS data (2026-07-18).

Ormond By The Sea Market Scorecard

Balanced Market (limited data)

Ormond By The Sea is currently a balanced market (limited data). About 1.1 months of supply, a median asking price of $295,000, and homes go under contract in about 333 days.

1.1
Months supply
$295,000
Median list
$290,000
Median sold
$282
Per sqft
333
Days on mkt
1/2/11
Active/Pend/Sold

Typical home value in the 32176 ZIP is $348,364, about 3.5% below the Florida norm (Zillow Home Value Index).

Go deeper: ZIP market scorecard · county scorecard · true cost calculator · affordability calculator.

Live data: © 2026 Daytona Beach Area Association of REALTORS®, Inc. Refreshed twice daily. Market metrics only; these describe homes for sale and recent sales, not residents.

Windows contain 0 to 11 sales each (11 in the current window); every figure carries its sample size, and thin markets swing on single closings. © 2026 Daytona Beach Area Association of REALTORS®, Inc. Deemed reliable but not guaranteed.

Homes sold per 12-mo window
051020182020202220242026
0 to 11 a year; 11 in the current window.

Ormond By The Sea Market Scorecard

Seller-leaning

Ormond By The Sea is currently a seller-leaning market. About 1.1 months of supply, a median asking price of $295,000, and homes go under contract in about 333 days.

1.1
Months supply
$295,000
Median list
$290,000
Median sold
$383
List $/sqft
333
Days on mkt
1/2/11
Active/Pend/Sold

Go deeper: ZIP market scorecard · county scorecard · true cost calculator · affordability calculator.

Live data: DBAMLS, refreshed twice daily. Market metrics only; these describe homes for sale and recent sales, not residents.

Homes For Sale Right Now in Ormond By The Sea

Live MLS inventory for Ormond By The Sea. Every active listing, what is under contract right now, and the last 12 months of closed sales, refreshed twice a day. Closed comps beat an algorithm's guess every time.
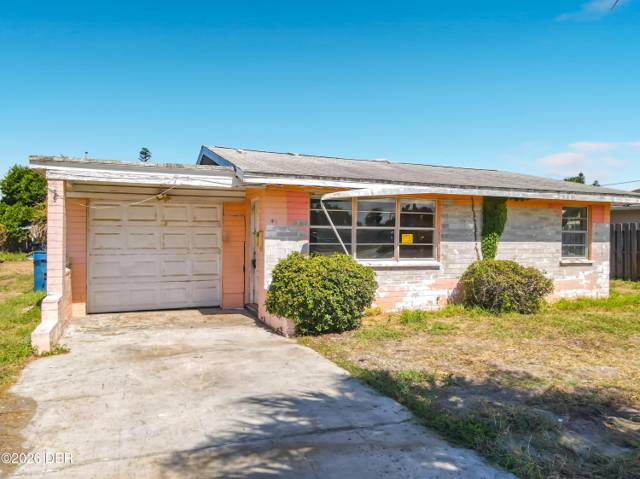
Active and pending Ormond By The Sea listings as of 2026-07-14, priced high to low. © 2026 Daytona Beach Area Association of REALTORS®, Inc. Tap any home to ask about it.

Listing locations from DBAMLS. Map data © OpenStreetMap, tiles © CARTO.

=======

Ormond By The Sea Market Scorecard

Balanced Market (limited data)

Ormond By The Sea is currently a balanced market (limited data). About 1.1 months of supply, a median asking price of $295,000, and homes go under contract in about 328 days.

1.1
Months supply
$295,000
Median list
$290,000
Median sold
$282
Per sqft
328
Days on mkt
1/2/11
Active/Pend/Sold

Typical home value in the 32176 ZIP is $348,364, about 3.5% below the Florida norm (Zillow Home Value Index).

Go deeper: ZIP market scorecard · county scorecard · true cost calculator · affordability calculator.

Live data: © 2026 Daytona Beach Area Association of REALTORS®, Inc. Refreshed twice daily. Market metrics only; these describe homes for sale and recent sales, not residents.

Frequently Asked Questions

>>>>>>> origin/main

If we were buying in Ormond By The Sea today, this is the order of operations we would run for our clients.

1

Underwrite the condition first. Price the roof, HVAC, and systems honestly before judging any list price; condition swings value here more than square footage alone.

2

Match the home to real comps. Recent sales of similar condition and lot, not the asking price, tell you what a home is worth.

3

Come strong and clean. Homes here move, so lead with your best terms and financing ready rather than a low anchor.

4

Line up financing and inspection early. A pre-approval and an inspection plan let you act fast and negotiate from evidence.

5

Keep an agent in your corner. The listing agent works for the seller; we represent you and prepare a hand-built valuation before any offer in Ormond By The Sea.

Best Buy
Buyers seeking a small-footprint coastal home in Ormond Beach rather than a larger primary residence.
Biggest Risk
The median price is down 3.3% year over year, and at a median 860 square feet, condition and lot matter more than size comparisons.
Sweet Spot
Homes near the $290,000 median in solid condition tend to move fastest given 1.1 months of supply.
Avoid If
Skip this one if you need a packaged amenity set — none are identified from current MLS listings.

Small footprint, tight supply

At a median of 860 square feet, homes in Ormond By The Sea run smaller than a typical single-family purchase, which is part of why the $281.91 per-square-foot figure carries more weight than the median price alone. With the building stock spanning 1951 to 2021 and a median year built of 1954, buyers should expect a wide range of renovation states rather than a uniform product line.

The current snapshot shows just 1 active listing against 11 closings in the recent window, which works out to 1.1 months of supply — tight enough to explain the seller-leaning designation even with the median price down 3.3% year over year. No community amenities are identified from current MLS listings, so buyers here are purchasing lot, proximity, and structure rather than a packaged amenity set.

The location and the amenities are priced into every listing in Ormond By The Sea. The deal is won or lost on condition, the comps, and the renovation math.

Jon Brooks · Founder, Momentum Realty
6.5B- · Buy Score
Recent Direction5.2/10
Liquidity & Demand8.9/10
Owner Commitment5.2/10
Pricing Power6.5/10

Momentum Intelligence Scores are our proprietary, qualitative assessment on a 0 to 10 scale, built from the record-level market data on this page. They are a framework for comparing communities, not a guarantee of future value and not advice on a specific home; unlike an automated value estimate they do not price your home, they grade the community on evidence you can inspect. Composite is the plain average of the 4 factors (6.5). Basis: Recent Direction -3.3% year-over-year; Liquidity & Demand 1.1 months of supply; Owner Commitment 52% owner-occupied; Pricing Power 94.8% sale-to-list. Refreshed with each data update.

Why work with Momentum here

With only 1 active listing and a median 86 days on market, pricing and timing decisions in Ormond By The Sea call for reading each of the 11 recent closings individually rather than leaning on headline averages — that is where local tracking of price-per-square-foot swings and the 1.1-months-of-supply picture pays off.

Ormond By The Sea in 15 seconds.

Best forBuyers seeking a small-footprint coastal home in Ormond Beach rather than a larger primary residence.
Biggest advantageInventory is exceptionally tight — just 1 active listing against 11 recent closings.
Biggest riskThe median price is down 3.3% year over year, and at a median 860 square feet, condition and lot matter more than size comparisons.
Sweet spotHomes near the $290,000 median in solid condition tend to move fastest given 1.1 months of supply.
Avoid ifSkip this one if you need a packaged amenity set — none are identified from current MLS listings.

HOA, CDD & Fees

In short
  • Mandatory HOA — confirm current dues
  • Any club/amenity membership is billed separately

Confirm the current HOA dues, exactly what they cover, and any CDD bond or special assessment for a specific address before you offer.

The takeaway

Selling here is won on condition and pricing to real comps, not an automated estimate. The right number comes from closed Ormond By The Sea sales matched to your home.

What is your Ormond By The Sea home worth?

Get a no-obligation home value based on real comparable sales in Ormond By The Sea, not an automated guess. Tell us about your home and we will personally prepare your numbers and a pricing strategy. No obligation, no spam.

See homes for sale in Ormond By The Sea on the map →

Real comps, not an automated estimate.

Frequently Asked Questions

What is the median home price in Ormond By The Sea?
The median sale price in Ormond By The Sea was $290K over the 12 months ending July 14, 2026 (11 closed sales, DBAMLS).
How long do homes in Ormond By The Sea take to sell?
Homes that closed in the 12 months ending July 14, 2026 took a median 86 days on market (11 sales, DBAMLS).
Is Ormond By The Sea a buyer's or seller's market right now?
As of July 14, 2026, Ormond By The Sea leans toward sellers: 1.1 months of supply at the current sales pace (DBAMLS live counts).
How many homes are in Ormond By The Sea?
The Florida DOR 2025 assessment roll shows 580 homes in Ormond By The Sea (public records).
What share of Ormond By The Sea is owner-occupied?
52% of Ormond By The Sea parcels carry a homestead exemption on the 2025 Florida DOR roll, the owner-occupancy proxy in public records.
When were the homes in Ormond By The Sea built?
Homes in Ormond By The Sea were built between 1951 and 2021, with a median year built of 1954 (FL DOR 2025 roll).
Do cash buyers compete in Ormond By The Sea?
Cash buyers took 50% of Ormond By The Sea sales in the 12 months ending June 2026 (6 of 12 closings, DBAMLS).
Who is the best real estate agent for Ormond By The Sea?
The best agent for Ormond By The Sea is one who actively works Ormond Beach and knows the community's pricing, fees, and current inventory. Tell us what you're looking for in the form on this page and Momentum Realty will match you with a local specialist for Ormond By The Sea.
How do I find a top Ormond Beach real estate agent who knows Ormond By The Sea?
Share a few details in the form on this page. Momentum Realty has 280+ agents and more than $3.5B in closed sales, and we'll connect you with one who knows Ormond By The Sea and the wider Ormond Beach area.
Can Momentum Realty connect me with an agent for Ormond By The Sea?
Yes. Use the form on this page and we'll introduce you to a local specialist who can guide your Ormond By The Sea purchase or sale - no call center and no pressure.
Buyers comfortable with a smaller living footprint (median 860 square feet) who prioritize location over size.Excellent fit
Buyers targeting a purchase near the $290,000 median who can move decisively in a tight-inventory market.Excellent fit
Buyers open to a wide range of renovation conditions, spanning homes built from 1951 to 2021.Excellent fit
Buyers who need built-in community amenities, since none are identified from current MLS listings.Probably not
Buyers who want a large living area, given the median home here runs near 860 square feet.Probably not
Buyers unwilling to compete for one of very few listings in a 1.1-months-of-supply market.Probably not

Nearby Communities

Explore more neighborhoods near Ormond By The Sea with Momentum Realty’s local guides.

Browse all Florida neighborhood guides →

Data sources & freshness

Live listingsDBAMLS, refreshed twice daily (last: July 14, 2026)
Community market statsDBAMLS closed sales, 12-month windows ending July 14, 2026
Housing stock & ownershipFlorida DOR 2025 assessment roll (community parcel extract)
Under-contract sharesDBAMLS records, as of 2026-07-12
Historical depthClosed-sale records back to 2017 (18 transactions analyzed)

Verify the primary sources yourself: Florida DOR · U.S. Census · FEMA flood maps · Citizens Property Insurance.

Momentum Research figures are our own analysis of DBAMLS records; MLS data is deemed reliable but not guaranteed. Methodology: how Momentum market scores are computed. Market metrics describe homes for sale and recent sales, not residents.

Data sources & freshness

Live listingsDBAMLS, refreshed twice daily (last: July 14, 2026)
Community market statsDBAMLS closed sales, 12-month windows ending July 14, 2026
Housing stock & ownershipFlorida DOR 2025 assessment roll (community parcel extract)
Under-contract sharesDBAMLS records, as of 2026-07-12
Historical depthClosed-sale records back to 2017 (18 transactions analyzed)

Verify the primary sources yourself: Florida DOR · U.S. Census · FEMA flood maps · Citizens Property Insurance.

Momentum Research figures are our own analysis of DBAMLS records; MLS data is deemed reliable but not guaranteed. Methodology: how Momentum market scores are computed. Market metrics describe homes for sale and recent sales, not residents.

Own a home here?

You just read the data. Now see what your home is worth.

The numbers on this page move markets in the aggregate. The number that matters to you is what a buyer pays for your address. Momentum sells for 1.25% above the DBAMLS member average and 8 days faster, and we’ll price yours against live your area comps.

Looking to buy here? Search homes for sale →

What’s your home worth in your area?

A real valuation with real comps from a local listing agent, not an instant algorithm. Response within one business day.

By submitting, you agree that EAB RE INVESTMENTS LLC (Momentum Realty) and its agents may call, email, and text you about your inquiry, which may involve automated means and prerecorded or artificial voices. You do not need to consent as a condition of buying any property, goods, or services. To opt out, reply STOP at any time or reply HELP for assistance. You can also click the unsubscribe link in emails. Message and data rates may apply. Message frequency may vary. See our Privacy Policy and SMS Terms.or call (904) 351-6461

More Ormond Beach & Volusia County / Daytona Beach Area guides

Compare before you commit - every guide covers pricing, HOA/CDD, insurance posture, and fit. Browse all of Volusia County / Daytona Beach Area or the full Neighborhood Finder.

Talk to a Local Ormond By The Sea Expert