
Woodmont
Homes for Sale in Jacksonville, FL
All 4,086 homes for sale in Jacksonville, FL · median $299,900 · 375 homes for sale in 32218 · Duval County homes for sale
True comps, carrying-cost math, and listings before the portals.
Market Heat
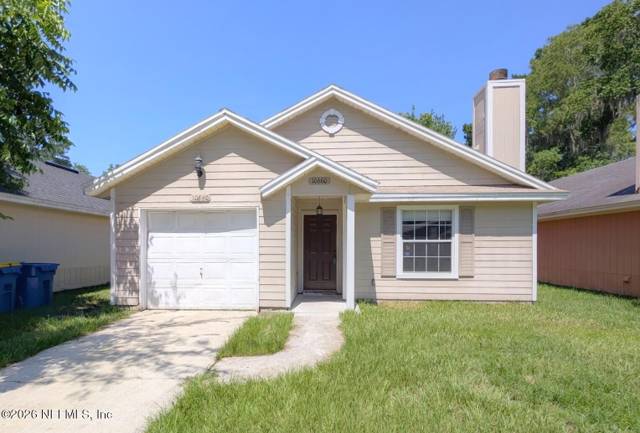
Photo courtesy of CORE REALTY, LLC · via realMLS
Over the 12 months ending 2026-10-12, 4 recorded sales closed at a median of $176,000, $168 per square foot, a median 12 days on market, sellers accepting 98% of original asking (+24% versus the prior year). Homes listed or recently sold were built 1985–1994; none of the 5 geocoded homes sit in a FEMA special flood hazard zone (median elevation 18 ft). At the median price and Duval County's FY2025-26 rate of 17.86 mills, annual property tax runs about $3,140 ($2,410 with the full homestead exemption).

Price here starts with scale: Woodmont's 127 homes carry a median of $155,000, or $163.96 per square foot, against a median living area of just 1,164 square feet. Construction spans 1985 through 2014, with a median year built of 1987, so most of the stock reflects the earlier end of that range rather than the newer construction built closer to 2014.
The current posture favors sellers only mildly. Months of supply sits at 3.0 (balanced), median days on market is 15, and there is a single active listing against 5 closings in the most recent window — thin enough that any one sale can swing the read. Prices are up 14.8% year over year and 675% since 2012, a run that reflects how far off the post-2012 floor this pocket started, not a promise of what happens next.
Woodmont right now
🟢 Still climbing. The trailing-12-month median ($176K) is up 23.5% from the prior 12 months ($142K) and up 780% since 2012. With about 5 sales a year, a single closing can swing this number, so read the level and the decade, not one year's move.Momentum Research, record-level realMLS closed sales, 12-month windows ending October 12. Confidence: Low (4 and 4 sales in the two windows).
Jump to: Price history & scorecard · Homes for sale · Schools · FAQ
· Updated October 13, 2026 · Live data: realMLS, refreshed twice daily · MLS facts carry their source; interpretation lines are Momentum Research · Data sources & freshness
The 60-Second Overview
Woodmont market snapshot (as of October 12, 2026): the median sale price is about $176K ($168 per sq ft over the trailing 12 months of closed sales), and a median 13 days on market for closed sales. The trailing-12-month median is up 24% from the prior 12 months and up 780% since 2012, computed from record-level realMLS closed sales (4 closings in the current window).
In ZIP 32218 (Jacksonville), 1,073 homes closed in the last 12 months at a median of $315K ($173/sq ft), up 0.8% year over year, with a median 42 days on market. Right now 241 active and 99 pending listings put supply at about 3.5 months — a healthy market. See the live ZIP 32218 housing market and the Duval County market.
County records show 6 qualified sales in Woodmont across 2024–2025 (2 in 2024, 4 in 2025), median $150,000 — the last recorded sale per parcel on the Florida DOR 2025 assessment roll, independent of the MLS.
Woodmont is a community of 127 homes in Jacksonville, Duval County, built between 1985 and 2014 (median 1987), with a median living area of about 1,164 square feet. 54% of parcels are homesteaded, the owner-occupancy proxy in the Florida DOR assessment roll (2025 roll, public records).
Woodmont is a compact, 127-home Jacksonville community built out mostly between 1985 and 2014, sitting at the value end of the Duval County market on both price and square footage. No shared amenities are identified in current MLS listings, so the draw here is the home and the price point, not a clubhouse or pool.
The setting & the homes.
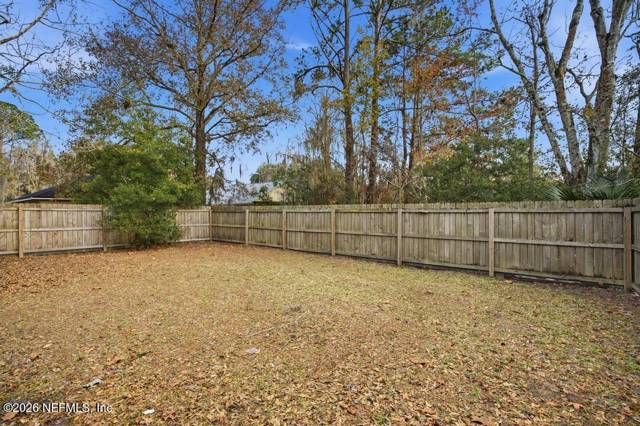
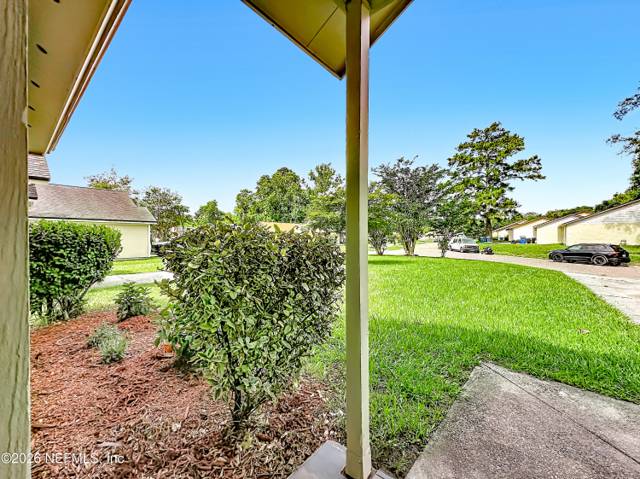
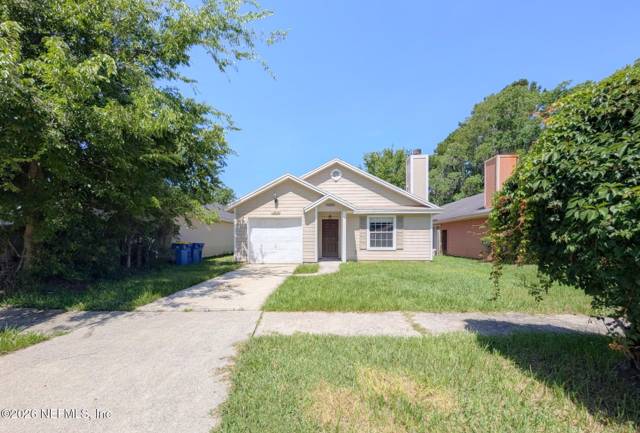
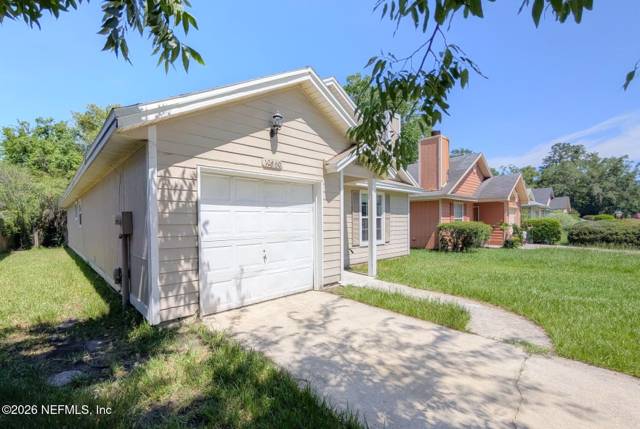
Aerial and on-site photos of Woodmont. Swipe to explore the community.
Swipe or use the arrows → tap any photo to enlarge
Woodmont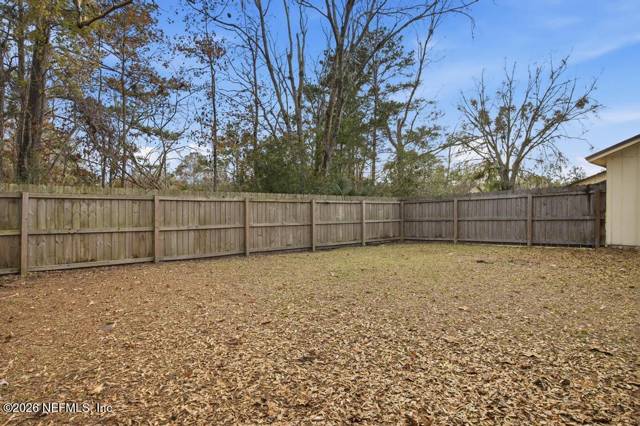 Woodmont
 Woodmont
 Woodmont
 Woodmont
 Woodmont
Photos from realMLS listings in Woodmont; content deemed reliable but not guaranteed.
Who Woodmont is best for.
Best for
- Buyers focused on the lowest available entry price in the area, comfortable with a smaller floor plan.
- Buyers who can move quickly once a listing appears, given how few homes are active at once.
- Buyers or investors comfortable evaluating a build year within the 1985-2014 range against renovation needs.
Probably not for
- Buyers who need a living area well above the 1,164-square-foot median.
- Buyers who want on-site shared amenities, since none are identified in current listings.
- Buyers unwilling to move fast in a 15-day median days-on-market market with only one listing active at a time.
Price History: What Homes Here Have Actually Sold For
Median sale price over the trailing 12 months ending October 12 of each year, from record-level realMLS closed sales. Same methodology as every appreciation figure on this page: the 2026 point ($176K) IS the median in the snapshot above, and the move from 2025 ($142K) IS the +23.5% one-year change.
Windows contain 2 to 10 sales each (4 in the current window); every figure carries its sample size, and thin markets swing on single closings. Source: Data provided by realMLS. Deemed reliable but not guaranteed.
28% of homes for sale in ZIP 32218 are already under contract (under contract ÷ under contract + active listings) — a read on how much of the available inventory buyers have already claimed. Source: MLS data (2026-10-13).
Woodmont Market Scorecard
Woodmont is currently a balanced market..
Go deeper: ZIP market scorecard · county scorecard · true cost calculator · affordability calculator.
Live data: realMLS, refreshed twice daily. Market metrics only; these describe homes for sale and recent sales, not residents.
Homes For Sale Right Now in Woodmont
Live MLS inventory for Woodmont. Every active listing, what is under contract right now, and the last 12 months of closed sales, refreshed twice a day. Closed comps beat an algorithm's guess every time.
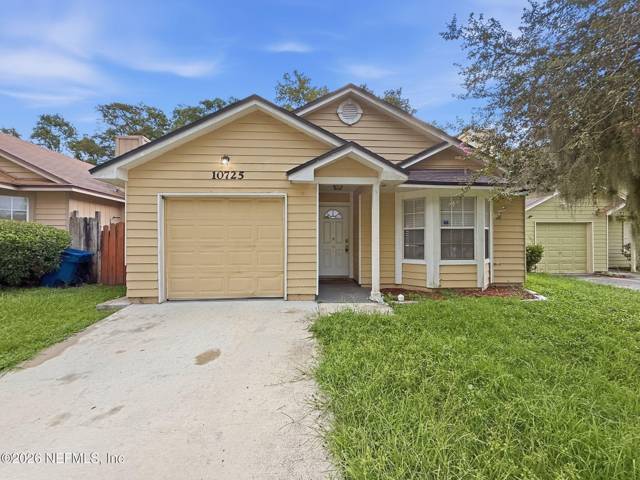
Active and pending Woodmont listings as of 2026-10-12, priced high to low. Source: Data provided by realMLS. Tap any home to ask about it.
Woodmont on the map.
Every active, pending, and recently sold home, plotted. Toggle the layers and tap a home for the details.
Listing locations from realMLS. Map data © OpenStreetMap contributors.
Schools
- Duval County Public Schools
- Verify the zoned schools by address
- Magnet and choice options may be available
- Citrus Park Elementary (verify by address)FLDOE grade A · Public
- Confirm zoned middle and high · By address
- Magnet and choice options may apply · Choice
Grades are official Florida Department of Education school grades for 2025-26. Assignments are reported as of the 2025-26 year and can change; always confirm with Duval County Public Schools for a specific address.
Buying with schools in mind? We can confirm the exact zoned schools for any Woodmont address.
Shop the zone: Homes zoned for Garden City Elementary School · Homes zoned for Highlands Middle School · Homes zoned for Jean Ribault High School
Recent Developments in Woodmont
Development, infrastructure, retail, and school activity affecting Woodmont, tracked by our team and summarized from public reporting and official sources, with links to the original coverage. Last updated October 2026.
- October 2026Retail & Dining
Council committee defers vote on incentives for Downtown Publix at 119 W. Beaver St.
The Finance Committee deferred a $49.65 million incentive package for Gateway Jax's $140.15 million high-rise anchored by a Publix at 119 W. Beaver St. The tower is planned with 259 apartments and about 400 parking spaces. The committee is scheduled to revisit the bill Nov. 4, the day after the Amendment 3 vote.
What it may mean for the marketThe timing of the first full-size grocery store in the Downtown core depends on the incentive vote, affecting nearby retail access. The project is about 7 miles south of Woodmont, elsewhere in Duval County.
Source: Jacksonville Today - September 2026Infrastructure
JEA advances about $690 million in infrastructure projects including Fulton Cut transmission line raise near JAXPORT
JEA is moving forward with three water reclamation projects (Blacks Ford in northwest St. Johns County, over $220 million; near Jacksonville International Airport, about $193 million; East Arlington, just under $165 million) and the $117 million Fulton Cut transmission line clearance over the St. Johns River near Blount Island. Fulton Cut, shared with JAXPORT and the city, is expected to finish in summer 2027 and all four projects by 2030.
What it may mean for the marketRaised power lines support larger ship access to port terminals, and new reclamation capacity supports growth in surrounding areas. The site is about 11 miles east of Woodmont.
Source: News4JAX - September 2026Development
Gateway Jax seeks more than $70 million in city incentives for Riverfront Plaza tower and Hotel Merrydelle
Gateway Jax is requesting about $55.4 million in incentives for a 17-story, roughly $271.5 million Riverfront Plaza tower with 130 to 170 hotel rooms and 50 to 150 residences on Independent Drive. It also seeks a $15 million loan for the nearly $50 million renovation of the former Ambassador Hotel at 420 Julia Street. The Downtown Investment Authority board votes Sept. 16 and City Council has the final say.
What it may mean for the marketIf approved, the projects would add hotel rooms, residences and restaurants along the Downtown riverfront. The site is about 8 miles south of Woodmont.
Source: Jacksonville Today - September 2026Development
Downtown review board approves concept for first new University of Florida graduate campus building in LaVilla
The Downtown Development Review Board voted 7-0 on Sept. 10 for a six to eight story, roughly 185,000 square foot academic building on a 2.34-acre site bounded by West Bay, Forsyth and North Lee streets. It is the first new building in a multiphase UF graduate and semiconductor institute campus estimated at $345 million. UF hopes to break ground in December, pending final design review and permitting.
What it may mean for the marketA large graduate campus adds education and technology jobs and daytime foot traffic to the western Downtown core. The site is about 8 miles south of Woodmont.
Source: Jacksonville Today - July 2026Development
Culinary Institute of America selects Jacksonville for Southeast campus
News4Jax reported that the Culinary Institute of America chose downtown Jacksonville for its Southeast hub, to be located at 330 E. Bay Street on the Northbank riverfront. The campus would anchor a $160.5 million hotel and convention center development. The city previously approved up to $35 million in incentives, and the Downtown Investment Authority is finalizing agreements on design and property details.
What it may mean for the marketAnchors a major downtown riverfront redevelopment that pairs an educational campus with hotel and convention space, adding institutional and commercial investment to the urban core alongside Riverfront Plaza and Pearl Square. The project is about 8 miles south of Woodmont, elsewhere in Duval County.
Source: News4Jax - April 2026Development
Southeast Toyota opens $170M vehicle-processing facility at JAXPORT's Blount Island, adding 400-plus jobs
Southeast Toyota Distributors dedicated a new vehicle processing facility at JAXPORT's Blount Island Marine Terminal in April 2026. The company put the investment at $170 million and said the facility created more than 400 full-time jobs, most of them hired locally.
What it may mean for the marketA large new employment center on Blount Island adds sustained local job demand, a factor that has historically supported nearby housing absorption. The project is about 11 miles east of Woodmont, elsewhere in Duval County.
Source: JAXPORT
Summaries reflect public reporting and official sources linked above as of the dates shown. Project details, timelines, and approvals can change. Commentary on potential market effects is general observation, not investment advice or a prediction for any specific property. For the freshest items across the whole region, see This Week in Northeast Florida.
The Woodmont buying strategy.
If we were buying in Woodmont today, this is the order of operations we would run for our clients.
Underwrite the condition first. Price the roof, HVAC, and systems honestly before judging any list price; condition swings value here more than square footage alone.
Match the home to real comps. Recent sales of similar condition and lot, not the asking price, tell you what a home is worth.
Move deliberately, not desperately. Neither side has a decisive edge, so a well-prepared, fairly-priced offer wins without overpaying.
Line up financing and inspection early. A pre-approval and an inspection plan let you act fast and negotiate from evidence.
Keep an agent in your corner. The listing agent works for the seller; we represent you and prepare a hand-built valuation before any offer in Woodmont.
What's Actually Driving Woodmont's Price
At a median of $155,000 and $163.96 per square foot, Woodmont prices below much of the surrounding Jacksonville market, and the median living area of 1,164 square feet explains a real part of that gap — these are smaller homes, not just cheaper ones. Build years run 1985 to 2014 with a median of 1987, so buyers should expect a mix of original systems toward the older end and comparatively newer construction toward the later end of that span, with condition doing a lot of the pricing work inside the range.
A homestead exemption share of 54.3% shows a slight majority of homes here are owner-occupied primary residences, with the rest split between second homes, rentals, or recent purchases that haven't yet filed. With only 1 active listing and 5 closings in the recent window, the data set is thin — useful for direction, not for pinning down an exact number on any single property. A 15-day median days-on-market figure and 3.0 months of supply point to a balanced market where reasonably priced, move-in-ready listings do not sit long.
The location and the amenities are priced into every listing in Woodmont. The deal is won or lost on condition, the comps, and the renovation math.
Momentum Buy Score.
Our proprietary 0 to 10 read across the factors that decide how a home in Woodmont buys, holds, and resells. Momentum Research; not an appraisal.
Momentum Intelligence Scores are our proprietary, qualitative assessment on a 0 to 10 scale, built from the record-level market data on this page. They are a framework for comparing communities, not a guarantee of future value and not advice on a specific home; unlike an automated value estimate they do not price your home, they grade the community on evidence you can inspect. Composite is the plain average of the 4 factors (8.5). Basis: Long-Term Appreciation +780% since 2012; Recent Direction +23.5% year-over-year; Owner Commitment 54% owner-occupied; Pricing Power 98.0% sale-to-list. Refreshed with each data update.
Why work with Momentum here
With active inventory this thin — one listing against 127 total homes — pricing a purchase or a sale correctly means leaning on closed data and trend, not just what's currently on the market. Momentum tracks Woodmont's closings, days on market, and the 14.8% year-over-year move alongside the wider Duval County picture, so offers and listing prices are grounded in what's actually trading, not guesswork on a market where the comparable pool is this shallow.
Woodmont in 15 seconds.
What it really costs to own in Woodmont
The parts of the monthly number a mortgage calculator leaves out, from the tax roll, the MLS, Citizens and FEMA. Property facts only.
| Property tax | Current owners' bills run a median of $2,366/yr across 3 listings here (MLS tax records, 2026-10-13). |
|---|---|
| Home and flood insurance | The average Citizens Property Insurance premium in Duval County is $1,315/yr (2,001 policies, Citizens detail by county, April 2026); private-market quotes depend on roof age, wind mitigation and construction. |
| Roof and age | Median build year 1986 across 4 listings. An original roof here would be about 40 years old; under Florida's 2022 reform (SB 2-D) carriers may require an inspection past 15 years, so budget for a roof report, and for replacement where it fails. |
Ask an agent about Woodmont
Have a question about the homes, fees, rules or commute here? A Momentum agent who works Woodmont will answer, and the answer is published on this page for the next buyer.
HOA, CDD & Fees
- HOA status not on record. Verify any dues before you offer
- Any club/amenity membership is billed separately
Confirm the current HOA dues, exactly what they cover, and any CDD bond or special assessment for a specific address before you offer.
Tools for a Woodmont buy.
Free calculators to pressure-test the real cost before you tour.
Selling here is won on condition and pricing to real comps, not an automated estimate. The right number comes from closed Woodmont sales matched to your home.
Price it to the comps and condition, not an automated estimate.
If you are thinking about selling in Woodmont, the right list price comes from recent comparable sales matched to your home's condition and location, not an automated estimate.
What is your Woodmont home worth?
Get a no-obligation home value based on real comparable sales in Woodmont, not an automated guess. Tell us about your home and we will personally prepare your numbers and a pricing strategy. No obligation, no spam.
See all homes for sale in Jacksonville →
Recently off market in Woodmont
Homes in Woodmont that recently left the market. Each address opens its public-record profile: county-recorded value, property taxes, the last recorded sale, community sales history, and what is for sale nearby now. 5 on record.
- 10623 Meadowlea Drive · off market
- 10660 Northwyck Drive · off market
- 10718 Meadowlea Drive · off market
- 10721 Meadowlea Drive · off market
- 3236 Meadowlea Circle · off market
| Location | Jacksonville, Duval County, FL · ZIP 32218 |
|---|---|
| Homes in the community | 127 (FL DOR 2025 assessment roll) |
| Years built | 1985–2014 (median 1987) |
| Typical living area | 1,164 sq ft (median) |
| Home types (current listings and sales) | townhouses 60%, single-family 40% |
| Amenities listed by sellers | Curbs |
| Sale prices, last 12 months | $176,000 median across 4 closed sales · $168 per sq ft · +23.5% vs the prior 12 months |
| Days on market (closed sales) | 12 median |
| For sale right now | 0 active, 1 pending |
| Owner-occupied (homestead) share | 54% |
| Zoned public schools | Citrus Park Elementary (verify by address) (A, FLDOE 2025-26); Confirm zoned middle and high; Magnet and choice options may apply |
Data as of October 12, 2026. Data provided by realMLS; housing-stock figures from Florida Department of Revenue public records. Market figures describe homes, not residents. Cite as: Momentum Realty, “Woodmont key facts,” movewithmomentum.com/neighborhoods/woodmont, data as of October 12, 2026.
Every Home for Sale in Woodmont Right Now (1)
All 1 active and pending Woodmont listings with a detail page, newest first, refreshed twice a day from the MLS.
- 10725 Meadowlea Drive · $115,000 · 3 bd / 2 ba · pending · listed Aug 26, 2026 · listed by Mainstay Brokerage Llc
Recently sold in Woodmont
- 10721 Meadowlea Drive · sold $240,000
- 10718 Meadowlea Drive · sold $170,000
- 3236 Meadowlea Circle · sold $154,500
- 10623 Meadowlea Drive · sold $182,000
Closed sales from the MLS; each page shows the sold price, taxes and value history.
More Jacksonville home searches
- All homes for sale in Jacksonville, FL
- Homes for sale in Duval County, FL
- Jacksonville pool homes for sale
- Jacksonville waterfront homes for sale
- Gated communities in Jacksonville
- Jacksonville golf course homes
- Homes under $300K in Jacksonville
- Homes from $300K to $500K in Jacksonville
- 4-bedroom homes for sale in Jacksonville
- Jacksonville home values: what is my house worth?
Streets in this community
Street-level pages: every home on record, what sold and what is for sale on each street.
- Meadowlea Drive (22 homes on record)
- Northwyck Drive (22 homes on record)
- Northwyck Drive (14 homes on record)
- Meadowlea Drive (8 homes on record)
- Meadowlea Drive (5 homes on record)
- Meadowlea Drive (5 homes on record)
- Grove Park Boulevard (1 homes on record)
- Hutton Lane (1 homes on record)
Frequently Asked Questions
What is the median home price in Woodmont?
How long do homes in Woodmont take to sell?
How many homes are in Woodmont?
What share of Woodmont is owner-occupied?
When were the homes in Woodmont built?
Have Woodmont home prices gone up?
What schools serve Woodmont?
Who is the best real estate agent for Woodmont?
How do I find a top Jacksonville real estate agent who knows Woodmont?
Can Momentum Realty connect me with an agent for Woodmont?
Where is Woodmont, and what county is it in?
How far is Woodmont from downtown Jacksonville and the beach?
Should you buy in Woodmont?
An honest fit check. We will tell you when it is not your community.
Data sources & freshness
| Live listings | realMLS, refreshed twice daily (last: October 12, 2026) |
| Community market stats | realMLS closed sales, 12-month windows ending October 12, 2026 |
| Housing stock & ownership | Florida DOR assessment roll (street-list match (3 streets, ZIP 32211/32218)) |
| Under-contract shares | realMLS records, as of 2026-10-12 |
| Schools | 2025-26 district assignments + FLDOE school grades; verify with the district |
| Historical depth | Closed-sale records back to 2001 (123 transactions analyzed) |
Verify the primary sources yourself: Florida DOR · U.S. Census · FEMA flood maps · Citizens Property Insurance.
Momentum Research figures are our own analysis of realMLS records; MLS data is deemed reliable but not guaranteed. Methodology: how Momentum market scores are computed. Market metrics describe homes for sale and recent sales, not residents.
Own a home here?
You just read the data. Now see what your home is worth.
The numbers on this page move markets in the aggregate. The number that matters to you is what a buyer pays for your address. Momentum sells for 1.25% above the realMLS member average and 8 days faster, and we’ll price yours against live local comps.
Looking to buy here? Search homes for sale →
What’s your home worth in your area?
A real valuation with real comps from a local listing agent, not an instant algorithm. Response within one business day.
See how Woodmont fits the bigger picture — live prices, inventory, and Momentum Scores:
Nearby Communities
Explore more neighborhoods near Woodmont with Momentum Realty’s local guides.
More on Woodmont
- Home values · What homes in Woodmont actually sell for