
Market Brief
Pinellas County townhouse and condo supply fell to 6.6 months in October 2026 from 8.0 a year earlier as new contracts held at 469 and cash buyers paid for 59.2% of closings, while house contracts fell 17.0%, according to Florida Realtors data.
Pinellas condo supply fell to 6.6 months from 8.0 as contracts held steady and cash buyers took 59.2% of sales. House contracts fell 17%.
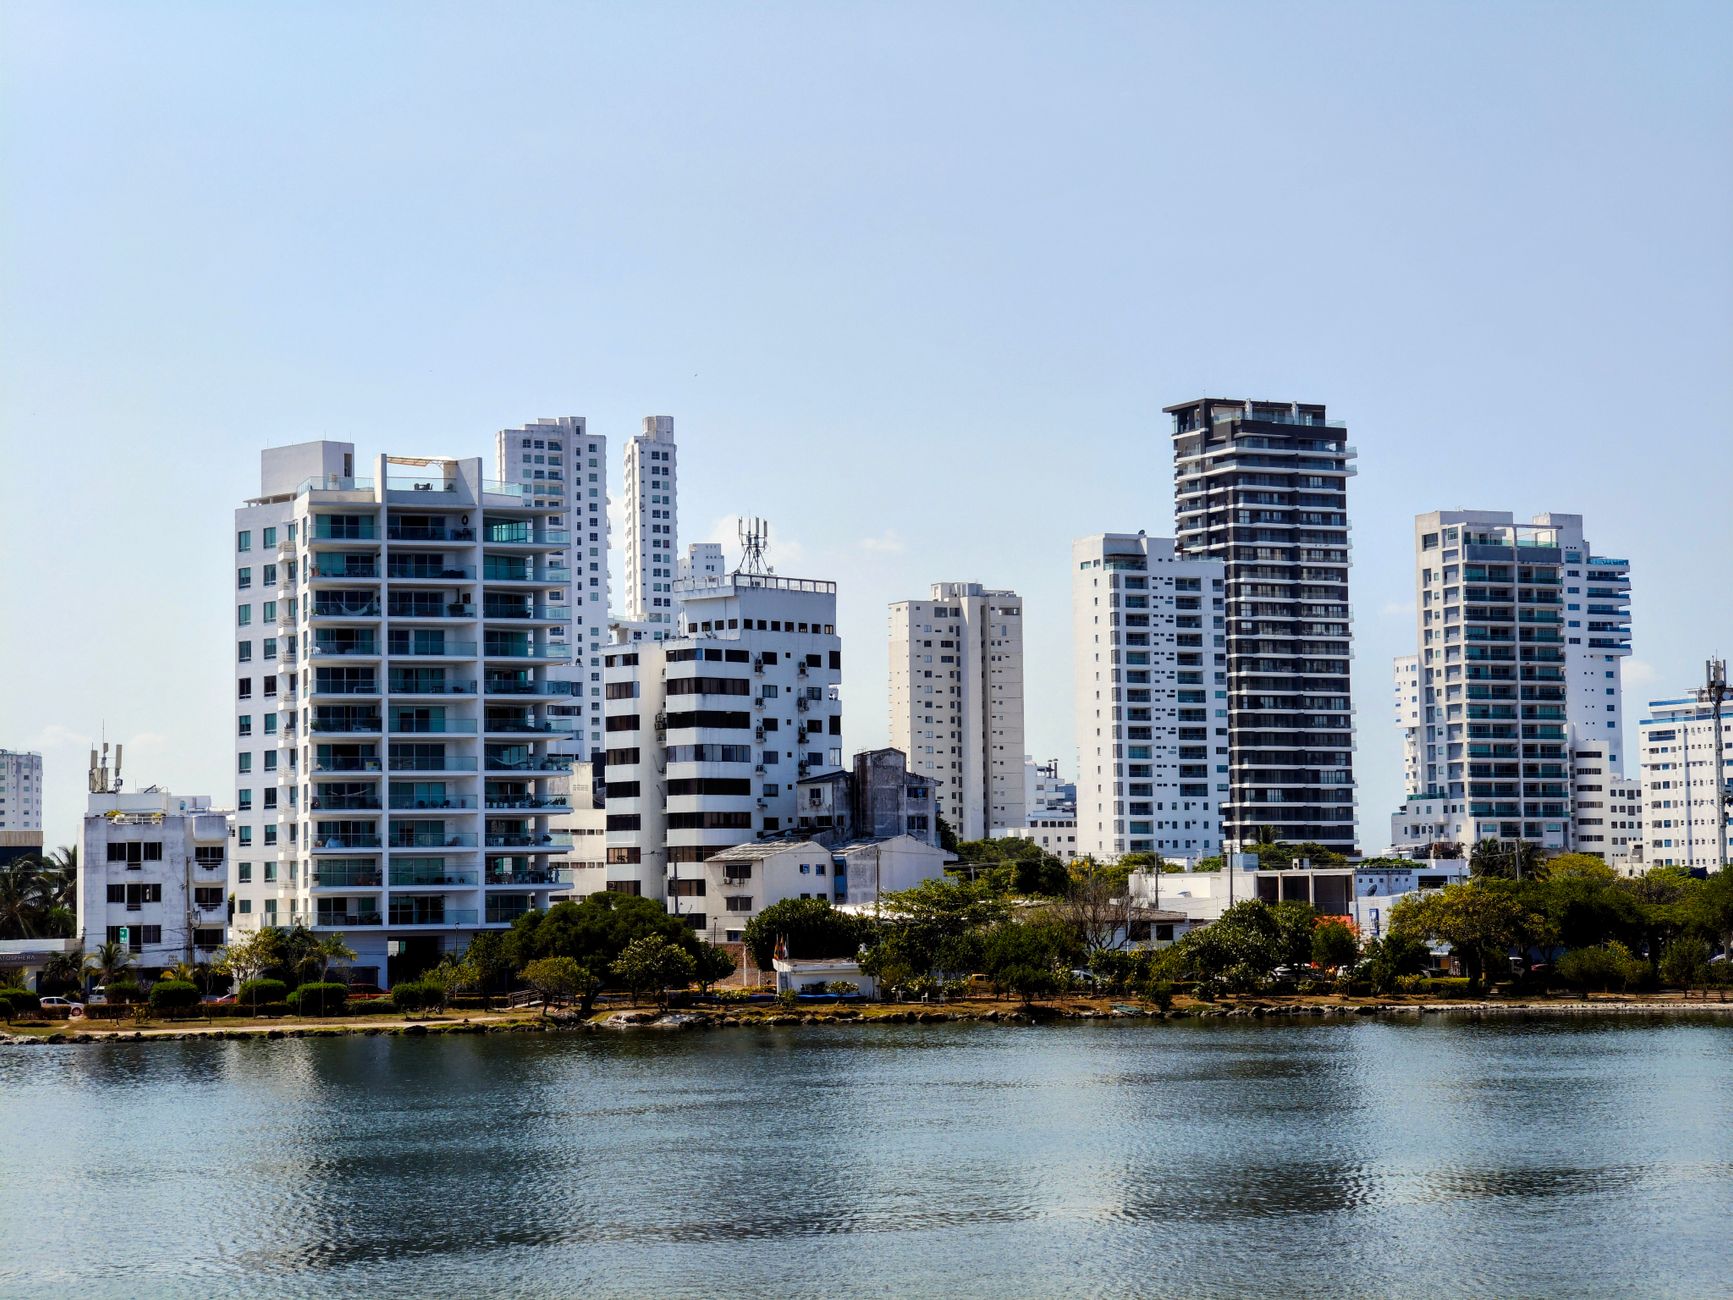
Pinellas County had 6.6 months of townhouse and condo supply in October 2026, down from 8.0 a year earlier, according to October statistics released November 16 by the Suncoast Tampa Association of REALTORS from Florida Realtors data. New condo contracts held at 469, against 470 a year earlier, and cash buyers paid for 59.2% of the 439 condo closings. On the house side, new contracts fell 17.0% to 742 and supply eased to 3.9 months from 4.2.
This piece covers the condo and house split in October. Completed-month prices and pace for Pinellas are on the St. Petersburg market data hub.
How much condo supply does Pinellas County have?
| Townhouse and condo measure | October 2026 | October 2025 | Change |
|---|---|---|---|
| Months of supply | 6.6 | 8.0 | -17.5% |
| New pending sales | 469 | 470 | -0.2% |
| Closed sales | 439 | 468 | -6.2% |
| Pending inventory | 527 | ||
| Median sale price | $245,000 | $265,000 | -7.5% |
| Average sale price | $394,604 | $379,084 | +4.1% |
| Dollar volume | $173.2 million | $177.4 million | -2.4% |
Source: Florida Realtors, Pinellas County monthly market detail, October 2026, released November 16, 2026, Stellar MLS data.
Condo supply is still above the six months often used as the line for a balanced market, but it has moved much closer in a year. Contracts were flat while closings dipped 6.2%, so the drop in supply came from fewer condos on the market rather than a jump in buyers.
Why do cash buyers matter for Pinellas condos?
Cash buyers paid for 260 of 439 condo closings, or 59.2%, up from 251 a year earlier even as total closings fell. For houses the cash share was 32.8%, 243 of 741 closings. A buyer paying cash does not need a lender to approve the building, which can make some condo purchases simpler to close.
The median condo price fell 7.5% to $245,000 while the average rose 4.1% to $394,604. A falling median with a rising average means more sales at the top of the range and softer prices in the middle. Our Pinellas condos and building age piece shows how older buildings price against newer ones, and our condos under contract piece covers which listings are finding buyers.
How did Pinellas houses do in October 2026?
| Single-family measure | October 2026 | October 2025 | Change |
|---|---|---|---|
| New pending sales | 742 | 894 | -17.0% |
| Closed sales | 741 | 883 | -16.1% |
| New listings | 1,093 | 1,189 | -8.1% |
| Active listings | 3,245 | 3,654 | -11.2% |
| Months of supply | 3.9 | 4.2 | -7.1% |
| Median sale price | $450,000 | $450,000 | 0.0% |
| Median % of original list price | 94.7% | 93.3% | +1.5% |
| Median days to contract | 39 | 46 | -15.2% |
| Median days to sale | 73 | 82 | -11.0% |
Source: Florida Realtors, Pinellas County, October 2026.
House contracts and closings both fell by about a sixth, but listings fell too, so supply tightened rather than grew. The median price held at $450,000, sellers got a slightly higher share of asking price, and the median house went under contract a week faster than a year earlier. Fewer homes changed hands, but the ones that did sold on firmer terms.
Are distressed sales rising in Pinellas?
Not meaningfully. Of 741 house closings, 736 were traditional sales, 4 were bank-owned and 1 was a short sale, all lower than a year earlier. Distressed sales were under 1% of house closings, our arithmetic.
How does Pinellas compare with Hillsborough?
Across the bay, Hillsborough moved the other way. Its house supply rose to 4.2 months and its condo supply to 6.1 months in October, as covered in our Hillsborough pending sales piece. Pinellas condo supply is still higher than Hillsborough's, 6.6 months against 6.1, but the gap narrowed sharply from a year earlier, when Pinellas stood at 8.0.
What does this mean for buyers and sellers?
For condo buyers, 6.6 months of supply still gives room to compare buildings, association fees and insurance costs, and the large cash share means financed offers may compete with cash ones. For condo sellers, steady contracts and shrinking supply are an improvement on a year ago. For house buyers, 3.9 months of supply and a 39-day median to contract mean desirable houses move quickly; sellers received a median 94.7% of their original asking price.
Our Pinellas ZIP codes piece shows where homes sell fastest. Current listings are on the St. Petersburg, Clearwater and Largo pages.
People also ask
Is the Pinellas County condo market improving?
Condo supply fell to 6.6 months in October 2026 from 8.0 a year earlier, and new contracts held at 469, against 470, according to Florida Realtors data. The median condo price fell 7.5% to $245,000.
What share of Pinellas condo sales are cash?
Cash buyers paid for 59.2% of Pinellas townhouse and condo closings in October 2026, 260 of 439. The cash share for houses was 32.8%.
What is the median house price in Pinellas County?
The single-family median sale price was $450,000 in October 2026, unchanged from October 2025, according to Florida Realtors.
How fast are Pinellas houses selling?
The median Pinellas house went under contract in 39 days in October 2026, down from 46, and closed in 73 days, down from 82.
Limitations
Figures come from the Florida Realtors county report for one month, built from Stellar MLS data and subject to revision. Pending inventory was not printed for October 2025. Percent shares and the distressed share are our arithmetic from reported counts. The note on cash purchases and building approval is general context, not a finding of the report. Association medians count closings differently from our Market Pulse, so the two will not match.
Sources
- Pinellas County Monthly Market Detail, October 2026, Florida Realtors via Suncoast Tampa Association of REALTORS, released November 16, 2026.
- Hillsborough County Monthly Market Detail, October 2026, Florida Realtors, released November 16, 2026.
- St. Petersburg market data hub, Momentum Research.
Disclosure: Jon Brooks is a co-founder of Momentum Realty, a Florida real estate brokerage that owns and funds Florida Housing Intelligence. Momentum has a financial interest in Florida real estate transactions, including in markets named here. See our editorial standards.
Market statistics in this article are computed from MLS data licensed by Momentum Realty, and are current as of the date shown. Data may be preliminary and subject to revision by its source. This article is general information, not advice about any specific property, transaction, or financial decision, and is not a representation about any specific property, community, builder, or association.
Equal Housing Opportunity. Editorial standards · Corrections · About