
Metrowest
Homes for Sale in Orlando, FL
All 4,060 homes for sale in Orlando, FL · median $384,945 · 187 homes for sale in 32835 · Orange County homes for sale
True comps, carrying-cost math, and listings before the portals.
Market Heat
Over the 12 months ending 2026-09-12, 7 recorded sales closed at a median of $411,500, $218 per square foot, a median 81 days on market, sellers accepting 95% of original asking (+4% versus the prior year). At the median price and Orange County's FY2025-26 rate of 16.67 mills, annual property tax runs about $6,860 ($6,190 with the full homestead exemption).
Part of Metrowest, Orlando, FL — see all Metrowest homes for sale (7 listings across 3 sections in the MLS).
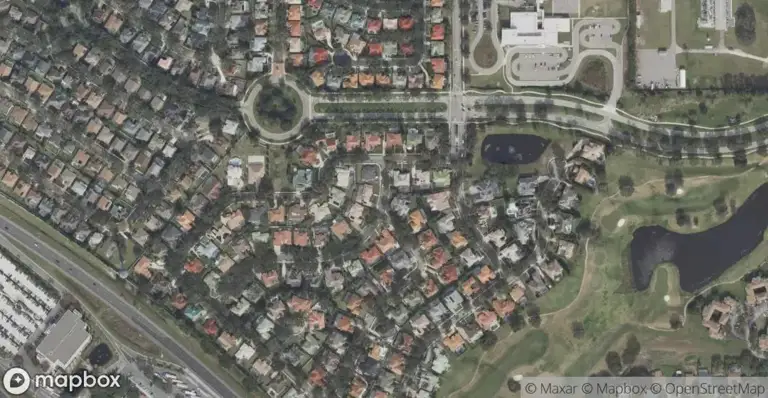
Part of the MetroWest master-planned community in Orlando, FL — see all MetroWest homes for sale (64 listings across 18 villages and sections in the MLS).

MetroWest in Orlando is a build-out community with homes dating from 1987 to 2023 and a median build year around 1990, which tells you most of what you need to know about pricing here: condition and updates drive the number more than location or square footage. With a median of roughly 1,796 living square feet, floor plans are moderate, so the spread between a dated original and a fully renovated home can be wide. There is no clean price ladder here - you price the house in front of you, not the neighborhood.
At about 240 homes in the current snapshot and a homestead share near 70%, most inventory is owner-occupied rather than investor-held, which tends to keep supply measured. For sellers, that means a well-prepared, updated home stands apart in a market where the median home is more than three decades old. For buyers, it means bidding on condition: pay for the renovation someone else already did, or budget for the work yourself.
Metrowest right now
🟡 Still climbing. The trailing-12-month median ($412K) is up 4.2% from the prior 12 months ($395K). With about 5 sales a year, a single closing can swing this number, so read the level and the decade, not one year's move.Momentum Research, record-level Stellar MLS closed sales, 12-month windows ending September 12. Confidence: Medium (7 and 10 sales in the two windows).
Jump to: Price history & scorecard · Homes for sale · Schools · FAQ
· Updated September 15, 2026 · Live data: Stellar MLS, refreshed twice daily · MLS facts carry their source; interpretation lines are Momentum Research · Data sources & freshness
Nearby homes for sale
No active listings inside metrowest rep right now. These are the 6 closest homes on the market, by straight-line distance from the community's center; some may sit just outside its boundary.


Listing data from the MLS feeds named on each listing page; deemed reliable but not guaranteed. Refreshed nightly.
The 60-Second Overview
Metrowest market snapshot (as of September 12, 2026): the median sale price is about $412K ($218 per sq ft over the trailing 12 months of closed sales), and a median 81 days on market for closed sales. The trailing-12-month median is up 4% from the prior 12 months, computed from record-level Stellar MLS closed sales (7 closings in the current window).
In ZIP 32835 (Orlando), 368 homes closed in the last 12 months at a median of $289K ($221/sq ft), down 8.2% year over year, with a median 57 days on market. Right now 118 active and 28 pending listings put supply at about 6.6 months - a buyer's market. See the live ZIP 32835 housing market and the Orange County market.
Stellar MLS sales records identify 334 homes in metrowest that have changed hands since 2004, built between 1987 and 2023 (median 1994), with a median living area of about 2,351 sq ft and a typical 4-bedroom, 2.5-bath layout; 99% are single-family homes. Source: Stellar MLS closed-sale history compiled by Momentum Research; counts reflect homes with a recorded MLS sale, not every home in the community.
MetroWest is an established Orlando community in Orange County where the housing stock spans several decades of construction, so the practical decision for most buyers is original versus updated rather than new versus old.
Who Metrowest is best for.
Best for
- Buyers targeting a moderate ~1,796-square-foot home who will pay a premium for turnkey condition
- Value buyers willing to budget for renovation on an original-era home and capture the upside themselves
- Owner-occupants who want an established, predominantly owner-held community over a rental-heavy one
Probably not for
- Buyers set on new construction who won't consider a home built near 1990
- Anyone needing a large footprint well above the ~1,796-square-foot median
- Investors seeking a rental-dominated pocket, given the roughly 70% homestead share
Price History: What Homes Here Have Actually Sold For
Median sale price over the trailing 12 months ending September 12 of each year, from record-level Stellar MLS closed sales. Same methodology as every appreciation figure on this page: the 2026 point ($412K) IS the median in the snapshot above, and the move from 2025 ($395K) IS the +4.2% one-year change.
Windows contain 0 to 10 sales each (7 in the current window); every figure carries its sample size, and thin markets swing on single closings. Based on Stellar MLS data distributed by MLS GRID for the period 2010 through 2026. Deemed reliable but not guaranteed.
The real cost & risk here
Before the list price, the Florida math the portals skip. These are Orange County typicals — your exact home, flood zone, and insurance quote will vary, so verify each before you offer.
Check it for your address: look up your flood zone (FEMA) · insurance by county · true-cost calculator · Orange County scorecard.
County typicals from Momentum’s Florida housing data (Zillow & Realtor.com aggregates, Census, FRED), updated monthly; insurance modeled. Flood zone is property-specific — always confirm via FEMA.
22% of homes for sale in ZIP 32835 are already under contract (under contract ÷ under contract + active listings) — a read on how much of the available inventory buyers have already claimed. Source: MLS data (2026-09-08).
Housing distress & ownership in metrowest rep, Orlando
Who owns here, how much is not owner-occupied, and how much for-sale inventory is under distress.
Source: Momentum Realty Research. Ownership & parcels from the FL DOR 2025 tax roll; distress from MLS active-listing status/remarks; price from MLS closed sales. Based on Stellar MLS data distributed by MLS GRID for the period September 2026 through September 2026. Deemed reliable but not guaranteed.
The Metrowest buying strategy.
If we were buying in Metrowest today, this is the order of operations we would run for our clients.
Underwrite the condition first. Price the roof, HVAC, and systems honestly before judging any list price; condition swings value here more than square footage alone.
Match the home to real comps. Recent sales of similar condition and lot, not the asking price, tell you what a home is worth.
Move deliberately, not desperately. Neither side has a decisive edge, so a well-prepared, fairly-priced offer wins without overpaying.
Line up financing and inspection early. A pre-approval and an inspection plan let you act fast and negotiate from evidence.
Keep an agent in your corner. The listing agent works for the seller; we represent you and prepare a hand-built valuation before any offer in Metrowest.
Condition over square footage
With a median build year near 1990 and homes reaching back to 1987, systems and finishes are the swing factor. Roofs, HVAC, kitchens, and baths from the original era are at or past replacement age, and that gap explains why two similar-sized homes can trade far apart. The median living area of about 1,796 square feet keeps most of this community in the moderate-footprint range, so upgrades and layout - not sheer size - are where value is made or lost.
The newest homes stretch to 2023, which means a minority of the stock is genuinely modern. That's an opportunity for buyers who want turnkey and a benchmark for sellers deciding how far to renovate. A homestead share around 70% signals a predominantly owner-occupied community, which typically translates to steadier upkeep and less churn than a rental-heavy pocket.
The location and the amenities are priced into every listing in Metrowest. The deal is won or lost on condition, the comps, and the renovation math.
Why work with Momentum here
In a community where the median home predates 1990, the whole game is reading condition against price. We walk the systems - roof, HVAC, kitchen, baths - and tell you what a listing's number actually reflects, so you're not overpaying for a cosmetic refresh or underestimating a full renovation. On the sell side, we help you decide which updates earn their keep against a moderate-footprint median so your home stands out from the older inventory.
Metrowest in 15 seconds.
HOA, CDD & Fees
- HOA status not on record. Verify any dues before you offer
- Any club/amenity membership is billed separately
Confirm the current HOA dues, exactly what they cover, and any CDD bond or special assessment for a specific address before you offer.
Tools for a Metrowest buy.
Free calculators to pressure-test the real cost before you tour.
Selling here is won on condition and pricing to real comps, not an automated estimate. The right number comes from closed Metrowest sales matched to your home.
Price it to the comps and condition, not an automated estimate.
If you are thinking about selling in Metrowest, the right list price comes from recent comparable sales matched to your home's condition and location, not an automated estimate.
What is your Metrowest home worth?
Get a no-obligation home value based on real comparable sales in Metrowest, not an automated guess. Tell us about your home and we will personally prepare your numbers and a pricing strategy. No obligation, no spam.
See all homes for sale in Orlando →
Frequently Asked Questions
What is the median home price in Metrowest?
How long do homes in Metrowest take to sell?
Who is the best real estate agent for Metrowest?
How do I find a top Orlando real estate agent who knows Metrowest?
Can Momentum Realty connect me with an agent for Metrowest?
Should you buy in Metrowest?
An honest fit check. We will tell you when it is not your community.
Data sources & freshness
| Community market stats | Stellar MLS closed sales, 12-month windows ending September 12, 2026 |
| Under-contract shares | Stellar MLS records, as of 2026-09-08 |
| Historical depth | Closed-sale records back to 2010 (72 transactions analyzed) |
Verify the primary sources yourself: Florida DOR · U.S. Census · FEMA flood maps · Citizens Property Insurance.
Momentum Research figures are our own analysis of Stellar MLS records; MLS data is deemed reliable but not guaranteed. Methodology: how Momentum market scores are computed. Market metrics describe homes for sale and recent sales, not residents.
Own a home here?
You just read the data. Now see what your home is worth.
The numbers on this page move markets in the aggregate. The number that matters to you is what a buyer pays for your address. Momentum sells for 1.25% above the Stellar MLS member average and 8 days faster, and we’ll price yours against live local comps.
Looking to buy here? Search homes for sale →
What’s your home worth in your area?
A real valuation with real comps from a local listing agent, not an instant algorithm. Response within one business day.
See how metrowest rep fits the bigger picture — live prices, inventory, and Momentum Scores:
Nearby Communities
Explore more neighborhoods near Metrowest with Momentum Realty’s local guides.
More Orlando & Orlando & Orange County guides
Compare before you commit - every guide covers pricing, HOA/CDD, insurance posture, and fit. Browse all of Orlando & Orange County or the full Neighborhood Finder.